

|
|
1.IntroductionFundus imaging is the essential retinal diagnostic procedure in ophthalmology. For many decades, the workhorses of clinical retinal examination have been the direct and indirect ophthalmoscope, the slit-lamp biomicroscope, and the fundus camera, and doubtless their well-deserved status will continue well into the future. However, complementary tools have been developed and are being enhanced that broaden diagnostic and therapeutic possibilities. A good example is the scanning laser ophthalmoscope (SLO).1 The SLO is a superior tool for rapid and continuous acquisition of high-contrast images of the ocular fundus and its structures, including the distribution of choroidal blood, melanin, and retinal pigments. Because it accommodates a variety of visible and near-infrared (NIR) wavelengths, the SLO is especially useful for the study and early diagnosis of diseases such as age-related macular degeneration (AMD) and diabetic retinopathy (DR).2 These are the leading causes of blindness in the elderly. The SLO is a powerful diagnostic tool for characterization of retinal pathologies, as well as for angiography, tomography, perimetry, and general psychophysics.3, 4 Confocal SLO imaging is less sensitive to scatter from out-of-plane tissue and is thus very effective in patients suffering from mild cataract, or from pathologies of the vitreous. These capabilities make SLO similar in its scope of clinical usefulness as optical coherence tomography (OCT), although OCT instruments are gradually beginning to supplant SLOs in the clinic because of their high-axial resolution, cross sectional retinal views, and the promise of new spectral-domain and swept source systems. Although they have become valuable diagnostic tools in the research community, scanning laser imaging devices are usually found only at specialized facilities and are used almost exclusively by ophthalmologists. Elderly and emergency patients are often unable or unwilling to travel to a specialized clinic for testing. But even the ubiquity of slit lamps, fundus cameras, and indirect ophthalmoscopes does not necessarily allow their use in many circumstances in which they may be indicated, such as emergency care. These devices may not be immediately accessible, and the primary care physician will not use instruments like binocular indirect ophthalmoscopes. The fall-back device is the direct ophthalmoscope, which has no image capture capabilities. The availability of hand-held and teleophthalmoscopic fundus imaging systems of standard types are increasing, but their cost remains high, and they continue to have the limitations discussed. Conversely, the digital LSLO instrument reported herein can be used as a relatively inexpensive multimode screening tool to facilitate rapid, nonmydriatic exams for large numbers of patients across a broad range of applications. Further clinical testing may prove that instrument portability allows early detection of AMD and other diseases in the elderly, where no economical early warning methods currently exist. The digital LSLO can complement existing diagnostics and telemedicine screening tools for detecting diabetic retinopathy. Many elderly patients may have difficulty in adapting their posture to the demands of standard retinal imaging instruments. Pediatric examination has similar constraints. The LSLO was designed to adapt to the needs of the patient. Since it is compact and lightweight, the LSLO can potentially be used as a hand-held primary care and emergency care aid. A low-cost, simplified version of the LSLO can be used by emergency medical technicians to detect papilloedema (indicative of elevated intracranial pressure associated with head trauma), blood in the vitreous, as well as for stereoscopic examination of the anterior segment and recording of pupil size and response. High-quality images of injured ocular structures can be captured in a fraction of a second and transmitted to a treatment center for diagnosis and advice. Veterinary applications include animal certification and identification. Many variations of line- or slit-scanning imaging devices have been investigated.5, 6 Ours is the first to solve the issues of compact lens-based design, true confocality, corneal reflection artifacts, and the engineering refinement and development necessary for a practical instrument.7 This work describes the optical imaging performance of the LSLO in comparison to alternate fundus imaging techniques, particularly the SLO, and presents initial results from a limited number of human volunteers. 2.Materials and MethodsConventional SLOs create high contrast en-face images of the retina by use of confocal detection and flying-spot scanning techniques. A confocal imaging ophthalmoscope uses a pinhole to reject light from adjacent voxels to greatly improve image detail. In a flying-spot camera, video rate images are achieved by scanning a focused spot in one dimension with a high-speed optical element (e.g., kHz line rates with a spinning polygon or resonant scanner), and in the second dimension with a lower-speed element (e.g., galvanometer-driven mirror). Conversely, the LSLO uses an anamorphic optical element to fan the beam on the retina in one dimension and a galvanometer to scan the beam in the other dimension. Light from the focused line is descanned and detected by a linear array sensor. This design has several advantages over conventional SLOs: 1. with only one moving part, the hardware and electronics are simplified: 2. the LSLO has a reduced number of optical elements, which results in a short optical path and compact design: and 3. the LSLO is inherently safer because the beam is focused in only one dimension on the retina. These advantages lead to a unit with low cost and compact dimensions suitable for hand-held operation. The tradeoff for these advantages is that the instrument does not achieve the confocality of the flying-spot SLO and requires slightly higher illumination power (up to ) than research instruments that use avalanche photodiode detectors and (but lower power than most commercial SLO instruments that use PIN photodiodes). Figure 1 shows a photograph of the optical bay of the prototype line-scanning laser ophthalmoscope. The instrument contains an optical bay, an electronics bay, a folding liquid crystal display (LCD), and a pair of liquid crystal shutter (LCS) glasses when stereo operation is required. The entire prototype instrument measures . The next-generation instrument will require miniaturization, battery operation, and human factor engineering for field and clinical use. Fig. 1Photograph of LSLO optical bay. Electronics, liquid crystal display, and shutter glasses are not shown.  2.1.Line-Scanning PrincipleThe LSLO achieves what we call “quasi-confocal” imaging because some light from adjacent voxels along the illuminated line can mix at the linear array detector. As a result, the axial resolution, characterized by a range gate function , is diminished compared to a truly confocal system. As we demonstrate in Sec. 3, however, the contrast and depth resolution of LSLO images is qualitatively similar to those from a flying-spot confocal SLO and significantly better than fundus camera images. Figure 2 illustrates the difference between the three approaches. A fundus camera uses flood illumination and a charge-coupled device (CCD) array to capture light from the entire imaged volume. A flying-spot SLO efficiently rejects light from outside the scanning voxel. The LSLO rejects the majority of light from adjacent voxels along the scanned line. We can perform an analysis to calculate the reduced confocality of the LSLO in comparison to a SLO. Fig. 2Comparison of imaging techniques. (a) Full-field imaging with a CCD array (or film). (b) SLO imaging with flying-spot illumination that is descanned to a confocal aperture. (c) Scanning line or slit imaging that is descanned to a linear detector array.  A rigorous approach using 3-D intensity point spread functions (PSFs) for both the excitation and detection paths is analytically intractable and is often performed numerically.8 Fortunately, the Gaussian beam intensity profile has a simple analytical form everywhere (ignoring truncation). The SLO incident beam intensity as a function of transverse and longitudinal coordinates is: where , is the incident power, and the beam waist function is defined bywhere is the Rayleigh range and is the beam quality (diffraction-limited ). In terms of the f-number in the eye ( , where the reduced focal length , the pupil diameter , and the refractive index ), the beam waist is , and the depth of field is . For simplified calculation of the optical range gate function, we assume the axial reflectance per unit volume is uniform across the beam (in ) and no local extinction losses are included. The reflected power at the confocal pinhole and approximate detector function are:where is the pinhole area, is the detection f-number, and is a “synthetic” representation of an Airy beam intensity profile for light collected over the pupil solid angle. To capture the essential transverse and axial behavior, we make the assumptions that uniformly back-scattered light is effectively represented by a plane wave outside the pupil, and that in the vicinity of the confocal aperture, the focusing pseudo-Airy beam waist profile can be adequately represented by a Gaussian beam waist functional form:where , and referred to the fundus, and is the magnification from retinal to image plane (this scaling leaves all beam parameters in physical retinal coordinates). The actual Airy intensity beam profile is the familiar Airy function at the pinhole, and a top hat at the pupil. Everywhere in between, however, the mathematical representation is too complex for this analysis. We assume incoherent illumination is employed, which is in fact the case for the data presented with broadband SLD sources. For constant , Eq. 2 is integrated over and normalized by the reflected power to yield the optical range gate function which is solely a function of the optical geometry:The function describes the efficiency of confocal light collection, and can be regarded as an optical section in a uniform volume-reflectivity medium, or equivalently as a profile scanned out by a uniform diffuse reflective surface as it traverses the confocal voxel. In the most general case, the pinhole diameter may be larger or smaller than the Airy disk. But below the Airy diameter, the resolution is not significantly improved and light collection is severely reduced. For an arbitrary pinhole size, we define to be the range at which equals the pinhole radius . For the mixed Gaussian/pseudo-Airy case, the range gate function (with normalization constant ) is then: is asymptotically and consequently integrable. For a diffuse reflector at the Gaussian beam waist in the eye, the confocal pinhole (diameter ) is set equal to the Airy disk diameter . For this near-optimal confocal pinhole, the half power points of areand the approximate axial and transverse resolution are:In this mixed approximation for the SLO with a 3 mm pupil at , is . For comparison, is 160.9. These theoretical limits are consistently of the typical experimentally observed SLO axial resolution of . This is due in part to aberrations and to selections of pinholes that may exceed the Airy disk for better light collection. The transverse resolution can be readily seen to be improved by confocal imaging relative to conventional microscopy or fundus camera imaging. In principle, in the Gaussian/pseudo-Airy approximation from before, an optimized pinhole can provide nearly a factor of 2 improvement. In practice, alignment, aberrations, scattering, and other effects limit these gains. For flood illumination imaging systems, is constant (i.e., no sectioning capability), though the depth of focus equals .For the LSLO, the range gate calculation is only slightly more complex, and some additional assumptions are needed to yield a tractable calculation. The incident line beam is Gaussian in one axis and distributed uniformly over a length in the other axis : As before, with fully overlapping Gaussian/pseudo-Airy PSFs, the reflected power on a single pixel of the linear array sensor of width isFor near optimum confocality, we set the detector path magnification to yield . Integration over is straightforward, but over is less so, due to out-of-focus contributions of Airy images from the adjacent line elements. The -axis overlap of out-of-focus laser line elements can be parameterized in yielding:The full width at half maximum (FWHM) isbut has a different meaning for axial resolution, since is not integrable in . Therefore, configured this way, LSLO has no mathematically defined intrinsic sectioning capability. However, since the LSLO separates input and output apertures (usually into three approximately equal subapertures, not least to eliminate the corneal reflections to which it is susceptible), the PSFs only overlap near the focal plane. Truncated Gaussians with the Airy beam scale can be incorporated by integrating obliquely intersecting PSFs over the correct limits. For simplicity, we use the pseudo-Airy form for both passes and single-sided overlap for two equal subapertures:where is the -dependent truncation limit of integration. A reasonable choice is , which allows full overlap at focus, and none at the pupil. This supports the suitability of the pseudo-Airy approximation: within an axial length of the focal position, a true 3-D Airy PSF begins to flatten on axis. However, the oblique overlap of the PSFs in the split-pupil LSLO minimizes the sensitivity to this effect. truncation at the pupil for both subapertures allows no overlap there. No attempt has been made here to account for the fact that the subapertures are rectangular. With these assumptions, the range gate function becomes:which is now integrable. The FWHM is graphically estimated to be . The dominant term is the overlap function (the exponential term). The range gate functions defined by Eq. 6 (SLO), Eq. 10 (LSLO with fully overlapping input and output PSFs), Eq. 12 (LSLO oblique PSFs with truncation), and the measured LSLO depth of field at the retinal conjugate are shown in Fig. 3 . The calculation assumes an ideal eye with a 3 mm pupil, reduced focal length , , and .Fig. 3Theoretical SLO and LSLO range gate functions. Shown are calculations for SLO, LSLO with fully overlapping beams, LSLO with oblique truncated beams, and the actual LSLO depth of focus measured at the retinal conjugate. 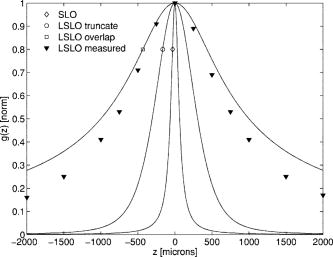 The LSLO optical design uses subapertures that are approximately one-third of the available 3 mm pupil. The transverse Airy disk diameter referenced to the retina is , which corresponds to at the detector plane for the magnification used. Each pixel of the linear detector array, confocal pinhole, is thus well-matched to the Airy disk. The near-optimal LSLO axial resolution is . The measured LSLO axial resolution is , approximately 2.6 times greater than the theoretical minimum. This is probably dominated by the difficulty of precisely achieving axial confocal alignment of the incident beam waist and the detection path PSFs: an axial mismatch of just a few can quickly degrade axial resolution. In practice, the previous results would include the factor for optical and ocular aberrations that, along with nonuniform reflectance and localized absorption and scattering, further diminish resolution. 2.2.Optical DesignThe unfolded optical layout for the LSLO is shown in Fig. 4 . The illumination light is collimated and spread in one dimension with a cylindrical lens (CL) and coaligned to the return (detection) path with a beam-combining optic (BC). The line is focused onto the retina with a scan lens (SL) and ophthalmoscopic lens (OL), and scanned with a galvanometer-driven mirror (G). The back-scattered light from the retina is de-scanned by the galvanometer through the pupil stop (PS) and focused onto linear arrays (LA) with the detector objective (O). The closed-loop galvanometer (Cambridge Technology, Inc., Cambridge MA) electronic board is driven from a custom camera board (see Sec. 2.3) with a saw-tooth signal to produce -pixel images at or . The beam-displacement optic (BD) separates and displaces left and right subapertures for stereo operation. The linear array is magnified by 1.3 to the retinal conjugate (between SL and OL), and depending on OL, demagnified to the retina. 40- and 66-diopter (D) ophthalmoscopic lenses are typically used, with demagnification (from conjugate to retina) of 1.67 and 1.0, respectively. The optics produce angular fields on the retina of and for the 40D and 66D lenses. The scan lens (EFL ) and detector objective (EFL ) are multielement objectives designed to achieve good field flatness and near-diffraction-limited operation with low chromatic aberrations. Fig. 4Unfolded view of LSLO optical path. S: source, L: lens, CL: cylindrical lens, SL: scan lens, OL: ophthalmoscopic lens, O: detector objective, G: galvanometer, BC: beam combining optic, PS: pupil stop, BD: beam displacement optic, and LA: linear array sensor. 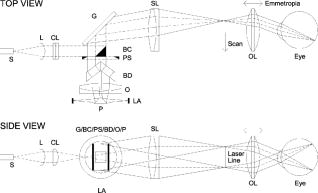 The system is designed to work without administration of mydriatic agents with a 2 to 3 mm pupil. The pupil is transferred to a conjugate (between BC and G) to a diameter of or for 40D or 66D OL, respectively. The pupil is split into three parts: left and right subapertures for stereoscopic imaging, with BC placed in the center at the pupil conjugate to block corneal reflections from detection. BS consists of two identical 5 mm windows fused at an angle of . BS is used to displace the beam before the detector objective to achieve stereopsis. Without it, rays originating from the same structure will follow identical paths to LA and produce no disparity. This design allows a single (multielement) high-quality objective to be used in lieu of two detector objectives. However, this may result in reduced stereopsis, because the displacement is limited to prevent overlap of left and right subapertures. The angle of the windows produces a lateral separation of between subapertures at the pupil. This separation can be used to present on an external CRT monitor live stereoscopic images of the retina or anterior segment to an ophthalmologist wearing LCS glasses. By setting the left and right images to the two fields of an interlaced video, and driving the LCS glasses with a field synchronization signal (i.e., left and right side alternately with the interleaved frames), 3-D images of ocular structures are obtained. While the LCD presents the instantaneously acquired image(s), the persistence of these displays makes them currently unsuitable for stereoscopic imaging with the LCS glasses. Thus, at present, an external CRT monitor is required to view the live images in the stereoscopic mode. Future designs may incorporate low-cost wearable 3-D display technology. The optical bay is illustrated in Fig. 5 . The optical bay has room to house the electronic driver boards for source module and galvanometer. In a fully engineered system, the source module (SM) may contain driver electronics and multiple laser diodes of differing wavelengths (e.g., 532, 670, 780, 830, and/or ) combined with dichroic beamsplitters. For the experiments detailed in this work, external laser and superluminescent diodes at wavelengths of 670, 780, 830, and 905 nm were used with an internal fiber collimator (15 mm focal length, 3 mm input beam diameter). The pupil splitting optic (P) directs the left and right subapertures to their respective detectors. The LSLO can operate in numerous modes, including standard wide-field line-scanning operation, stereoscopic operation, as a pupillometer (with OL removed and eye placed at the SL focus), and with multiple wavelengths. As with any ocular imaging instrument, eye motion can be problematic for acquisition of high-contrast images. We have built a 1-in. square LED matrix display driven with simple commands over a serial port that can be integrated into the system (for example, behind the galvanometer mounted with a dichroic beamsplitter) or used externally (with opposite eye) for fixation. For the images presented here, an external fixation target was used. 2.3.Electronics DesignWe have operated the LSLO untethered to a PC with custom designed and constructed camera and image processing electronics. A block diagram of the LSLO electronics is shown in Fig. 6 . For the purpose of testing and characterization, however, the instrument was tethered to a PC and the detector signals (Dout) were sent to an image framegrabber (National Instruments, Inc., Austin TX). Significant engineering effort is still required to condense the electronics and display footprint. Fig. 6Block diagram of LSLO camera and control boards. DA: differential amplifier, D/A: data acquisition chip, AO: analog out, Vin: voltage input, and Dout: digital lines out. 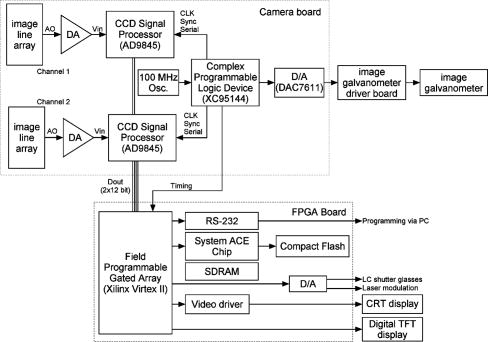 Two stacked printed circuit boards are used to control the instrument. The camera board contains the analog front-end chips (Analog Devices, Inc., Norwood MA) and a complex programmable logic device (CPLD, Xilinx, Inc., San Jose CA) to control all camera timing. The camera board also creates an analog signal with a DAC chip to drive the galvanometer. This signal is synchronized to the detector timing waveforms. A field programmable gated array (FPGA, Xilinx, Inc.) board performs all signal processing functions. Pixel data from the camera boards is processed and displayed on the LCD monitor, and saved to a compact flash card. The image data can also be displayed on an external CRT monitor. The FPGA board also creates a field synchronization signal for the LCS glasses (i-O Display Systems, Inc., Sacramento CA), which are worn by the ophthalmologist for stereoscopic views of the retina (on the CRT monitor). The LSLO uses complementary metal oxide semiconductor (CMOS) linear arrays (Pixel Devices International (PCI), San Jose CA). In general, CMOS detectors have equivalent or slightly better sensitivity but significantly higher read noise, and thus a smaller dynamic range than CCD detectors. However, since signals are converted from charge to voltage for each CMOS pixel, digitization can be built into each pixel on the chip. This results in higher line rates, lower power dissipation, and smaller overall camera size at the expense of pixel uniformity. The PDI linear array has excellent sensitivity and very low noise compared to other CMOS arrays. In fact, the active reset technology developed by PDI achieves lower noise than comparable CCD sensors.9, 10 Each pixel has a well depth of 21,000 electrons, and the read noise is six electrons (dynamic range ). The linear array is long and consists of 512 pixels with a pitch of . The maximum line rate is but higher fixed pattern and read noise at the highest pixel rates dictates normal operation at . 3.ResultsThe LSLO imaging performance was characterized using an AF resolution chart and other targets placed at the retinal conjugate (Fig. 7 ). The resolution was determined from Rayleigh’s criterion by measurement of line profiles across the line pairs [Fig. 7a]. The minimum resolvable line pair was determined by comparison of the intensity of pixels between lines with the saddle point . The LSLO was able to resolve 17.9 line pairs per millimeter or roughly two times the magnified pixel size in both vertical (along the array) and horizontal (perpendicular to the array) dimensions. For comparison, the main retinal arteries are , and the smallest retinal capillaries are 10 to . The image of the back of the dollar bill shows good field flatness. Fig. 7Measurement of LSLO resolution and field flatness. (a) Horizontal and vertical line profiles through (b) AF resolution chart group 4, element 2 (indicated in box). Pixels between minima are above saddle point. (c) Image of dollar bill. Scale bar . 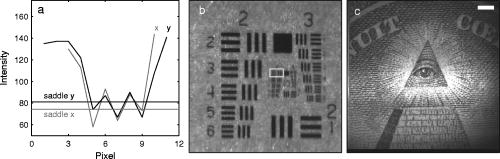 The LSLO was tested initially on five human volunteers using various operational conditions. For all illumination wavelengths except , the power was less than , or roughly 50 times below American National Standards Institute (ANSI) maximum permissible exposure levels. (The LSLO is inherently safe, even in the event of scanner failure, up to a power of at , because the anamorphic optical element prevents focus to a spot on the retina.) At the visible red wavelength , was used to prevent patient discomfort. Figures 8a and 8d show images acquired from the LSLO, in comparison to other imaging techniques in Figs. 8b, 8c, 8e. Figure 8b was obtained from a conventional research SLO and Figs. 8c and 8e were obtained from the same commercial retinal imaging instrument. The latter operates in multiple modes, including live infrared-wavelength fundus videography (FV) shown in Fig. 8c, and green-wavelength (red-free) flash fundus digital photography (FP) shown in Fig. 8e. This instrument operates using the principles of flood illumination and CCD detection shown in Fig. 2a. These images show typical performance for this instrument; many manufacturers are able to use alternate techniques and color imaging to enhance the contrast and appearance of non-SLO images. The disc has a bright appearance in the FV and FP images compared to the confocal images. This indicates that light is collected from deep layers (e.g., lamina cribrosa) from within the disc. Figure 8e shows improved contrast compared to Fig. 8c, because the fundus is illuminated with a bright flash at a wavelength that has high absorption by blood and pigment. Figure 8f shows line profiles through the same vessels from the images shown in Figs. 8a, 8b, 8c. The location of the five vessels is indicated by arrows, only three of which are discernible in the FV image. The Michelson contrast [(max-min)/(max+min)] measured across the largest vessel in the profiles of Fig. 8f for the LSLO image is actually higher than that of the SLO image (0.39 versus 0.25), perhaps due to SLO detector saturation. LSLO contrast is greater than two times that of FV (0.39 versus 0.14). Fig. 8Comparison of LSLO to other imaging techniques. (a) LSLO image, (b) SLO image, and (c) fundus videograph (FV) of the same eye. (d) LSLO image and (e) flash fundus digital photograph of the same eye. (f) Line profiles [indicated in images (a), (b), and (c)] through identical vessels (indicated by arrows). All are raw, unprocessed images.  With the 40 and 66 diopter (D) ophthalmoscopic lenses, the image field on the retina is 29 and (8.6 and ), respectively. Figure 9 shows typical LSLO images at both field sizes. The disc and macular region can be seen with both lenses and, in this subject, the foveal reflex (arrow) is also clearly visible. In this and all figures presented in this work, the images are not processed or otherwise manipulated in any way. Fig. 9LSLO images taken of the same eye with (a) 40- diopter and (b) 66-diopter ophthalmoscopic lenses. Horizontal or vertical field of view is and , respectively. Foveal pit is clearly visible (arrow) in both images. Scale bar . 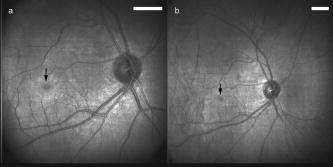 Figure 10 shows wide-field LSLO images acquired from another subject at three different wavelengths (905, 830, and ) and the false-color composite generated from mapping the wavelengths to RGB color planes. In all cases, the images display high-contrast features typical of a conventional SLO image. The retinal vessels are sharp and the fovea pit is visible at all three wavelengths. At , the higher blood and pigment absorption lead to darker vessels and macula compared to longer wavelengths. The increased macular pigment absorption in Fig. 10b yields the blue-reduced macular region in Fig. 10a. At , the choroidal vasculature becomes more visible due to the increased penetration depth (i.e., reduced scattering) of the longer wavelength light. Fig. 10LSLO images at different wavelengths. (a) Composite image taken by combination of single LSLO images of the same eye at (b) 670, (c) 830, and (d) , mapped to blue, green, and red color planes, respectively (color online only). 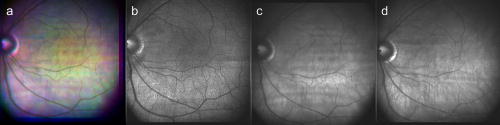 The reduction of speckle by use of broadband light sources was measured. Figure 11 shows two images acquired at , one with a narrowband laser diode (LD) and one with a superluminescent diode (SLD) with a bandwidth of . The SLD image is clearly smoother. Figure 11c shows the histogram of a small pixel region of interest from the same featureless portion of the retina indicated by the boxes in Figs. 11a and 11b. The standard deviation of the SLD and LD histograms are 10 and 21, respectively. SLDs are currently quite a bit more expensive than LDs, and would be used in the LSLO only for applications where it was necessary to completely minimize speckle artifact. Stereoscopic pairs can naturally suppress speckle artifact, because the speckle is not correlated between images. Fig. 11Single LSLO images of the same eye taken with (a) superluminescent diode and (b) laser diode at and . (c) Histogram of regions of interest indicated in (a) and (b). 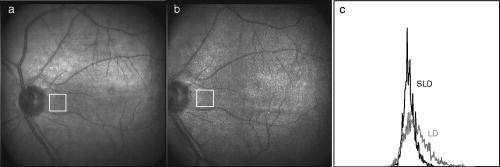 Finally, the operation of the LSLO in stereoscopic mode is illustrated in Fig. 12 . While we refrain from the difficult presentation in this format of stereoscopic images, we can describe the logistics of the acquisition and display. Single confocal images from the left and right detectors are acquired simultaneously and transferred via digital lines (12 bits each) to either the FPGA or framegrabber boards as interlaced video. Software can extract even and odd fields [Figs. 12b and 12c] or display the live interlaced video [Fig. 12a]. LC shutter glasses will alternately block the left and right eyepieces synchronously as even and odd lines are scanned on a CRT display. A stereoscopic image is thus presented to the technician or ophthalmologist. The stereopsis visualized may not be as dramatic as that seen in other imaging instruments because of the shorter LSLO depth of field. In a sense, stereoscopic operation is antithetical to a confocal instrument with good intrinsic sectioning capabilities, because of the requirement that light is incident upon and detected from numerous layers within a large depth of field. The LSLO axial resolution calculated in Sec. 2.1 may be just sufficiently large enough to achieve stereopsis. 4.DiscussionThe LSLO was specifically designed with the overall objective of reduction of the size, cost, and complexity of confocal retinal imaging devices. Confocal scanning laser ophthalmoscopy is an important tool for ophthalmologists in the detection of retinal diseases such as AMD and DR,3 but is currently used in only specialized clinical and research environments. With the proliferation of digital cameras in the consumer market in the past few years, our goal is to eventually reduce the size of an LSLO to equivalent dimensions. Digital electronic technology now exists to efficiently capture and process digital images and videos. The use of advanced CMOS detectors that do not suffer from the high read noise that plagued their predecessors is one advancement of the LSLO.8, 9 A reduction in the cost, power requirements, and overall size of detector electronics may be advantages of CMOS technology over CCD technology. FPGA technology has also emerged to combine the flexibility advantage of microprocessors with the performance advantage of applications-specific integrated circuits (ASIC). While digital cameras have relatively simple optics due to the fact that they are passive full-field detectors, SLOs by their very nature require illumination optics, scanning elements, pinholes, and detector objectives. In a typical flying-spot configuration, they also contain transfer optics, since both scanning elements must be placed at pupil conjugates. All of this optomechanical hardware makes the traditional SLO nearly impossible to reduce to the size of the footprint of a commercial digital camera. Conversely, the LSLO is able to greatly simplify the optics with an innovative technique of line-scanning illumination and detection. While this approach does not achieve the scattered light rejection performance of a flying-spot SLO, it does produce nearly equivalent, quasi-confocal images as seen in Figs. 8, 9, 10, 11, 12. The LSLO is thus not intended to provide all of the performance and functionality of more advanced commercially available systems, but rather to achieve nearly equivalent imaging performance in a compact, low-cost unit. However, the LSLO does contain many features and imaging modes for use in a wide variety of applications that may be implemented with increasing complexity, depending on the requirements of the user. In a very simple implementation, the LSLO will take and record single confocal retinal images or video for diagnosis of degenerative retinal diseases such as AMD or DR, or for remote telemedicine applications. Another implementation may require simultaneous illumination and detection for retinal vascular diagnostics. The live stereoscopic mode can be used for detection of disc excavation or papilloedema in patients with glaucoma or acute head trauma, respectively. Anterior segment imaging can be used for pupillometry. Such versatility and affordability will make this device attractive in several markets, ranging from GP screening in the elderly to pediatric examination, and from field use and emergency care to optometry and ophthalmology. AcknowledgmentsThis work was funded by the National Institutes of Health (National Eye Institute) under grant EY11819. D.X. Hammer is especially indebted to A.J. Welch for his guidance and encouragement while at the University of Texas at Austin. ReferencesR. H. Webb,
G. W. Hughes, and
F. C. Delori,
“Confocal scanning laser ophthalmoscope,”
Appl. Opt., 26 1492
–1497
(1987). 0003-6935 Google Scholar
A. E. Elsner,
M. Miura,
S. A. Burns,
E. Beausencourt,
C. Kunze,
L. M. Kelley,
J. P. Walker,
G. L. Wing,
P. A. Raskauskas,
D. C. Fletcher,
Q. Zhou, and
A. W. Dreher,
“Multiply scattered light tomography and confocal imaging: Detecting neovascularization in age-related macular degeneration,”
Opt. Express, 7 95
–106
(2000). http://www.opticsexpress.org/abstract.cfm?URI=OPEX-7-2-95 1094-4087 Google Scholar
A. E. Elsner,
A. H. Jalkh, and
J. J. Weiter,
“New devices in retinal imaging and functional evaluation,”
Practical Atlas of Retinal Disease and Therapy, 19
–35 Raven Press, New York (1993). Google Scholar
R. D. Ferguson,
D. X. Hammer,
A. E. Elsner,
R. H. Webb,
S. A. Burns, and
J. J. Weiter,
“Wide-field retinal hemodynamic imaging with the tracking scanning laser ophthalmoscope,”
Opt. Express, 12 5198
–5208
(2004). https://doi.org/10.1364/OPEX.12.005198 1094-4087 Google Scholar
R. H. Webb, and
D. P. Wornson,
“Scanning optical apparatus and method,”
(1988) Google Scholar
Q. Y. J. Smithwick,
A. E. Elsner,
R. A. Schwarz,
J. B. Stewart,
M. C. Cheney, and
A. Weber,
“Contrast and resolution comparisons between the GDx MP1, and a prototype scanning laser digital camera,”
Invest. Ophthalmol. Visual Sci., 45 1135
(2004). 0146-0404 Google Scholar
R. D. Ferguson,
“Line-scan laser ophthalmoscope,”
(2004) Google Scholar
K. Venkateswaran,
A. Roorda, and
F. Romero-Borja,
“Theoretical modeling and evaluation of the axial resolution of the adaptive optics scanning laser ophthalmoscope,”
J. Biomed. Opt., 9 132
–138
(2004). https://doi.org/10.1117/1.1627775 1083-3668 Google Scholar
B. A. Fowler,
M. Godfrey,
J. Balicki, and
J. Canfield,
“Low-noise readout using active reset for CMOS APS,”
Proc. SPIE, 3965 126
–135
(2000). 0277-786X Google Scholar
B. Fowler,
“Low noise active reset readout for image sensors,”
(2002) Google Scholar
|


