
|
|
1.IntroductionUnderstanding conformational dynamics of nucleic acids has long been a major interest in biochemistry and biophysics, and a great deal of progress have been achieved using various spectroscopic techniques. In particular, fluorescence or luminescence measurements using externally labeled DNA molecules or DNA with fluorescent nucleotide analogs, like 2-aminopurine, have provided considerable insight into the dynamics of DNA and DNA–protein interactions. Fluorescence detection allows assessment of dynamic information over a broad range of time scales. For example, fluorescence anisotropy decay measurements provide dynamic information on the picosecond to nanosecond time scale.1 On the other hand, rapid-mixing stopped-flow measurements of fluorescence anisotropy or of conformation-dependent fluorescence signals can be performed on the millisecond and second time scales, reporting about dynamics of protein-DNA in teractions.2, 3 New advances in fluorescence correlation spectroscopy (FCS) and single molecule fluorescence microscopy have also provided an additional means for studying DNA dynamic properties on the millisecond and submillisecond time frame.4, 5, 6 However, most of the FCS or single molecule studies have been performed using external fluorophores that have been attached to the DNA backbone or bases. Coupling rather bulky dye molecules in this way can substantially affect the properties of the DNA, such as binding and interaction dynamics. This becomes particularly important when the conformational dynamics of particular DNA bases is considered. In this case, detection of fluorescence from inherently fluorescent nucleic acid base analogs can provide a significant advantage for dynamic studies. Unfortunately, the available fluorescent nucleic acid base analogs require UV or near-UV excitation. FCS studies of two fluorescent nucleotide analogs, 2-aminopurine (2AP),7 and 3-methylisoxanthopterin (3MI),8 have been performed to evaluate the feasibility of using FCS to study DNA dynamics. However, UV excitation resulted in a decrease in the signal-to-noise in FCS measurements due to higher light scattering and significant photobleaching of fluorophores.7, 8 An alternative approach is to use multiphoton excitation. Multiphoton excitation is achieved when a molecule simultaneously absorbs two or three low-energy photons, providing a total energy sufficient to cause the transition into the excited singlet state. Multiphoton excitation has gained particular popularity in microscopy, where excitation light from mode-locked infrared lasers (usually Titanium:sapphire) can be tightly focused to achieve effective excitation of fluorophores via two- or three-photon absorption. Multiphoton excitation is achieved only above a certain power threshold because of the requirement for simultaneous absorbance of multiple photons. Therefore, the excitation volume is intrinsically confined, a significant advantage for both microscopy and FCS measurements. Additionally, scattered excitation light, in particular Raman scattering, can be easily filtered, and fluorophore photobleaching is also limited to the excitation volume rather than occurring throughout the focal cone. Two- and three-photon excitation has already been demonstrated for a variety of molecules (intrinsic fluorophores) absorbing in the near-UV or UV region.9, 10, 11 Comparison of the one- and two-photon excitation of coumarin showed that two-photon excitation might be effectively used to detect single molecules of relatively bright UV fluorophores.12 A recent study, which characterized properties of the fluorescent DNA base analog 4-amino-6-methyl-isoxanthopterin (6MAP) using two-photon excitation,13 showed that two-photon absorption cross-section of this fluorophore is quite similar to the two-photon cross-sections of coumarin (although this nucleotide analog does not have as high fluorescence quantum yield). Therefore, it is reasonable to expect that two-photon excitation of fluorescent nucleotides can be effective used in FCS or even single-molecule studies. We have investigated the multiphoton excitation properties of two other fluorescent nucleotide analogs: 2-aminopurine and 6-methylisoxanthopterin. 2-aminopurine (2AP), a fluorescent analog of adenine, has been widely used for DNA base dynamics and DNA-protein interaction studies. Absorbance and fluorescence spectra of 2AP are red-shifted relative to the absorption spectra of DNA and proteins, with an absorbance maximum at and a fluorescence maximum near . This allows selective excitation of 2AP in the presence of proteins in the sample. 2AP has a high fluorescence quantum yield, 0.68, and a long excited state lifetime, , when it is free in the solution.14 Incorporation of 2AP into single-stranded or double-stranded DNA leads to quenching of its fluorescence, mostly due to base stacking interactions. However, when the 2AP base is removed from base stacking in the DNA helix, it becomes highly fluorescent again. This property makes 2AP useful for studying DNA base dynamics during DNA hybridization,15, 16 RNA folding,17 or for investigating DNA base flipping, which occurs when DNA modifying enzymes (like methyltransferases or polymerases) flip the base out of the helix to perform chemical reactions on it or for proofreading purposes.2, 18 Another fluorescent nucleotide analog considered in this work is 6-methyl-isoxanthopterin (6MI), an analog of guanine.19 Like 2AP, the spectral properties of 6MI are also appropriate for studying DNA or RNA base dynamics. 6MI, when incorporated into DNA, has an absorption spectrum with a maximum at and a fluorescence spectrum with a maximum at . The fluorescence yield of the free molecule in aqueous solution is 0.7 (relative to quinine sulfate), and the lifetime of the fluorescence decay is about . As is the case for 2AP, fluorescence from 6MI is quenched when the molecule is incorporated into single-or double-stranded DNA due to base stacking interactions, while removal of the base from the base-stacked configuration (either by excision of the base or base bulge formation) restores the fluorescence yield to the free base level. Even though the structure of 6MI consists of a more bulky pteridine, the presence of the amino group in the position 2 allows this molecule to participate in base pairing with cytosine in double-stranded DNA.19 We should note that 6MI is very similar in its properties to 3MI, which previously has been characterized using one-photon (UV) excitation FCS.8 It has been shown that single-molecule detection for 3MI is complicated due to low signal-to-background ratio when using excitation. This problem might be overcome using two-photon excitation. Here, the fluorescence properties of 6MI and 2AP are investigated using two- or three-photon excitation, respectively, rather than single-photon excitation in the UV. Fluorescence correlation spectroscopy is used to study the diffusion dynamics of the base analogs and to evaluate the possibility of using multiphoton excitation FCS for studying DNA base dynamics. 2.Materials and Methods2AP, 6MI, and 7-amino-4-methylcoumarin (coumarin 120) were purchased from Sigma and used without further purification. Solutions of 2AP and 6MI of varying concentrations were prepared in nanopure water. Coumarin was dissolved in ethanol at about concentration and subsequently diluted in ethanol and/or water to obtain sample concentrations of . Concentrations of samples were checked by measuring the absorption spectra of the samples and calculating the concentrations using literature-reported extinction coefficients ,20 ,14 .21 A 6MI-labeled DNA oligonucleotides ( 6MI-TGTGGAGCATCTCGAGCAGT and TTTTGGTAGCTAG(6-MI)AATTACCGATGACGTGCTTCCC ) and corresponding reverse complementary unlabeled oligonucleotides were purchased from Trilink Biotechnologies (San Diego, CA). -diameter blue-fluorescent polystyrene beads were purchased from Invitrogen (Carlsbad, CA). Absorption spectra were measured using a Cary-500 spectrophotometer (Varian). Fluorescence spectra were measured using a home-built fluorimeter based on SpectraPro 150 monochromators (Acton Research) and an air-cooled CCD camera (Princeton Instruments). Multiphoton excitation of 2AP and 6MI fluorescence was achieved using the fundamental output of a Ti-sapphire laser (broadband Tsunami pumped by 10W Millennia Xs, Spectra Physics). Power of the laser beam was attenuated using neutral density filters (Newport) and also circular variable optical density filter (Edmund Scientific, OD range from 0.04 to 1). Power was adjusted before the beam was expanded to minimize the distortion of the beam profile (beam profile was checked using Spiricon beam profiler LBA-700PC using Coherent’s LaserCamII CCD camera). Then, the laser beam was expanded using a 5X Galilean beam expander (BE05-B, IR antireflective coating, Thorlabs), raised to the proper height using a precision beam steerer (Newport) and directed into Nikon TE2000 microscope using two gimbal-mounted mirrors (10D20ER.2, Newport). A 790dcspt dichroic filter (Chroma) was used for three-photon excitation of 2AP (Chroma filter was used for three-photon excitation because of its superior transmission in region) and 675DCSP-EX dichroic filter (Omega Filters) was used for two-photon excitation of 6MI. The sample was excited by focusing the laser light to a diffraction-limited spot achieved by overfilling the back aperture of an SFluor 100X objective (Nikon, CFi-60, 1.3 NA, oil immersion). Fluorescence was collected using the same objective and passed through a dichroic mirror that was used to bring the laser light to the objective. 2AP fluorescence was filtered using a D380/50 emission filter (center wavelength , bandwidth, Chroma) and photons were recorded using a cooled multichannel-plate photomultiplier tube (R3809U-50, Hamamatsu). The signal from the detector was amplified using a fast amplifier C5594 (Hamamatsu) and recorded using a SPC-830 single-photon counting board (Becker & Hickl). Fluorescence of 6MI was filtered using a D430/100 filter (Chroma) and detected using an avalanche photo diode detector (SPCM-AQR12, Perkin Elmer). Multiphoton fluorescence excitation spectra and power dependence were recorded by measuring the fluorescence intensity as an average number of counts (photons) per second, results were corrected for background intensities, which were measured from nanopure water under the same excitation conditions. Background values were minimal, indicating that combinations of dichroic and emission filters used for measurements were adequate (identical results were obtained if additional IR laser blocking filters, like BG-39, were used). All fluorescence intensity and correlation measurements were performed by exciting samples with laser pulses at the standard Ti-sapphire mode-locking frequency of . Multiphoton excitation spectra were measured by tuning the fundamental output of the Ti-sapphire laser between 840 and for 2AP or between 700 and for 6MI, while maintaining the same average power (measured at the objective focal point at each excitation wavelength using a power meter, 818-UV from Newport) and the same (as much as possible) spectral bandwidth (monitored by laser spectrum analyzer (IST) at the laser output). We were not equipped to measure the laser pulse duration at the sample, however, using previously published results of group delay dispersion (GDD) in microscope objectives,22, 23 we can estimate that laser pulses of about at the Tsunami output broaden to about at the sample plane. Because of the long 2AP and 6MI lifetimes, lifetime measurements were performed using a fourfold reduced Ti-sapphire laser output repetition rate . The repetition rate was reduced using an electro-optical light modulator 350–160 (ConOptics), which was inserted into the beam path right at the output of the Tsunami laser (note that the modulator has been used only for lifetimes measurements). Fluorescence decay kinetics were measured using a delay window with 4096 channels ( per channel resolution). A typical instrument response function using the MCS-PMT detector had a full-width at half maximum of about . 6MI fluorescence autocorrelation measurements were performed using a digital correlator card Flex2K- (Correlator.com). In the case of 2AP, the fluorescence time traces were measured using the FIFO (first in, first out) mode of the SPC-830 card, and then the autocorrelation curves were calculated digitally. 2.1.Determination of Two-Photon Cross-Section for 6MIThe two-photon cross-section of 6MI was determined in comparison to a reference sample (7-amino-4-methylcoumarin) based on the equation where and are the two-photon cross-sections of the reference and sample compounds, and are the wavelength-dependent fluorescence quantum yields of the reference and sample, and are the concentrations of the reference and sample, and are the integrated fluorescence intensities of the reference and sample, and and are the integrated average laser powers for the reference and sample.24 Absolute two-photon absorption cross-sections are measured in or Goeppert–Mayer (GM) units . From Eq. 1, it follows that the two-photon absorption cross-section of the sample can be easily determined if the sample and reference materials are investigated at the same concentration and using the same excitation conditions.2.2.Calibration of Two-Photon Excitation VolumeTo analyze the two-photon excitation FCS results for 6MI, the excitation volume was calibrated using -diameter blue-fluorescent beads. The diffusion coefficient for the spherical particles can be calculated based on the Stokes–Einstein formula: where is the Boltzmann’s constant, is the temperature, is the viscosity of the solvent, and is the Stokes (hydrodynamic) radius of the particle. Using Eq. 2, the diffusion coefficient of the -diameter beads dissolved in water at room temperature is .Assuming a Gaussian profile for the excitation volume, fluorescence autocorrelation curves can be described using the equation where is the number of molecules in the excitation volume, is the characteristic diffusion time through the probe volume, and and are the radial and axial dimensions of the excitation volume, respectively. In the case of two-photon excitation, the characteristic diffusion time is defined as25, 26 Fluorescence autocorrelation of the fluorescent beads measured using two-photon excitation can be fitted to obtain excitation volume parameters using the equationwhere is the average number of the beads in the probe volume, is the diffusion coefficient, is the excitation volume diameter, and is the excitation volume axial dimension. Using the calculated diffusion coefficient, the excitation volume diameter was estimated to be , and was estimated to be about , corresponding to an excitation volume of approximately 0.7 femtoliters.3.ResultsFluorescence of 2AP and 6MI was readily detectable upon excitation of the samples with the fundamental output of the Ti-sapphire laser using an average power of several milliwatts for 6MI and about for 2AP. The dependence of the fluorescence intensity on the average excitation power was measured to verify that 6MI and 2AP fluorescence was generated by two-and three-photon excitation, respectively (see Fig. 1 ). Excitation of 6MI with laser pulses leads to a quadratic dependence of the fluorescence intensity on the excitation power (the slope of the log(Fluorescence Intensity) versus log(Excitation Power) dependence is 2, see Fig. 1). Three-photon excitation of the 2AP, on the other hand, requires more intense, longer wavelength pulses; 2AP fluorescence intensity depends on the cube of the excitation power (the slope of the line is 3; see Fig. 1). Fig. 1Fluorescence intensity dependence on excitation power measured for two-photon excitation of 6MI (squares) and three-photon excitation of 2AP (triangles). The lines represent linear fits of the data. The slope of the 6MI data is , and the slope of the 2AP data is . 6MI was excited at , 2AP at . 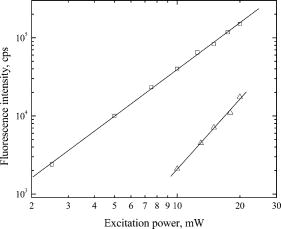 Two-and three-photon excitation spectra of 6MI and 2AP, respectively, were measured and the multiphoton excitation spectra were compared with the single-photon 1-T spectra (see Fig. 2 ). The spectra in both cases were obtained by changing the fundamental wavelength of the Ti-sapphire laser, while keeping the excitation power and pulse duration (as much as possible) constant. The two-photon excitation spectrum of 6MI was measured in the range of ; in general, it matches the long-wavelength edge of the regular absorption spectrum (Fig. 2a). Due to limitations of the Ti:sapphire laser tuning range ( using broadband optics set), it was impossible to measure an excitation spectrum over the whole absorption band. On the other hand, a more complete three-photon excitation spectrum of 2AP was collected, and it is quite distinct from the one-photon excitation spectrum. Its maximum is significantly blue-shifted ( versus ) and the width is significantly narrower compared to the one-photon excitation spectrum (see Fig. 2b). Fig. 2Comparison of 6MI (a) and 2AP (b) 1-T spectra (solid lines, top-right axis) with two- and three-photon fluorescence excitation spectra (circles, bottom-left axis), respectively. Excitation spectra were measured by changing the fundamental Ti-sapphire wavelength while maintaining the constant excitation power.  The absolute two-photon absorption cross section for 6MI was estimated in comparison with the published two-photon absorption cross-section of 7-amino-4-methylcoumarin (coumarin 120). Previously, the two-photon absorption cross-section for coumarin was estimated to be at in ethanol solution,20 while it becomes about 6 times smaller in the aqueous solution.12 The spectral properties of coumarin 120 dissolved in water are nearly identical to 6MI: its absorption maximum is at and its fluorescence maximum is near , and their fluorescence quantum yields are nearly the same. Thus, under the same excitation and emission detection conditions, the relative excitation cross-section for 6MI can be obtained directly from the average fluorescence intensities. We have measured two-photon induced fluorescence intensities of solutions of 6MI and coumarin in water. The fluorescence intensity of 6MI is 4 times smaller than that of coumarin (results not shown). Therefore, taking into account the fact that the fluorescence quantum yield is about the same for 6MI and coumarin in water, we estimate that 6MI has a two-photon absorption cross-section of about at and about at . The fluorescence decay kinetics of 6MI and 2AP were measured to probe for changes in the excited state lifetime due to the excitation with two- or three-photons, respectively (results not shown). For 6MI, the measured lifetime using two-photon excitation was , while for 2AP the determined lifetime was using three-photon excitation. In both cases, the lifetimes matched the lifetimes obtained from single-photon excitation measurements,14, 19 suggesting that after multiphoton excitation, these molecules fluoresce from their lowest excited singlet states. 3.1.Fluorescence Correlation MeasurementsMultiphoton excitation fluorescence correlation measurements were performed to evaluate the applicability of this technique for studying base analog fluorescence dynamics and to compare with published results obtained using one-photon excitation in UV. The autocorrelation curves showing the fluorescence intensity dynamics due to diffusion of 2AP and 6MI are shown in Fig. 3 . 6MI ( concentration) was excited with two-photons at , and 2AP ( concentration) was excited with three photons at . Curves were fitted using Eq. 2, residuals of the fits are shown in the top panels. All the parameters were allowed to vary freely during the fit of the autocorrelation curves, except the ratio in the case of 6MI, which is known from calibration measurements (described in methods). The results of the fits are presented in Table 1 . Using the determined diffusion time constant and excitation volume diameter , the diffusion coefficient for 6MI was also calculated using Eq. 3. Fig. 3Fluorescence autocorrelation curves for 6MI (a) and 2AP (b). Circles show the experimental data, the solid lines are fits of the data using Eq. 1. The results of the fits are summarized in Table 1. Top panels in each figure show the residuals. 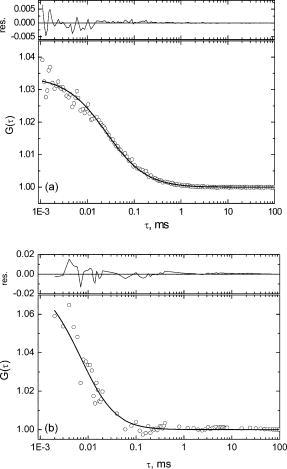 Table 1Fluorescence Autocorrelation Fitting Parameters for 6MI and 2AP.
To evaluate the feasibility of using 6MI as a fluorophore for studying DNA base dynamics, two-photon excitation FCS measurements were performed on a 20 base-long single-stranded DNA oligonucleotide containing 6MI at the end (see Fig. 4 ). The results obtained from the fitting of the DNA oligomer fluorescence autocorrelation trace are presented in Table 1. The increase in the diffusion time and decrease in the calculated diffusion coefficient support the fact that 6MI is attached to a 20-base DNA oligonucleotide. As mentioned above, incorporation of 6MI into single-or double-stranded DNA results in significant quenching of its fluorescence.19 Incorporation of 6MI at the end of DNA oligonucleotide results in about 60% quenching of 6MI fluorescence (results not shown). This obviously results in a lower signal-to-noise ratio for the FCS measurements of the oligonucleotide compared to 6MI in solution, but autocorrelation traces are still possible to obtain. Attempts to measure 6MI fluorescence correlation when 6MI was incorporated internally in single- or double-stranded DNA were not successful due to the small fluorescence quantum yield under these conditions (quenching approaches 95% in this case). However, FCS results might be obtained when 6MI is flipped out from the DNA helix due to base-pair mismatch, base bulging, or the action of an enzyme such as DNA polymerase. 4.DiscussionFluorescence properties of two fluorescent DNA base analogs, 2-aminopurine and 6-methylisoxanthopterin, were investigated using multiphoton excitation. One of the goals of this study was to investigate the feasibility of using three-photon excitation of 2AP as an alternative to UV excitation. We have shown that three-photon excitation of 2AP can be achieved using Ti-sapphire laser pulses of wavelengths. The shape of the measured three-photon excitation spectrum of the 2AP is quite different from the absorbance spectrum in the UV. The maximum of the measured three-photon excitation spectrum is blue-shifted relative to three times the wavelength of the one-photon absorbance spectrum, and the width of the spectrum is significantly narrower. The reason for this observation is unclear, as we cannot rule out the experimental artifact due to temporal dispersion of the laser pulses. Since three-photon excited fluorescence is inversely proportional to the square of the laser pulse duration,27 even a relatively small increase in GDD of the microscope objective at longer wavelengths might translate into a significant decrease in fluorescence intensity (since the measurement was done at constant average excitation power). It was not possible with available equipment to measure the fluorescence spectrum of 2AP using three-photon excitation; however the majority of the previous studies using multiphoton excitation have shown that the fluorescence spectra do not differ significantly from the single-photon excited fluorescence spectra.9, 10, 11 Taking into account that the measured fluorescence lifetime using three-photon excitation matches the lifetime measured using single-photon excitation, there is no reason to expect that three-photon excited fluorescence occurs from other than the lowest excited singlet state. Fluorescence correlation measurements were attempted to evaluate if three-photon excitation of 2AP can be used for performing FCS measurements to study DNA base dynamics or DNA–protein interactions. Previously, UV excitation was used to measure 2AP fluorescence correlation.7 It was concluded that UV excitation of 2AP results in a high triplet yield, limiting signal intensity. This required quite long measurement times ( and longer) to obtain reasonable autocorrelation traces.7 In the case of three-photon excitation of 2AP, the fluorescence signal was detectable at about concentration and fluorescence autocorrelation could be obtained under these conditions. The characteristic diffusion time of 2AP obtained from the three-photon excitation FCS measurement is very similar to the diffusion time determined from one-photon (UV) excitation FCS measurements.7 This indicates that the actual excitation volume in the case of three-photon excitation is similar in diameter to the excitation volume using UV excitation, i.e., smaller than the diameter of the light focused to a diffraction-limited spot, as would be expected for multiphoton excitation. It is interesting to note that the ratio of the excitation volume axial and radial dimensions is fitted to 0.9, indicating that in the case of three-photon excitation the -dimension of the excitation volume is much more confined compared to two-photon excitation conditions. This effect allows detection of fluorescence correlation even at a relatively high concentration of 2AP. However, to obtain acceptable signal-to-noise in the autocorrelation curve, very long measurements were needed in the present experimental configuration (the curve shown in Fig. 4b represents of data collection), limiting the applicability of this approach. Also, to achieve three-photon excitation, quite high excitation intensities were required with the present experimental system. More elaborate study using shorter femtosecond pulses with dispersion pre-compensation to avoid problems with temporal pulse dispersion is required to more completely evaluate feasibility of using three-photon excitation of 2AP to study DNA dynamics. However, the very few examples of three-photon excitation of molecules absorbing in the UV that exist in the literature suggest that the effective cross-sections of biologically relevant molecules are quite small (on the order of ), rendering three-photon microscopy not very applicable.28 It can be expected that more optimal 2AP fluorescence detection conditions can be achieved using two-photon excitation. Two-photon excitation of 2AP should be easily achieved using laser pulses at around ; however, this is outside the tuning range of Ti-sapphire lasers. 6MI fluorescence properties are more attractive for DNA dynamic studies when compared to 2AP. 6MI has a more red-shifted absorbance spectrum (maximum at in DNA) and fluorescence spectrum (maximum at ) compared to 2AP. At the same time, like 2AP, its fluorescence is largely quenched in single-or double-stranded DNA, permitting use of this molecule for DNA base flipping and other studies. 6MI can also form regular Watson–Crick base pairing with cytosine, not causing excessive structural perturbation to the DNA as evidenced by essentially the same DNA melting temperatures for 6MI substituted DNA molecules.19 In general, the properties of 6MI discussed above as well as the properties of other pteridine base analogs that have been investigated, such as 3MI or 6MAP, suggest that they could find broad applicability in biochemical or biophysical studies. As mentioned above, the base analog 6MAP has already been characterized in terms of two-photon excitation as an alternative for single-photon near-UV excitation. The two-photon excitation cross-section of 6MAP was determined to be about at ,13 which is comparable to the cross-sections of other endogenous fluorophores.10, 11 We have determined that the two-photon excitation cross-section of 6MI is about at , which is similar to the value for 6MAP.13 Because we used a standard Ti:sapphire laser for excitation, we were not able to scan wavelengths below . In general, the shape of the two-photon excitation spectrum of the 6MI matches that of the absorbance spectrum in the UV over the region measured (Fig. 2a). However, since we were unable to scan the whole band, it is not clear from these measurements if the spectra coincide on the blue side. The decrease of the excitation spectrum below relative to the absorbance spectrum could be due to an increase in the pulse duration of the Ti-sapphire laser, which would lead to lower peak pulse energy. However, in general, the spectral shape of 6MI two-photon excitation spectrum looks different from both 6MAP and 2AP, which show a much narrower spectral bandwidth for multiphoton excitation compared to their excitation spectra using 1-photon, UV excitation. Results of two-photon excitation FCS measurements suggest that 6MI is much more promising for FCS based dynamics studies. The characteristic diffusion time of 6MI and its diffusion coefficient are very similar to the parameters of 2AP or another pteridine analog, 3MI.7, 8 While the FCS measurements of 2AP using UV excitation were far from optimal because of low signal-to-noise and fast molecule photobleaching,7 a study of 3MI indicated that this nucleotide analog can be quite effectively used for FCS studies and perhaps even for single-molecule fluorescence detection. However, the main shortcoming of using UV excitation for 3MI FCS studies was the rapid photobleaching of these molecules. We have not performed a detailed study of FCS signal dependence on excitation power to determine the rates of photobleaching or triplet state formation using two-photon excitation, although our results show that we do not observe any significant photobleaching effect in the autocorrelation traces using excitation powers up to (about ) (data not shown). However, the maximum photon count rate, as calculated per molecule, is at least 10 times lower than the results obtained using 3MI excitation at . This low photon count rate does not permit detection of single 6MI molecules using two-photon excitation in contrast to the results obtained for coumarin- .12 Nevertheless, a low-photon count rate does not prohibit measurement of fluorescence autocorrelation traces when 6MI is used as a label on the DNA molecule, even though under these conditions 6MI’s fluorescence quantum yield is about 60% less than the quantum yield of free molecule in the solution. These results suggest that 6MI could be used for studying millisecond and microsecond dynamics of DNA bases by using two-photon excitation fluorescence correlation spectroscopy. ReferencesJ. M. Schurr,
B. S. Fujimoto,
P. Wu, and
L. Song,
“Fluorescence studies of nucleic acids: Dynamics, rigidities, and structures,”
Topics in Fluorescence Spectroscopy, Volume 3: Biochemical Applications, 137
–229 Plenum Press, New York
(1992). Google Scholar
B. W. Allan,
J. M. Beechem,
W. M. Lindstrom, and
N. O. Reich,
“Direct real time observation of base flipping by the EcoRi DNA methyltransferase,”
J. Biol. Chem., 273 2368
–2373
(1998). 0021-9258 Google Scholar
J. J. Hill and
C. A. Royer,
“Fluorescence approaches to study of protein-nucleic acid complexation,”
Methods Enzymol., 278 390
–416
(1997). 0076-6879 Google Scholar
T. Ha,
“Structural dynamics and processing of nucleic acids revealed by single-molecule spectroscopy,”
Biochemistry, 43 4055
–4063
(2004). 0006-2960 Google Scholar
E. Haustein and
P. Schwille,
“Ultrasensitive investigations of biological systems by fluorescence correlation spectroscopy,”
Methods, 29 153
–166
(2003). 1046-2023 Google Scholar
E. Haustein and
P. Schwille,
“Single-molecule spectroscopic methods,”
Curr. Opin. Struct. Biol., 14 531
–540
(2004). 0959-440X Google Scholar
S. Wennmalm,
H. Blom,
L. Wallerman, and
R. Rigler,
“UV-Fluorescence correlation spectroscopy of 2-aminopurine,”
Biol. Chem., 382 393
–397
(2001). 1431-6730 Google Scholar
J. E. Sanabia,
L. S. Goldner,
P. A. Lacaze, and
M. E. Hawkins,
“On the feasibility of single-molecule detection of the guanosine-analogue 3-MI,”
J. Phys. Chem. B, 108 15293
–15300
(2004). 1089-5647 Google Scholar
B. Kierdaszuk,
I. Gryczynski, and
J. R. Lakowicz,
“Two-photon induced fluorescence of proteins,”
Topics in Fluorescence Spectroscopy: Nonlinear and Two-Photon-Induced Fluorescence, 187
–210 Plenum Press, New York
(1997). Google Scholar
J. R. Lakowicz and
I. Gryczynski,
“Multiphoton excitation of biochemical fluorophores,”
Topics in Fluorescence Spectroscopy: Nonlinear and Two-Photon-Induced Fluorescence, 87
–144 Plenum Press, New York
(1997). Google Scholar
W. R. Zipfel,
R. M. Williams,
R. Christie,
A. Y. Nikitin,
B. T. Hyman, and
W. W. Webb,
“Live tissue intrinsic emission microscopy using multiphoton-excited native fluorescence and second harmonic generation,”
Proc. Natl. Acad. Sci. U.S.A., 100 7075
–7080
(2003). https://doi.org/10.1073/pnas.0832308100 0027-8424 Google Scholar
L. Brand,
C. Eggeling,
C. Zander,
K. H. Drexhage, and
C. A. M. Seidel,
“Single-molecule identification of coumarin-120 by time-resolved fluorescence detection: Comparison of one- and two-photon excitation in solution,”
J. Phys. Chem. A, 101 4313
–4321
(1997). https://doi.org/10.1021/jp963729w 1089-5639 Google Scholar
R. J. Stanley,
Z. J. Hou,
A. P. Yang, and
M. E. Hawkins,
“The two-photon excitation cross section of 6MAP, a fluorescent adenine analogue,”
J. Phys. Chem. B, 109 3690
–3695
(2005). 1089-5647 Google Scholar
E. L. Rachofsky,
R. Osman, and
J. B. A. Ross,
“Probing structure and dynamics of DNA with 2-aminopurine: effects of local environment on fluorescence,”
Biochemistry, 40 946
–956
(2001). 0006-2960 Google Scholar
T. M. Nordlund,
S. Andersson,
L. Nilsson,
R. Rigler,
A. Graslund, and
L. W. McLaughlin,
“Structure and dynamics of a fluorescent DNA oligomer containing the EcoRI recognition sequence: Fluorescence, molecular dynamics, and NMR studies,”
Biochemistry, 28 9095
–9103
(1989). 0006-2960 Google Scholar
T. M. Nordlund,
D. Xu, and
K. O. Evans,
“Excitation energy transfer in DNA: Duplex melting and transfer from normal bases to 2-aminopurine,”
Biochemistry, 32 12,090
–12,095
(1993). 0006-2960 Google Scholar
S. R. Kirk,
N. W. Luedtke, and
Y. Tor,
“2-Aminopurine as a real-time probe of enzymatic cleavage and inhibition of hammerhead ribozymes,”
Bioorg Med. Chem., 9 2295
–2301
(2001). 0968-0896 Google Scholar
S. S. Mandal,
E. Fidalgo da Silva, and
L. J. Reha-Krantz,
“Using 2-aminopurine fluorescence to detect base unstacking in the template strand during nucleotide incorporation by the bacteriophage T4 DNA polymerase,”
Biochemistry, 41 4399
–4406
(2002). 0006-2960 Google Scholar
M. E. Hawkins,
W. Pfleiderer,
F. M. Balis,
D. Porter, and
J. R. Knutson,
“Fluorescence properties of pteridine nucleoside analogs as monomers and incorporated into oligonucleotides,”
Anal. Biochem., 244 86
–95
(1997). 0003-2697 Google Scholar
A. Fischer,
C. Cremer, and
E. H. K. Stelzer,
“Fluorescence of coumarins and xanthenes after 2-photon absorption with a pulsed titanium-sapphire laser,”
Appl. Opt., 34 1989
–2003
(1995). 0003-6935 Google Scholar
M. Melguizo,
M. Gottlieb,
R. Charubala, and
W. Pfleiderer,
“Nucleosides LXII synthesis of 6-methyl-8-(2-deoxy--D-ribofuranosyl)-isoxanthopterin and derivatives,”
Nucleosides Nucleotides, 17 175
–186
(1998). 0732-8311 Google Scholar
J. B. Guild,
C. Xu, and
W. W. Webb,
“Measurement of group delay dispersion of high numerical aperture objective lenses using two-photon excited fluorescence,”
Appl. Opt., 36 397
–401
(1997). 0003-6935 Google Scholar
D. L. Wokosin,
“Pulse duration spectra and measurements for laser scanning microscope systems,”
Proc. SPIE, 5700 1
–13
(2005). 0277-786X Google Scholar
S. Huang,
A. A. Heikal, and
W. W. Webb,
“Two-photon fluorescence spectroscopy and microscopy of NAD(P)H and flavoprotein,”
Biophys. J., 82 2811
–2825
(2002). 0006-3495 Google Scholar
K. M. Berland,
P. T. So, and
E. Gratton,
“Two-photon fluorescence correlation spectroscopy: Method and application to the intracellular environment,”
Biophys. J., 68 694
–701
(1995). 0006-3495 Google Scholar
E. B. Brown,
E. S. Wu,
W. Zipfel, and
W. W. Webb,
“Measurement of molecular diffusion in solution by multiphoton fluorescence photobleaching recovery,”
Biophys. J., 77 2837
–2849
(1999). 0006-3495 Google Scholar
C. Xu,
W. Zipfel,
J. B. Shear,
R. M. Williams, and
W. W. Webb,
“Multiphoton fluorescence excitation: New spectral windows for biological nonlinear microscopy,”
Proc. Natl. Acad. Sci. U.S.A., 93 10763
–10768
(1996). https://doi.org/10.1073/pnas.93.20.10763 0027-8424 Google Scholar
S. Maiti,
J. B. Shear,
R. M. Williams,
W. R. Zipfel, and
W. W. Webb,
“Measuring serotonin distribution in live cells with three-photon excitation,”
Science, 275 530
–532
(1997). https://doi.org/10.1126/science.275.5299.530 0036-8075 Google Scholar
|


