
|
|
1.Introduction1.1.Breast CancerBreast cancer remains one of the leading causes of death among women, claiming a projected 40 410 lives in the United States in 2005.1 Early diagnosis remains a key emphasis in lowering this mortality rate. Accordingly, new optical screening tools are being developed to improve detection.2, 3, 4 Additional work is also necessary, however, to improve the accuracy of the approximately one million biopsies that are performed in the United States each year. Clinical biopsy localization techniques, such as stereotaxis and sonography, yield misdiagnosis in over 10% of nonpalpable lesions examined.5, 6, 7, 8 Improvements in the tools used for biopsy guidance will reduce this rate, thereby potentially reducing treatment costs and improving patient care. Additionally, open surgical procedures may be optimized by improving tumor margin identification, a process that often contains a great deal of ambiguity, especially in the case of some in situ carcinomas, which are not visible on gross examination.9 The adult female human breast consists of two main tissue types. Adipose tissue stores fat in adipocytes, large lipid-filled cells, and makes up the vast majority of the breast, while glandular structures allow for milk production and transport.10 The glandular tissue comprises a network of lobules and branching epithelial ducts, which connect the network that allows for milk delivery. In addition, systems of vascular, connective, and neural tissues reside among the glandular and fat structures. The connective tissues are often referred to as the breast stroma. Neoplastic growth typically originates in the glandular structures, most commonly in the ducts where it presents itself as a dense cluster of epithelial cells.11 After identification of a mass via palpation or mammography, typical treatment standards call for a core-needle or fine-needle biopsy and possible subsequent open surgical removal of any remaining diseased tissue.12 Pathological diagnosis of removed tissue is based on a variety of factors including the cell types present, their spatial arrangement, and the presence of nuclear pleomorphism, among many others.13 Staging of the disease state is also performed in order to assess the need for treatment of metastatic disease. The potential roles for optical imaging in this treatment regimen, beyond the rapidly developing field of optical mammography,2, 3, 4 are as a tool for the detection of lymph node metastasis,14 a guide for needle biopsy procedures,15 an aid for the identification of margins in open surgical procedures, and, ultimately, a diagnostic tool for the evaluation of disease states in vivo. 1.2.Optical Coherence TomographyOptical coherence tomography (OCT) is an interferometric optical imaging modality that provides both high spatial resolution and cross-sectional imaging capability. The sample being examined is exposed to low-coherence near-infrared (NIR) light and reflections are detected using a coherence-gating scheme that allows for depthwise spatial mapping.16 Coherent detection is typically achieved using a Michelson interferometer, which combines light returning from the sample with that from a scanning delay line. The interfered light is incident upon a photodetector, which converts the optical response into an electrical signal that can be stored and analyzed using a computer system. OCT systems, by employing broad bandwidth sources, have achieved axial resolutions below , making whole cell imaging feasible,17 and approaching that of conventional histology.18 In scattering tissues, penetration depths of up to , depending on tissue type, can be realized by exploiting the naturally occurring “biological window,” the spectral region between 700 and wherein scattering events dominate the attenuation process in tissue.19, 20 Because this depth is shallow relative to whole-organ or whole-body imaging modalities, catheter-, endoscope-, and needle-based OCT beam-delivery instruments are often employed for medical applications.17, 21, 22 Recently, OCT imaging of mammary tissue has been demonstrated.23 Images of carcinogen-induced rat tumor models showed that the OCT response from tumor and adipose tissues are clearly distinguishable, revealing the possibility of OCT-based techniques for the surgical identification of tumor margins and the guidance of biopsy procedures.23 In order for these techniques to meet with widespread clinical use, however, there must be low operator training requirements. As in other clinical imaging modalities,24, 25 computer-aided tissue identification techniques are expected to assist in this transition. While computer-aided OCT tissue identification based on speckle analysis has been investigated in the past,26 we present techniques specifically tailored to the unique structural features of breast tissue in OCT images. 1.3.Computational Tissue Identification TechniquesComputational techniques already enjoy widespread clinical use for screening, laboratory analysis, and image evaluation. Modern analysis of cervical Pap smears, for example, is performed by computerized microscope systems that locate abnormal cells and tag them for review by a cytotechnologist or cytopathologist. These systems may employ geometrical classification, density analysis, or neural network processing to identify suspicious areas in digitized microscope images.27, 28, 29, 30 Computational techniques are also heavily used in digital radiology for object size measurement, boundary determination, and the automated identification of features in a variety of imaging modalities.31, 32 For example, digital analysis techniques have been heavily studied as an automated means by which to identify masses and microcalcifications in digital mammography images, potentially improving advanced identification of suspicious lesions.33, 34, 35 2.Methods2.1.Tissue PropertiesPrior to the development of effective algorithms, it is necessary to have an understanding of the OCT image properties from each tissue type. In order to develop this knowledge, human tissue was acquired from three breast cancer patients under protocols approved by the institutional review boards of the University of Illinois at Urbana-Champaign and the Carle Foundation Hospital, Urbana, Illinois. The tumors were diagnosed as invasive ductal carcinomas via standard pathological evaluation techniques performed at Carle Foundation Hospital. After surgical excision, one tissue sample from each patient was placed in a buffered saline solution and stored in a refrigerator or cooler until imaging was performed, typically less than later. OCT data were acquired from the margin region, the interface between normal and diseased tissues, and from tumor, adipose, and stroma tissues individually, having been identified and separated in the laboratory based on visual and tactile inspection. The assessment of tissue properties within each image was performed in the laboratory. To facilitate registration between OCT images and histology, the scanned tissue region was marked with India ink, fixed in 10% formalin solution, embedded, sectioned, and stained with hematoxylin and eosin (H&E) for evaluation using a light microscope. The acquired OCT scan lines have a pixel size of and extend to approximately in depth. The preliminary data presented here are composed of 1666 scan lines of adipose tissue, 1408 scan lines of tumor tissue, and 941 scan lines of stroma tissue. The data were acquired using an OCT system employing a neodymium:vanadate pumped titanium:sapphire laser with a center wavelength of and a bandwidth of , yielding an approximate axial resolution of . Light was introduced into a single-mode fiber optic splitter (Gould Fiber Optics, Inc.), which coupled light from the source to sample and reference arms, and then back onto a silicon photodetector (New Focus, Inc., Model 2007). Approximately of sample arm light was focused into the tissue by a achromatic lens, yielding a spot size (transverse resolution). Spatial scanning over the sample was achieved using a galvanometer-mounted mirror (Cambridge Technology, Inc). The reference arm comprised a galvanometer-based delay operating at 30 lines per second. Sampling and data acquisition were performed with a dedicated computer card (National Instruments, Models PCI-6110, PCI-6711) having a sampling rate and a quantizer. The logarithm of the amplitudes of the acquired data were displayed and stored on a personal computer. The OCT response from adipose tissue was characterized by spatially periodic highly scattering boundaries due to the large size of the lipid-filled adipocytes ,36 while stroma tissue was more densely scattering and tumor tissue even more so. These properties are clearly evident in the representative adipose, stroma, and tumor axial scans shown in Fig. 1 . The averaged Fourier-domain responses from the adipose, tumor, and stroma tissues are shown in Fig. 2 . Attenuation effects have been removed from these data by subtracting a first-order linear fit from each response and every scan line has been normalized by the total integrated response over all spatial frequencies . Additionally, each scan line has been truncated so that only the region below the tissue surface remains, thereby removing effects arising from the varying free-space distance above the sample surface. Each tissue type displays a unique Fourier-domain signature that may be used to differentiate between scan lines of different tissue types. Fig. 1OCT axial scan data from human breast tissue (logarithmic response). (a) The periodic response due to adipose tissue. (b) The dense scattering response and associated attenuation effects from invasive ductal carcinoma tumor tissue. (c) The dense scattering response from stroma tissue with less prevalent attenuation effects and higher frequency oscillations than in tumor tissue. 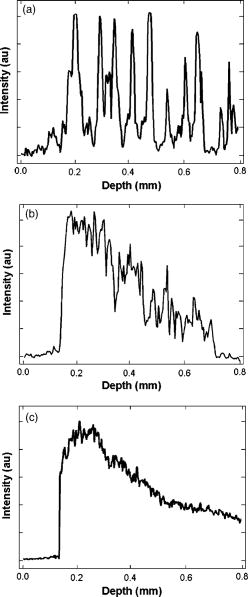 Fig. 2Fourier-domain data from OCT axial scans showing the unique signature from each tissue type. The averaged responses are shown over all tumor (black), stroma (dark gray), and adipose (light gray) tissue axial scans normalized by total area.  Based on the spatial data, it was also expected that the mean distance between high-intensity reflections in each scan would vary between tissue types. Therefore, we measured the mean distance between regions of intensity greater than half of the maximum in each scan line. Figure 3 shows the histogram of the distance measurements from all scan lines. These data show that adipose tissue exhibits a larger mean distance due to the large adipocyte cell boundaries while stroma and tumor tissues exhibit a smaller mean distance due to the smaller cell sizes and denser clustering of scattering objects. These data yield a simple means of classification via comparison of an unknown periodicity response with a set of known values. It is also clear from these data, however, that this property will not allow for highly effective differentiation between tumor and stroma tissues. 2.2.Computational TechniquesTwo techniques were evaluated for the identification of tumor tissue. The first takes advantage of the unique Fourier-domain signature from each scan line, and the second exploits the periodic scattering response from adipose tissue. Each scan line, or image column, was classified individually in order to facilitate the use of these techniques in conjunction with the various forward-imaging devices present in the literature, which may yield single forward-directed scan lines of data, create circular images by combining scan lines from a radially directed and angularly scanned beam, or use various beam translation schemes to form traditional OCT B-scan images.22, 37, 38 The techniques presented here may also be applied to layered tissue boundaries by evaluating each scan line over a windowed region, which may be shifted along the axial response. The Fourier-domain classification process was implemented by comparing the Fourier-domain data from each unknown scan line with the averaged adipose, tumor, and stroma responses from a set of training data. The tissue comparison with the lowest cumulative error yielded the final classification, where is a weighting function. The comparison was weighted by the maximum difference between any two known responses at each frequency, emphasizing the most relevant regions. The weighting function was calculated byfor each spatial frequency.The periodicity analysis technique was implemented by comparing the mean distance between high-intensity reflections in a scan line of unknown tissue with a set of known values. The known tissue having the maximum histogram intensity at this value yields the most probable classification. In this analysis, high-intensity regions of each scan line were constrained to those greater than half of the maximum scan line intensity and greater than in width, reducing noise effects. Figure 4 shows the processing steps for both techniques. Fig. 4Diagram of the processing steps implemented in the Fourier-domain and periodicity analysis techniques. 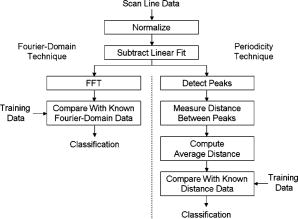 A combination of these two techniques was also implemented. The classification of each scan line was assigned a confidence rating for both evaluation techniques. The Fourier-domain and periodicity techniques generated confidence ratings ( and ) by calculating the difference between the cumulative error or histogram amplitude, respectively, of the classified tissue type and the next-best tissue type. Confidence ratings were normalized by the maximum rating generated from each technique. Upon evaluation, confidence ratings were used to determine the most likely tissue classifications among the scan lines for which a dispute existed.Studies of layered tissue, those having multiple tissue types in a single scan line, may also be accomplished using these techniques. This analysis relies on the use of a windowing scheme, wherein sections of the axial data are evaluated separately. For example, a window may be scanned along a depth scan of data in steps. After evaluation of the data in each window region via the Fourier-domain, periodicity, or combined technique, overlapping results in each region are compared, with the most common classification being selected. These results will be limited by the relationship between window size and feature size. For instance, if the window size is too small to capture the entire response from an adipocyte, the periodicity technique will not produce a measurement matching the expected response. However, too large a window size will result in a response that is not fine enough to accurately detect boundaries between tissue layers. Fourier-domain results are especially influenced by time-frequency tradeoffs, most notably in the low-frequency region that is critical to this classification technique.39, 40 To combat these limitations, future work may be undertaken to analyze the performance of more complex techniques employing variable window lengths. 3.Results and DiscussionAs a demonstration of these methods, all three techniques were used to evaluate two OCT images of tumor margins from human breast specimens. The preliminary data shown in Figs. 2 and 3, from three patients, were used as training data. The OCT image shown in Fig. 5 , taken from a fourth patient with invasive ductal carcinoma, shows a vertical margin between tumor and adipose tissue and is in size. The results of the algorithms are shown below the image in Fig. 5, with white, black, and gray lines indicating adipose, tumor, and stroma tissue classifications, respectively. Visual inspection of the gross tissue, OCT data, and histological assessment suggested that the left region (columns 1 to 485) was composed of dense tumor tissue and that a large portion of the right region (columns 615 to 833) was composed of adipose. The histological section shown in Fig. 5 was evaluated by a board certified pathologist who verified the sample composition. Note that the OCT image is highly correlated to the histological preparation, with many corresponding features. Fig. 5OCT image of a vertical tumor margin (logarithmic response) assessed along all vertical scans using all three detection techniques (left) and the corresponding H&E stained histology (right). The correspondence between the OCT image and histology is very strong. Highly correlated image features are indicated with arrows. The bottom three boxes show the results of (a) combined analysis, (b) Fourier-domain classification, and (c) periodicity analysis, for each scan line within the image. Black, white, and gray regions represent tumor, adipose, and stroma classifications, respectively. Scale bars are .  Based on this preliminary data, the estimated statistical performance of all three techniques was very good. When analyzing the OCT image in Fig. 5, the combined technique yielded the optimal overall performance, with approximate tumor tissue sensitivity and specificity measurements of 97 and 68%, respectively. The periodicity technique had an approximate sensitivity of 97% and an approximate specificity of 56%. The Fourier-domain technique had an approximate sensitivity of 99% and an approximate specificity of 58%. The estimated sensitivity of all three techniques approach or surpass that of conventional x-ray mammography and ultrasound, which have reported invasive ductal carcinoma detection sensitivities of approximately 81 and 94%, respectively.41 The techniques were also demonstrated using an image of a horizontal margin between adipose and tumor tissues (Fig. 6 ). The data were analyzed over a window of , which was shifted axially in increments of . Classification of each segment was determined by the dominant classification among windows overlapping that segment. Analysis was performed for three representative scan lines (arrows in Fig. 6) using all classification techniques. The combined technique yielded the optimal results, which are displayed to the right of the original figure. This demonstration shows that while the general regions of tumor and adipose may be properly classified, significant imprecision will exist when locating the precise border between tissue types due to window size constraints. Future improvements to this technique may include the incorporation of advanced windowing functions such as those often applied in spectroscopic OCT analysis.42 Fig. 6OCT image of a horizontal tumor margin (logarithmic response) assessed using the combined detection technique at three representative scan lines (arrows indicate columns 40, 115, and 190). The three boxes show the results of the combined analysis for each of the indicated scan lines. Black, white, and gray regions represent tumor, adipose, and stroma classifications, respectively. Scale bar is .  The example in Fig. 5 shows some classification ambiguity between scan lines. For this reason, these techniques are most likely to be useful for the identification of tissues using multiple adjacent scan lines, as opposed to single isolated scan lines. Improved preliminary results were obtained by compiling the classification from adjacent scan lines into a single result. In addition to providing a more consistent response across tissues, averaging provided an improvement in the estimated statistical performance, slightly improving the combined technique sensitivity in Fig. 5 from 97 to 99% when five total scan lines were considered. This result does not prevent the use of this technique for margin assessment, however, but instead simply constrains any boundary classification to the width of multiple scan lines. The techniques described here are not designed for optimal performance from a stochastic modeling perspective. More complex techniques such as the hidden Markov model, for example, which are used extensively in communications and speech processing, could potentially yield more effective statistical classification of tissue types.43 The distinct disadvantage of more rigorous methods, however, is that they are far more computationally complex than the techniques presented here. The fast Fourier transform operation, the central processing task required in the Fourier analysis technique, could be implemented very quickly using readily available dedicated hardware, in contrast to more complex stochastic modeling techniques that would require far more extensive computing resources and result in increased processing time. Since real-time results are key to the surgical evaluation of tissue, computationally complex stochastic analysis techniques are far less clinically practical and, therefore, have been excluded from this work in favor of simpler methods. As predicted by the preliminary data in Figs. 2 and 3, analysis of the example images showed that differentiation between tumor and adipose tissue was less challenging than between tumor and stroma. This is evident in Fig. 5, where most false negatives (nontumor classifications on the left side of the image) were classified as stromal tissue. The analysis of Fig. 5 also revealed that the algorithms seem to fail most often in regions where isolated adipocytes or other structures alter the response of the scan line. In addition to these false negatives, the algorithms tended to yield false positives (tumor classification in the right half of the image in Fig. 5) in regions where the adipocyte structure was poorly defined. This example, therefore, leads to the prospect that these techniques will yield an excellent method of identifying regions of suspicious tissue, while resulting in false classifications in a small number of predictable circumstances. These results are promising for the OCT-based detection of invasive ductal carcinoma, the representative breast pathology used in this investigation. Of course, full statistical evaluation must still be performed and the detection of other tumor types must be studied in order to predict the efficacy of these techniques when applied in a surgical setting. Further investigation into the OCT responses from benign and malignant growth, as well as the differences between in situ and invasive carcinomas will yield the necessary information to fully evaluate these techniques. 4.ConclusionThe methods presented here hold promise for the automated identification of breast tumor tissue in human patients. The techniques take advantage of the fact that highly attenuating, densely scattering tumor tissue resides among adipose tissue, which is characterized by large, lipid-filled cells that exhibit low attenuation effects. The preliminary statistical performance is encouragingly similar to that of current clinical techniques, with the benefit that OCT promises much finer spatial imaging resolution. While these image analysis techniques are well-suited for wide-field scanning of suspicious regions, they can potentially also be augmented on a finer scale by speckle pattern identification techniques26 to aid in diagnosis of the tissue once a tumor is found. The techniques presented here are optimized for the analysis of a single axial scan, yielding compatibility with simple low-coherence interferometric probing devices that require no transverse or radial scanning mechanism and may be implemented with a single optical fiber housed in a needle tip. As such, there exists a great potential for use of these methods in conjunction with needle-based probes21, 22 for the guidance of core-needle and fine-needle biopsy procedures. These methods may also be applied to images obtained in open surgical procedures, where high-resolution OCT scanning may be utilized to identify tumor boundaries in addition to classifying tissue types. While the algorithms presented here exploit only the structural information found in OCT images, they perform remarkably well. Future work may be undertaken to refine these techniques, assess different tumor types, and potentially couple the analysis with the measurement of other well-characterized breast optical properties44, 45, 46, 47 to further optimize tumor detection and diagnosis. AcknowledgmentsThe authors acknowledge the assistance of Eric J. Chaney, Freddy T. Nguyen, and the staff and physicians at Carle Foundation Hospital and Carle Clinic Association, including Drs. Patricia Johnson, Charles Wisseman, and Frank Bellafiore. This work was supported in part by grants from the UIUC-UIC Intercampus Research Initiative in Biotechnology (S.A.B.) and the National Institutes of Health (NIBIB, 1 R01 EB00108-1, S.A.B.). Funding was also provided by the National Science Foundation through the East Asia and Pacific Summer Institutes for U.S. Graduate Students (0413596). Additional information can be found at http://biophotonics.uiuc.edu ReferencesA. Jemal,
T. Murray,
E. Ward,
A. Samuels,
R. C. Tiwari,
A. Ghafoor,
E. J. Feuer, and
M. J. Thun,
“Cancer statistics, 2005,”
Ca-Cancer J. Clin., 55
(1), 10
–30
(2005). 0007-9235 Google Scholar
A. P. Gibson,
J. C. Hebden, and
S. R. Arridge,
“Recent advances in diffuse optical imaging,”
Phys. Med. Biol., 50
(4), R1
–R43
(2005). https://doi.org/10.1088/0031-9155/50/4/R01 0031-9155 Google Scholar
X. Gu,
Q. Zhang,
M. Bartlett,
L. Schutz,
L. L. Fajardo, and
H. Jiang,
“Differentiation of cysts from solid tumors in the breast with diffuse optical tomography,”
Acad. Radiol., 11
(1), 53
–60
(2004). 1076-6332 Google Scholar
A. Yodh and
B. Chance,
“Spectroscopy and imaging with diffusing light,”
Phys. Today, 48
(3), 34
–40
(1995). 0031-9228 Google Scholar
M. B. Acheson,
R. G. Patton,
R. L. Howisey,
R. F. Lane, and
A. Morgan,
“Histologic correlation of image-guided core biopsy with excisional biopsy of nonpalpable breast lesions,”
Arch. Surg. (Chicago), 132
(8), 815
–821
(1997). 0004-0010 Google Scholar
V. A. Bolivar,
O. E. Garcia, and
G. F. Ayensa,
“Stereotaxic core needle aspiration biopsy with multiple passes in nonpalpable breast lesions,”
Acta Radiol., 39
(4), 389
–394
(1998). 0284-1851 Google Scholar
L. Lieberman,
L. A. Ernberg,
A. Heerdt,
M. F. Zakowski,
E. A. Morris,
L. R. LaTrenta,
A. F. Abramson, and
D. D. Dershaw,
“Palpable breast masses: Is there a role for percutaneous image-guided core biopsy?,”
Am. J. Roentgenol., 175
(3), 779
–787
(2000). 0092-5381 Google Scholar
R. M. Pijnappel,
A. van Dalen,
I. H. M. B. Rinkes,
J. G. van den Tweel, and
W. P. T. M. Mali,
“The diagnostic accuracy of core biopsy in palpable and non-palpable breast lesions,”
Eur. J. Radiol., 24
(2), 120
–123
(1997). 0720-048X Google Scholar
S. Damaiani and
V. Eusebi,
“Gross and Microscopic Pathology,”
Cancer of the Breast, 5th ed.Saunders, New York
(2002). Google Scholar
H. Jensen,
“Anatomy and histology of the normal human breast,”
(1999) http://tgmouse.compmed.ucdavis.edu/cmpath/jensen/normal.html Google Scholar
K. Agarwal,
“Normal breast and benign breast lesions,”
Early Breast Cancer: From Screening to Multidisciplinary Management, Harwood Academic Publishers, Amsterdam
(1998). Google Scholar
J. A. Hall and
J. V. Knaus, An Atlas of Breast Disease, Parthenon Publishing, New York
(2003). Google Scholar
J. McKenzie and
J. Dalrymple,
“Fine needle aspiration cytology,”
Early Breast Cancer: From Screening to Multidisciplinary Management, Harwood Academic Publishers, Amsterdam
(1998). Google Scholar
W. Luo,
F. Nguyen,
A. M. Zysk,
T. S. Ralston,
J. Brockenbrough,
D. L. Marks,
A. O. Oldenburg, and
S. A. Boppart,
“Optical biopsy of lymph node morphology using optical coherence tomography,”
Technol. Cancer Res. Treat., 4
(5), 539
–548
(2005). 1533-0346 Google Scholar
N. V. Iftimia,
B. E. Bouma,
M. B. Pitman,
B. Goldberg,
J. Bressner, and
G. J. Tearney,
“A portable, low coherence interferometry based instrument for fine needle aspiration biopsy guidance,”
Rev. Sci. Instrum., 76 064301
(2005). https://doi.org/10.1063/1.1921509 0034-6748 Google Scholar
D. Huang,
“Optical coherence tomography,”
Science, 254
(5035), 1178
–1181
(1991). 0036-8075 Google Scholar
S. A. Boppart,
B. E. Bouma,
C. Pitris,
J. F. Southern,
M. E. Brezinski, and
J. G. Fujimoto,
“In vivo cellular optical coherence tomography imaging,”
Nat. Med., 4
(7), 861
–865
(1998). 1078-8956 Google Scholar
B. Povazay,
K. Bizheva,
A. Unterhuber,
B. Hermann,
H. Sattmann,
A. F. Fercher,
W. Drexler,
A. Apolonski,
W. J. Wadsworth,
J. C. Knight,
P. S. J. Russell,
M. Vetterlein, and
E. Scherzer,
“Submicrometer axial resolution optical coherence tomography,”
Opt. Lett., 27
(20), 1800
–1802
(2002). 0146-9592 Google Scholar
J. Boulnois,
“Photophysical processes in recent medical laser developments: A review,”
Lasers Med. Sci., 1
(1), 47
–66
(1986). 0268-8921 Google Scholar
A. E. Profio and
D. R. Doiron,
“Transport of light in tissue in photodynamic therapy,”
Photochem. Photobiol., 46
(5), 591
–599
(1987). 0031-8655 Google Scholar
S. A. Boppart,
B. E. Bouma,
C. Pitris,
G. J. Tearney,
J. G. Fujimoto, and
M. E. Brezinski,
“Forward-imaging instruments for optical coherence tomography,”
Opt. Lett., 22
(21), 1618
–1620
(1997). 0146-9592 Google Scholar
X. Li,
C. Chudoba,
T. Ko,
C. Pitris, and
J. G. Fujimoto,
“Imaging needle for optical coherence tomography,”
Opt. Lett., 25
(20), 1520
–1522
(2000). 0146-9592 Google Scholar
S. A. Boppart,
W. Luo,
D. L. Marks, and
K. W. Singletary,
“Optical coherence tomography: Feasibility for basic research and image-guided surgery of breast cancer,”
Breast Cancer Res. Treat., 84
(2), 85
–97
(2004). https://doi.org/10.1023/B:BREA.0000018401.13609.54 0167-6806 Google Scholar
P. Gibbs and
L. W. Turnbull,
“Textural analysis of contrast-enhanced MR images of the breast,”
Magn. Reson. Med., 50
(1), 92
–98
(2003). https://doi.org/10.1002/mrm.10496 0740-3194 Google Scholar
P. M. Shankar,
V. A. Dumane,
C. W. Piccoli,
J. M. Reid,
F. Forsberg, and
B. B. Goldberg,
“Computer-aided classification of breast masses in ultrasonic B-scans using a multiparameter approach,”
IEEE Trans. Ultrason. Ferroelectr. Freq. Control, 50
(8), 1002
–1009
(2003). 0885-3010 Google Scholar
K. W. Gossage,
T. S. Tkaczyk,
J. J. Rodriguez, and
J. K. Barton,
“Texture analysis of optical coherence tomography images: feasibility for tissue classification,”
J. Biomed. Opt., 8
(3), 570
–575
(2003). https://doi.org/10.1117/1.1577575 1083-3668 Google Scholar
G. T. Bartoo,
J. S. Lee,
P. H. Bartels,
N. B. Kiviat, and
A. C. Nelson,
“Automated prescreening of conventionally prepared cervical smears: a feasibility study,”
Lab. Invest., 66
(1), 116
–122
(1992). 0023-6837 Google Scholar
J. Rennie,
“Cancer Catcher: Neural net catches errors that slip through Pap tests,”
Sci. Am., 262
(5), 84
(1990). 0036-8733 Google Scholar
P. J. Sjöström,
B. R. Frydel, and
L. U. Wahlberg,
“Artificial neural network-aided image analysis system for cell counting,”
Cytometry, 36
(1), 18
–26
(1999). 0196-4763 Google Scholar
D. Tien,
P. Nickolls,
W. Liew,
A. Yeung,
Y. C. Liang, and
J. Tucker,
“Automated Cervical Smear Classification,”
IEEE Ninth Annual Conference of the Engineering in Medicine and Biology Society, 1457
–1458
(1987) Google Scholar
B. J. Erickson and
B. Nartholmai,
“Computer-aided detection and diagnosis at the start of the third millenium,”
J. Digit Imaging, 15
(2), 59
–68
(2002). 0897-1889 Google Scholar
J. S. Suri,
S. K. Setarehdan, and
S. Singh, Advanced Algorithmic Approaches to Medical Image Segmentation, Springer, London
(2002). Google Scholar
H. P. Chan,
K. Doi,
S. Galhotra,
C. J. Vyborny,
H. MacMahon, and
P. M. Jokich,
“Image feature analysis and computer-aided diagnosis in digital radiography. I. Automated detection of microcalcifications in mammography,”
Med. Phys., 14
(4), 538
–548
(1987). https://doi.org/10.1118/1.596065 0094-2405 Google Scholar
E. D. Pisano and
M. J. Yaffe,
“Digital mammography,”
Radiology, 234
(2), 353
–362
(2005). 0033-8419 Google Scholar
L. J. Warren Burhenne,
S. A. Wood,
C. J. D’Orsi,
S. A. Feig,
D. B. Kopans,
K. F. O’Shaughnessy,
E. A. Sickles,
L. Tabar,
C. J. Vyborny, and
R. A. Castellino,
“Potential contribution of computer-aided detection to the sensitivity of screening mammography,”
Radiology, 215
(2), 554
–562
(2000). 0033-8419 Google Scholar
B. Alberts,
D. Bray,
J. Lewis,
M. Raff,
K. Roberts, and
J. D. Watson, Mol. Biol. Cell,
(1994)
(1059-1524) Google Scholar
P. R. Herz,
Y. Chen,
A. D. Aguirre,
K. Schneider,
P. Hsiung,
J. G. Fujimoto,
K. Madden,
J. Schmitt,
J. Goodnow, and
C. Petersen,
“Micromotor endoscope catheter for in vivo, ultrahigh-resolution optical coherence tomography,”
Opt. Lett., 29
(19), 2261
–2263
(2004). https://doi.org/10.1364/OL.29.002261 0146-9592 Google Scholar
X. Liu,
M. J. Cobb,
Y. Chen,
M. B. Kimmey, and
X. Li,
“Rapid-scanning forward-imaging miniature endoscope for real-time optical coherence tomography,”
Opt. Lett., 29
(15), 1763
–1765
(2004). https://doi.org/10.1364/OL.29.001763 0146-9592 Google Scholar
R. Carmona,
W. Hwang, and
B. Torresani, Practical Time-Frequency Analysis: Gabor and Wavelet Transforms with an Implementation in S, Academic Press, San Diego
(1998). Google Scholar
L. Cohen,
“Time-frequency distributions—A review,”
Proc. IEEE, 77
(7), 941
–981
(1989). https://doi.org/10.1109/5.30749 0018-9219 Google Scholar
W. A. Berg,
L. Gutierrez,
M. S. NessAiver,
W. B. Carter,
M. Bhargavan,
R. S. Lewis, and
O. B. Ioffe,
“Diagnostic accuracy of mammography, clinical examination, US, and MR imaging in preoperative assessment of breast cancer,”
Radiology, 233
(3), 830
–849
(2004). 0033-8419 Google Scholar
C. Xu,
F. Kamalabadi, and
S. A. Boppart,
“Comparative performance analysis of time-frequency distributions for spectroscopic optical coherence tomography,”
Appl. Opt., 44
(10), 1813
–1822
(2005). https://doi.org/10.1364/AO.44.001813 0003-6935 Google Scholar
L. R. Rabiner,
“A tutorial on hidden Markov models and selected applications in speech recognition,”
Proc. IEEE, 77
(2), 257
–266
(1989). https://doi.org/10.1109/5.18626 0018-9219 Google Scholar
A. E. Cerussi,
A. J. Berger,
F. Bevilacqua,
N. Shah,
D. Jakubowski,
J. Butler,
R. F. Holcombe, and
B. J. Tromberg,
“Sources of absorption and scattering contrast for near-infrared optical mammography,”
Acad. Radiol., 8
(3), 211
–218
(2001). 1076-6332 Google Scholar
T. Durduran,
R. Choe,
J. P. Culver,
L. Zubkov,
M. J. Holboke,
J. Giammarco,
B. Chance, and
A. G. Yodh,
“Bulk optical properties of healthy female breast tissue,”
Phys. Med. Biol., 47
(16), 2847
–2861
(2002). https://doi.org/10.1088/0031-9155/47/16/302 0031-9155 Google Scholar
V. G. Peters,
D. R. Wyman,
M. S. Patterson, and
G. L. Frank,
“Optical properties of normal and diseased human breast tissues in the visible and near infrared,”
Phys. Med. Biol., 35
(9), 1317
–1334
(1990). https://doi.org/10.1088/0031-9155/35/9/010 0031-9155 Google Scholar
A. M. Zysk,
E. J. Chaney, and
S. A. Boppart,
“Refractive index of carcinogen-induced rat mammary tumours,”
Phys. Med. Biol., 51
(9), 2165
–2177
(2006). https://doi.org/10.1088/0031-9155/51/9/003 0031-9155 Google Scholar
|


