
|
|
1.IntroductionCancers develop from the premalignant to invasive stage in a multistep process of carcinogenesis. Because of frequent exposure to various forms of physical and chemical damage, about 90% of human cancers arise from the epithelium, the superficial layer covering the exterior of the body or lining the internal body cavities.1 In the development of epithelial precancer, epithelial cells undergo transformation that gives rise to increased metabolic activity, increased cell density and variability in nuclear shape and size, loss of cellular maturation, and overall thickening of the epithelial layer.2, 3 The presence of epithelial precancer is also accompanied by architectural changes in the underlying stroma and submucosa, including neovascularization and slow destruction of the collagen cross-link by protease.4, 5 Sensing of these biochemical and morphologic changes could provide valuable information for the diagnosis of cancers at an early stage. Autofluorescence spectroscopy has been widely explored for detecting epithelial precancers over the past two decades.6, 7, 8, 9, 10 The fluorescence diagnosis is based on the inherent difference in fluorescence spectral characteristics between normal tissue and precancerous lesions. Specifically, the technique can probe the changes in epithelial cellular metabolism by detecting the mitochondrial fluorophores NADH and FAD, and the changes in epithelial–stromal interactions by monitoring the collagen fluorescence from stroma. A large number of in vitro and in vivo investigations have demonstrated the diagnostic potential of fluorescence spectroscopy for detecting early lesions in a variety of organ sites in vivo, including the oral cavity, esophagus, bronchus, colon, and cervix.11, 12, 13, 14 A clear understanding of the origins of fluorescence spectral differences between normal and precancerous epithelial tissues could provide the insight valuable to improving the diagnostic performance of fluorescence spectroscopy.15, 16, 17, 18, 19, 20 It has been found that the increased tissue metabolic activity associated with the progression of epithelial precancer leads to an increase in NADH fluorescence and a decrease in the redox ratio defined as FAD fluorescence over the sum of FAD and NADH fluorescence.19, 20, 21, 22 The thickening of the epithelium and a slow destruction of the cross-link in collagen associated with the process of carcinogenesis result in the decrease in collagen fluorescence from the connective tissue under the epithelium.18, 19, 23, 24 These changes alter the intrinsic fluorescence properties of tissue and can be used to differentiate epithelial precancer from normal tissue. However, the interpretation of bulk autofluorescence signals measured by a conventional fluorescence system is usually complicated because tissue has a multilayered structure, and the bulk autofluorescence signals reflect the volume-averaged contribution of the fluorophores from different tissue layers. Moreover, the autofluorescence signal would be modulated by the absorption and scattering in the sampled tissue volume, which creates more challenges to extract accurate diagnostic information from the measured signal. Therefore, a depth-resolved technique that can isolate the fluorescence from different sublayers of tissue is desirable for the development of more accurate understanding of the epithelial fluorescence signals. Recently, we reported the preliminary investigations of depth-resolved autofluorescence of epithelial tissues using a confocal spectroscopy system.25, 26 The experimental results demonstrated that the depth-resolved signals provided detailed information on the layered structure and biochemistry of the examined epithelial tissues. In particular, it was revealed that keratin in the topmost layer of the squamous epithelium produces strong, collagen-like fluorescence that creates serious challenges in interpreting bulk autofluorescence spectra measured with conventional fluorescence spectroscopy methods. NADH and FAD are the dominant fluorophores in the nonkeratinized epithelial layer. We found that the NADH and FAD fluorescence, directly related to the cellular metabolism, were significantly correlated to the tissue pathology.26 This paper presents the results of the most recent systematic study of the autofluorescence of epithelial tissues. We investigated the depth-dependent autofluorescence characteristics of epithelial tissue with multiple excitations in the wavelength range from . The depth-resolved measurements were conducted on a variety of squamous and columnar epithelial tissues, such as fresh oral, esophageal, and colonic tissues from experimental rabbits, and fresh human ecto- and endocervical tissues. The autofluorescence of cervical cancer cells (SiHa) with the cellular metabolism regulated by the biochemical method was measured to investigate the sensitivity of autofluorescence excited at different wavelengths to the cellular metabolism. 2.Methods and Materials2.1.Experimental SetupThe schematic of a confocal fluorescence spectroscopy setup is shown in Fig. 1 . The excitation sources are three solid-state lasers of wavelengths at , , and and the second harmonic of a tunable Ti:Sapphire laser covering the wavelength range from . Four laser beams were collimated and combined by a series of dichroic mirrors. A beamsplitter (03BTQ017, Melles Griot) were used to direct the combined beams to an infinity-corrected water immersion objective lens (40 X, 1.15 NA, Olympus) via a galvanometer-driven scanner. The scanners scanned the excitation light to create a sampling area in the focal plane at a speed of . The illumination power on tissue samples were set to for UV excitations and for violet/blue excitations. An actuator (Model 850B, Newport) was used to drive the objective and create axial scanning with position resolution. The fluorescence emissions from the sample were collected by the same objective. The emission and excitation paths were separated by the beamsplitter. A series of long-pass filters were used to attenuate the reflected excitation light from the sample to a level comparable to the intensity of the fluorescence signal. The residual excitation and fluorescence signals were then coupled into a multimode optical fiber by a tube lens with focal length. The fiber acted as a confocal pinhole and conducted the collected signals to an imaging spectrometer (Model 77480, Oriel Instruments) for spectral analysis. The confocal spectral signals were recorded with a cooled-CCD system (NTE/CCD-1340/400-EMB, ST-133, Roper Scientific). The axial, lateral, and wavelength resolutions of the confocal spectroscopy system were about , , and , respectively. The tissue surface was identified using the confocal signals of the residual excitations reflected from the interface between the cover glass and tissue sample. Because the distributions of fluorophores in tissue are not uniform and the autofluorescence signal is inherently weak, in the system we integrated the fluorescence spectral signal over the sampling layer at a certain depth in order to average out nonuniformities and to increase the signal-to-noise ratio (SNR). By sacrificing the imaging capability of the confocal system, high-quality spectral signals were recorded and the inhomogeneity of fluorophore distributions in the sampled tissue layer was averaged out.25 This also reduced the pixel dwell time of excitation and prevented photobleaching. When exposure time of the CCD was set to , the SNR of the confocal spectral signal measured at the depth of in tissue sample was over . 2.2.Sample PreparationThe depth-resolved fluorescence measurements were conducted on a variety of epithelial tissues. Fresh oral, esophageal, and colonic tissue samples were dissected from experimental rabbits. Fresh human ecto- and endocervical specimens were obtained by hysterectomies performed at the Prince of Wales Hospital of the Chinese University of Hong Kong. All the samples were washed briefly with PBS solutions to remove the residual blood on the surfaces before the measurements. The depth-resolved fluorescence measurements were completed within after the tissue removal. Tissue samples were then fixed in formalin for histological analyses. Standard H&E and Masson’s protocols were used to stain the sections for examining the tissue structure and determining the distribution of collagen in tissue.27 To demonstrate that the epithelial fluorescence signals are sensitive to cellular metabolism, the autofluorescence of cervical cancer cells (SiHa, ATCC) was investigated. The monolayer cell cultures were grown on microscope coverslips in an EMEM medium supplemented with 10% fetal bovine serum (ATCC) at and 5% . The cellular metabolism was altered using mitochondria inhibitor and uncoupler, respectively. To increase intracellular NADH fluorescence, of mitochondria inhibitor sodium cyanide (NaCN, No. 11835, RDH) were added to the cells.28 To reduce NADH fluorescence and increase FAD fluorescence, the cells were treated with of mitochondria uncoupler carbonyl cyanide 3-chloro phenylhydrazone (CCCP, C2759, Sigma-Aldrich).28 After of exposure to the drugs, the cell cultures were washed twice with PBS solutions to eliminate the autofluorescence of the chemicals and medium. To understand the fluorescence characteristics of epithelial tissues, we investigated the fluorescence of major biologically relevant fluorophores NADH, FAD, keratin, and collagen Type I (N8129, F6625, K0253, C7661, Sigma-Aldrich). It is known that NADH and FAD are the co-enzymes carrying information about cellular metabolism and that collagen is the major fluorophore in connective tissue.8, 30, 31 Before the fluorescence measurements, the NADH were prepared in sodium hydroxide buffer at , the FAD were dissolved in water solution at , and collagen and keratin samples in powdered form were used. The keratin powder was made by evaporating the solvent from the keratin solution. 3.Results and DiscussionsRabbit oral and esophageal tissue samples and human ectocervical tissue samples were used in the study of the autofluorescence spectral characteristics of squamous epithelial tissues. Generally, these squamous tissues are composed of a stratified epithelium and underlying connective tissue designated as the stromal layer. Keratinization was found to be common in squamous epithelial tissue.25, 26, 29 Thus, the discussions are focused on the depth-resolved fluorescence spectroscopy of nonkeratinized and keratinized squamous epithelial tissues, respectively. The representative depth-resolved autofluorescence spectra measured from a nonkeratinized squamous epithelium are shown in Fig. 2a, 2b, 2c, 2d, 2e, 2f . The sample was a nonkeratinized rabbit oral tissue with its Masson-stained histology, shown in Fig. 2h. The fluorescence spectra in the figure are the averaged spectra of the normalized spectra measured at various depths within different tissue layers. The relative standard deviations of the normalized fluorescence spectra within each layer are less than 10%, indicating that the averaged spectra shown in figure are the representative fluorescence signals in the epithelial and stromal layers. The depth of refers to the tissue surface, where the confocal excitation light intensity reaches a maximum. With the excitation set at , the spectra recorded from the topmost tissue layer of thickness about are peaked at and the peaks shift to , with a further increase in sampling depth. The spectral signal excited at clearly indicates that the specimen has a two-layered structure. This is consistent with the corresponding Masson-stained histology, which reveals a -thick nonkeratinized epithelial layer and the underlying collagen-rich stromal layer. We found that the contrast in spectral characteristics between the epithelial and stromal layers decreased with the increase of excitation wavelengths. The overlapping of spectra from two different tissue layers becomes severe when the excitation wavelength is over . Fig. 2Typical results of a nonkeratinized oral tissue: (a–f) Depth-resolved fluorescence spectra excited at , , , , , and , respectively. Solid lines: averaged spectra of the normalized epithelial fluorescence spectra measured at depths of ; dashed lines: averaged spectra of the normalized stromal fluorescence spectra measured at depths of . (g) The fluorescence intensities as a function of depth. (h) The corresponding Masson-stained histology with collagen fibers colored in blue. E: nonkeratinized epithelial layer; S: stromal layer (color online only). 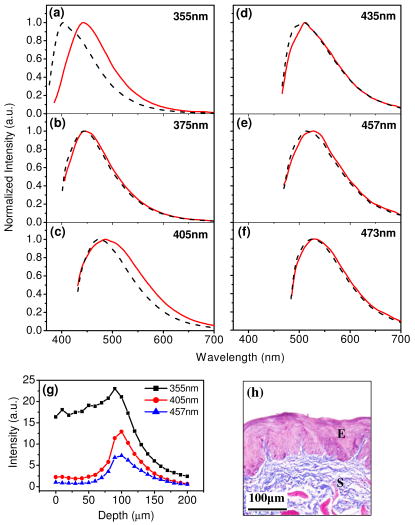 The depth dependences of the fluorescence excited at different wavelengths are shown in Fig. 2g. Here, the fluorescence intensity was normalized to the excitation power and should reflect the relative excitation efficiency. As the figure shows, the stromal fluorescence close to the basement membrane is generally stronger than the epithelial fluorescence, though the scattering of the epithelial layer attenuates the excitation. It becomes dominant when the excitation wavelength is over . The results show that the sudden change of fluorescence intensity across the basement membrane can also produce the contrast between the epithelium and stroma. We noticed that the fluorescence intensity signal almost did not change in the epithelial layer. This may be explained by the fact that the attenuation of the confocal signal is compensated by the gradual increase of epithelial cell density from the surface to the basement membrane.29 Though the Masson-stained histology did not show a significant variation in collagen density and dense distribution of capillary vessels in the stroma, the intensity of stromal fluorescence decreased quickly, suggesting strong scattering of light in the stroma. Overall, our findings show that when a squamous epithelium is not keratinized, both the depth-resolved fluorescence spectra and the intensity can be used to differentiate the epithelial layer from the underlying stroma and determine the epithelium thickness. To understand the depth-resolved fluorescence measured from different tissue layers, we compared the epithelial and stromal signals with those measured from the SiHa cell culture, and pure NADH, FAD, and collagen samples. The depth-resolved fluorescence of a nonkeratinized oral tissue and the fluorescence of the cell culture and the pure chemicals are shown in Figs. 3 and 4 . The displayed fluorescence spectra were excited at the representative wavelengths of 355, 375, 405, 435, 457, and . We found that the fluorescence spectra of free NADH and FAD are stable and not a function of excitation wavelength, while their excitation efficiencies vary at different excitation wavelength. Specifically, the excitation efficiency of free NADH fluorescence decreases by a factor of 10 with the increase of the excitation wavelength from , the edge of its absorption spectrum.31 However, the fluctuation of excitation efficiency of FAD was within 50% in the entire excitation wavelength range in this study. Fig. 3Normalized fluorescence spectra: (a) nonkeratinized epithelial layer; (b) SiHa cells. The number at the beginning of each spectrum is the magnification, which should be inversely proportional to the relative excitation efficiency.  Fig. 4Normalized fluorescence spectra: (a) stromal layer; (b) pure collagen. The number above each spectrum is the magnification. 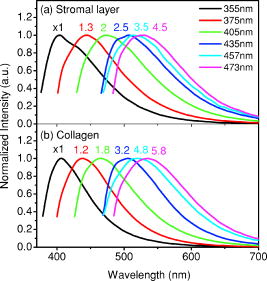 As shown in Fig. 3, the dependence of epithelial fluorescence on the excitation wavelength is similar to that of the cell culture. Although the epithelial fluorescence and SiHa cell fluorescence are the combination of NADH and FAD signals, the comparison of the fluorescence signals excited at short wavelengths shows that the NADH signal is dominant in epithelium and cell fluorescence. The FAD fluorescence became dominant in the epithelium and cell fluorescence when the excitation wavelength was over . The red-shift of the epithelial fluorescence with the increase of the excitation wavelength is due to the significant decrease of excitation efficiency of NADH fluorescence because the excitation efficiency of FAD fluorescence is relatively stable. We noted that the peaks of epithelium and cell fluorescence excited at short wavelengths have about blue-shift with respect to that of NADH in free form, and an obvious red-shift of epithelium and cell fluorescence excited at long wavelengths was found with respect to the free FAD fluorescence. These data indicate that the spectral characteristics of NADH/FAD fluorescence are sensitive to the interaction of NADH/FAD with the cytoplasm contents, such as protein-binding. For instance, NADH bound with enzyme such as malate dehydrogenase in the mitochondrial matrix could be the major contributor to the spectral shift. FAD bound with protein such as electron-transferring flavorprotein in the mitochondrial respiratory chain could cause the spectral shift of FAD fluorescence in cells and tissues.32, 33, 34, 35 The stromal fluorescence excited at representative wavelengths are shown in Fig. 4a. The emission peak red-shifts continuously, and the excitation efficiency drops gradually with the increase in the excitation wavelength. The spectral characteristics of collagen fluorescence shown in Fig. 4b are almost identical to those of the stromal signal, confirming that collagen is the major source of fluorescence in the stromal layer. However, a closer comparison of the collagen and stromal fluorescence excited at shows that a shoulder around appears in the stromal fluorescence. Because collagen cross-links determine the spectral characteristics of collagen fluorescence,20 the shoulder may be attributed to the differences in collagen cross-links or degree of cross-linking in collagen between the collagen powder sample and stromal tissue. In addition, the shoulder may also be contributed to from the residual of epithelial fluorescence peaked at because the nonconfocal signals from the epithelial layer cannot be completely rejected by the confocal technique. Finally, the histology did not show blood vessels in the examined tissue samples in the sampling depth range from . The strong blood absorption around should not be the cause of the shoulder in the stromal fluorescence. The depth-resolved fluorescence spectroscopy provided comprehensive biomorphologic and biochemical information of non-keratinized epithelial tissue. The fluorescence signals of keratinized epithelial tissue were investigated in the same way. Typical depth-resolved fluorescence measured from a highly keratinized oral tissue and the corresponding Masson-stained section are shown in Fig. 5 . The histology showed that the tissue sample was covered with a keratinized epithelial layer of about thickness. The underlying layers are normal epithelium and stroma. Similar to the fluorescence of nonkeratinized squamous epithelium, only the spectral signals excited at provide sufficient contrast to identify the keratinized epithelium, the nonkeratinized epithelium, and the stroma. The separation of the three layers becomes unclear with the increase of the excitation wavelengths. However, the depthdependence of the fluorescence signal shown in Fig. 5c is significantly different from that measured in the nonkeratinized epithelium. The intensity of the confocal fluorescence signal drops monotonically as a function of sampling depth. Fig. 5Typical result of a highly keratinized oral tissue: (a–b) Depth-resolved fluorescence spectra excited at and , respectively. Dashed lines: keratinized epithelial fluorescence spectra at depths of ; Solid lines: nonkeratinized epithelial fluorescence spectra at depths of ; Dotted lines: stromal fluorescence spectra at depths of . (c) The fluorescence intensities as a function of depth. (d) The corresponding Masson-stained histology. K: keratinized layer; E: epithelial layer; S: stromal layer.  To investigate the effect of the topmost keratinized layer on the excitation of fluorescence from the underlying tissue, the depth-resolved fluorescence was measured from seven oral tissue samples with nonkeratinized epithelium and eight oral tissue samples with keratinized epithelium. The results shown in Fig. 6 are the averaged intensities of fluorescence excited at two representative wavelengths as a function of depth. In the nonkeratinized oral tissue, the intensity signals recorded in the epithelium gradually increase with increasing depths, while the stromal fluorescence intensity signals decrease quickly with depth. Our measurements showed that the stromal fluorescence could be detected at depth. Unlike the nonkeratinized oral tissue, the intensities recorded from the keratinized oral tissue show a quick decay when the sampling depth is increased, suggesting that the keratinized layer is highly scattering.36 The scattering in the topmost layer causes quick spreading of the focal point in the tissue and reduces the effective excitation and collection of fluorescence from the underlying layers. Our findings are consistent with the report that normal oral tissue samples with keratinized epithelium emit somewhat lower bulk fluorescence than the oral tissue samples with nonkeratinized epithelium.37 Fig. 6Average fluorescence intensities as a function of depths of nonkeratinized and highly keratinized oral tissue: (a) excitation; (b) excitation. 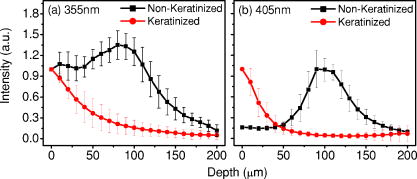 The normal epithelial layer sandwiched between the topmost keratinized layer and underlying stroma shows identical fluorescence characteristics as those of the nonkeratinized epithelium. The fluorescence of the keratinized layer excited at representative wavelengths are shown in Fig. 7 together with the fluorescence of pure keratin. The similarity of the fluorescence characteristics between the fluorescence of the keratinized epithelial layer and pure keratin indicates that keratin is the major fluorophore in the keratinized epithelial layer.25 More importantly, the comparison of the results in Figs. 4 and 7 shows that the characteristics of keratin fluorescence are similar to those of collagen. The results provide more evidence that the keratin in the topmost keratinized layer of the squamous epithelium produces strong, collagen-like fluorescence and creates serious challenges in interpreting bulk autofluorescence spectra measured with conventional fluorescence spectroscopy methods.25 Fig. 7Normalized fluorescence spectra: (a) keratinized epithelial layer; (b) pure keratin. The number above each spectrum is the magnification.  In previous work we reported that the rabbit esophageal tissue and human ectocervical tissue, covered with squamous epithelium, are generally keratinized.26 The thickness of the topmost keratinizing layer varied from . In this study, we investigated the depth-resolved fluorescence spectra of the rabbit esophageal tissue and human ectocervical tissues excited at a broad wavelength range. The results are similar to those measured from fresh oral tissue samples. It should be noted that the keratinization of esophageal and cervical epithelia is not as severe as that of oral tissue. Most examined samples in this study were parakeratinized. Typical fluorescence spectra measured from parakeratinized esophageal and cervical epithelia are shown in Fig. 8 . The spectra of keratinized and nonkeratinized oral epithelia are displayed for comparison. As can be seen from Fig. 8a, with excitation, the fluorescence peaks vary in the range from , indicating that the signals are the mixture of keratin and NADH signals and reflect the degree of keratinization of the epithelium. The fluorescence excited at becomes complicated because of the overlapping of NADH, FAD, and keratin fluorescence. The strong peak at in the esophageal fluorescence may be attributed to porphyrin derivatives.31 Fig. 8Normalized fluorescence spectra of the topmost para-keratinized layer of rabbit esophageal and human ectocervical tissue: (a) excitation; (b) excitation.  To explore whether the epithelium is generally keratinized, depth-resolved fluorescence measurements were conducted on columnar epithelial tissue including the rabbit colonic tissue and human endocervical tissue. Typical fluorescence spectra of colon and endocervix tissue with UV at , violet at , and blue at excitation are shown in Fig. 9 . We found that the fluorescence spectra recorded from colon and endocervical tissues at different depths are almost identical. As can be seen, with excitation the fluorescence peaked at , showing the dominance of the NADH signal. The fluorescence excited at peaks at and is related to FAD. The fluorescence excited at exhibits a broadband line shape with the peak spanning from , showing the combination of NADH and FAD signals. The fluorescence signals did not show the presence of keratin and collagen in the examined tissue samples. Unlike squamous epithelium, the confocal fluorescence signals measured from tissue covered with columnar epithelium decreased monotonically with an increase in the sampling depth. Fig. 9Typical results of columnar tissue: (a–c) Depth-resolved fluorescence spectra of rabbit colonic tissue. (d) The corresponding Masson-stained histology. (e–g) Depth-resolved fluorescence spectra of human endocervical tissue. (h) The corresponding Masson-stained histology.  The Masson-stained histology of the examined colon tissue in Fig. 9d shows that the mucosa is lined by simple columnar epithelium containing many glandular cells. The columnar epithelial cells and glandular cells are connected with a small amount of collagen that may have a negligible contribution to the measured fluorescence signals. The thickness of colonic mucosa is generally over , the maximal sampling depth of our confocal system. The Masson-stained histology in Fig. 9h shows that the endocervical tissue is covered with a single layer of mucin-secreting cells and contains subcolumnar reserve cells. The histology shows the presence of a small amount of collagen. Similar to colonic mucosa, the contribution of collagen to the total fluorescence may be negligible. Overall, the histological analyses provide evidence that the fluorescence spectral line shapes of colon and endocervical tissues are not dependent on sampling depths and are mainly determined by NADH or FAD fluorescence. It is known that NADH and FAD fluorescence signals can be used to estimate the redox ratio for the evaluation of tissue metabolism.22 Our previous work demonstrated that the confocal system with the and excitations could provide the depth-resolved assessment of the redox ratio in the epithelium because the fluorescence excited at is dominated by the NADH signal, while the signal excited at is dominated by FAD fluorescence.26 However, measuring with two excitations is complicated because it requires frequent alignment and calibration. A desirable system should use a single excitation source that produces the epithelial signal with NADH and FAD fluorescence at comparable levels for a good estimation of the redox ratio. The fluorescence spectral characteristics of the non keratinized epithelial layer and SiHa cell culture were studied to search for the optimal wavelength that excites balanced NADH and FAD signals in epithelium. It was found that the fluorescence excited in the wavelength range from could be well fitted by the fluorescence excited at and that are dominated by NADH and FAD signals, respectively. In particular, the fitting results in Fig. 10 show that with excitation, the NADH and FAD fluorescence almost reach a balanced level. The contributions of NADH and FAD fluorescence to the total fluorescence of epithelial tissue are different from those to the SiHa cells, suggesting the difference in metabolic rate between the normal epithelial cells and the cancer cells. It should be noted that the small bumper at in the fluorescence excited at is attributed to the strong Raman peak of water, with a Raman shift of . Fig. 10Fluorescence excited at fitted with the fluorescence spectra excited at and : (a) nonkeratinized epithelial layer; (b) SiHa cells.  To verify that the autofluorescence excited at is sensitive to the cellular metabolism, the fluorescence of SiHa cell cultures before and after treated with NaCN and CCCP was investigated. Here, NaCN is the mitochondria inhibitor driving the NADH fluorescence signals to a high level by blocking the transfer of electrons from the electrons donors, and CCCP is the mitochondria uncoupler that can increase the FAD-relative fluorescence signal.28 The representative fluorescence spectra are shown in Fig. 11 . We found that the maximal variation in fluorescence spectral line shape before and after the treatment with the mitochondria inhibitor and uncoupler occur at the excitation, indicating the fluorescence excited at were most sensitive to the cellular metabolism. Next, we fitted the fluorescence excited at before and after the treatment with the mitochondria inhibitor and uncoupler. The fitting results shown in Fig. 12 clearly reveal the effects of the mitochondria inhibitor and uncoupler on the relative contribution of NADH and FAD signals to the fluorescence of the examined cell cultures. Fig. 11Variations of autofluorescence spectra of SiHa cells when treated with NaCN and CCCP with the excitation at (a) ; (b) ; (c) ; (d) ; (e) and (f) . 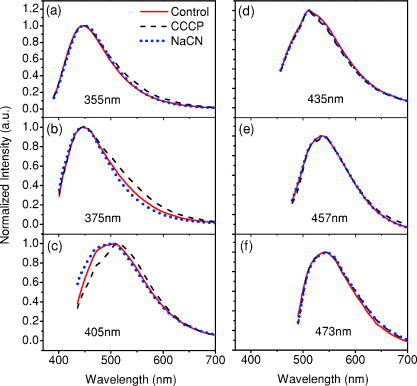 Fig. 12The fluorescence spectra excited at of SiHa cells when treated with NaCN and CCCP fitted with the fluorescence spectra excited at and : (a) Solid lines: excited fluorescence; Dashed lines: fitting curve. (b) The variation of the relative contribution of NADH and FAD fluorescence. Solid lines: excited fluorescence; dashed lines: excited fluorescence. 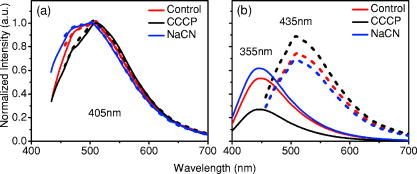 Table 1 summarizes the ratio of NADH over FAD fluorescence signals measured from six SiHa cell cultures. The ratio calculated from the NADH and FAD signals decomposed from the fluorescence excited at increased about 25% when cells were treated with NaCN and decreased about 55% when treated with CCCP. The results are similar to those calculated using the ratio of the NADH signals excited by the laser over the FAD signals induced by the laser. This provides the quantitative evidence that the autofluorescence spectrum excited at can be used for accurate estimation of the redox ratio. Table 1The ratios between NADH and FAD fluorescence.
4.ConclusionWe built a depth-resolved spectroscopy system with multiple excitation wavelengths to investigate the autofluorescence characteristics of squamous and columnar epithelial tissues. The spectral information can be used for accurate assessment of biomorphology and biochemistry of epithelial tissues. It was found that keratinization is common in the topmost layer of squamous epithelium. Strong keratin fluorescence from the keratinized epithelial layer exhibits similar excitation and emission characteristics to those of collagen. It creates severe interference in the assessment of NADH/FAD fluorescence in epithelium and collagen fluorescence in stroma. Furthermore, the keratinized epithelium, a highly scattering tissue layer, may significantly reduce the efficiency of excitation and collection of fluorescence from underlying layers. The study demonstrated that the depth-resolved measurements are crucial to isolate the fluorescence signals from different sublayers of epithelial tissues and provide more accurate information about endogenous fluorescence for the tissue diagnosis. We found that the fluorescence signal excited at produces sufficient contrast to resolve the layered structure of the epithelial tissue. The fluorescence excited at provides the information for a good estimation of the epithelial redox ratio, which is directly related to tissue metabolism, while the signals do not produce the information on tissue structure. Note that NADH/FAD and collagen fluorescence exhibit different time-decay processes.38 It is possible to resolve the fine structure of the tissue using the time-resolved fluorescence measurement to identify the signal of the dominant fluorophore in each sublayer, such as keratin in the keratinized epithelium, NADH in the normal epithelium, and collagen in the stroma. In future work, we will investigate the potential of a combined depth- and time-resolved spectroscopy technique with excitation in sensing both the fine structure and metabolic status of tissue. Finally, the results encourage our future work to focus on developing a compact confocal system with a miniaturized objective to investigate in vivo applications of the depth-resolved fluorescence method for noninvasive diagnosis of tissue pathology. AcknowledgmentsThe authors acknowledge support from the Hong Kong Research Grants Council through Grants HKUST6025/02M and HKUST6408/05M. ReferencesB. Alberts,
A. Johnson,
J. Lewis,
M. Raff,
K. Roberts, and
P. Walter, Molecular Biology of the Cell, Garland Science, New York
(2002). Google Scholar
C. Boone,
J. W. Bacus,
J. V. Bacus,
V. Steele, and
G. Kelloff,
“Properties of intraepithelial neoplasia relevant to cancer chemoprevention and the development of surrogate endpoints for clinical trials,”
Proc. Soc. Exp. Biol. Med., 216 151
–165
(1997). 0037-9727 Google Scholar
G. I. Evan and
K. H. Vousden,
“Proliferation, cell cycle and apoptosis in cancer,”
Nature (London), 411 342
–348
(2001). https://doi.org/10.1038/35077213 0028-0836 Google Scholar
A. Dellas,
H. Moch,
E. Schultheiss,
G. Feichter,
A. C. Almendral,
F. Gudat, and
J. Torhorst,
“Angiogenesis in cervical neoplasia: Microvessel quantitation in precancerous lesions and invasive carcinomas with clinicopathological correlations,”
Gynecol. Oncol., 67 27
–33
(1997). https://doi.org/10.1006/gyno.1997.4835 0090-8258 Google Scholar
Y. A. Declerck,
“Interactions between tumour cells and stromal cells and proteolytic modification of the extracellular matrix by metalloproteinases in caner,”
Eur. J. Cancer, 36 1258
–1268
(2000). 0959-8049 Google Scholar
A. E. Profio and
D. R. Doiron,
“A feasibility study of the use of fluorescence bronchoscopy for the localization of small lung tumors,”
Phys. Med. Biol., 22 949
–957
(1977). https://doi.org/10.1088/0031-9155/22/5/014 0031-9155 Google Scholar
P. R. Alfano,
D. B. Tata,
J. Cordero,
P. Tomashefsky,
F. W. Longo, and
M. A. Alfano,
“Laser induced fluorescence spectroscopy from native cancerous and normal tissue,”
IEEE J. Quantum Electron., 20 1507
–1511
(1984). https://doi.org/10.1109/JQE.1984.1072322 0018-9197 Google Scholar
R. Richards-Kortum and
E. Sevick-Muraca,
“Quantitative optical spectroscopy for tissue diagnosis,”
Annu. Rev. Phys. Chem., 47 555
–606
(1996). https://doi.org/10.1146/annurev.physchem.47.1.555 0066-426X Google Scholar
G. A. Wagnieres,
W. M. Star, and
B. C. Wilson,
“In vivo fluorescence spectroscopy and imaging for oncological applications,”
Photochem. Photobiol., 68 603
–632
(1998). https://doi.org/10.1562/0031-8655(1998)068<0603:VFSAIF>2.3.CO;2 0031-8655 Google Scholar
N. Ramanujam,
“Fluorescence spectroscopy of neoplastic and non-neoplastic tissues,”
Neoplasia, 2 88
–117
(2000). 1522-8002 Google Scholar
K. T. Schomacker,
J. K. Frisoli,
C. Compton,
T. J. Flotté,
J. M. Richter,
N. S. Nishioka, and
T. F. Deutsh,
“Ultroviolet laser-induced fluorescence of colonic tissue: Basic biology and diagnostic potential,”
Lasers Surg. Med., 12 63
–78
(1992). 0196-8092 Google Scholar
N. Ramanujam,
M. F. Mitchell,
A. Mahadevan,
S. Warren,
S. Thomsen,
E. Silva, and
R. Richards-Kortum,
“In vivo diagnosis of cervix intraepithelial neoplasia using -excited laser-induced fluorescence,”
Proc. Natl. Acad. Sci. U.S.A., 9 10193
–10197
(1994). 0027-8424 Google Scholar
M. Panjehpour,
B. F. Overholt,
T. Vo-Dinh,
R. C. Haggitt,
D. H. Edwards, and
F. P. Buckley,
“Endoscopic fluorescence detection of high-grade dysplasia in Barrett’s esophagus,”
Gastroenterology, 111 93
–101
(1996). https://doi.org/10.1053/gast.1996.v111.pm8698231 0016-5085 Google Scholar
C. S. Betz,
M. Mehlmann,
K. Rick,
H. Stepp,
G. Grevers,
R. Baumgartner, and
A. Leunig,
“Autofluorescence imaging and spectroscopy of normal and malignant mucosa in patients with head and neck cancer,”
Lasers Surg. Med., 25 323
–334
(1999). https://doi.org/10.1002/(SICI)1096-9101(1999)25:4<323::AID-LSM7>3.3.CO;2-G 0196-8092 Google Scholar
B. Chance,
B. Schoener,
R. Oshino,
F. Itshak, and
Y. Nakase,
“Oxidation-reduction ratio studies of mitochondria in freeze-trapped samples,”
J. Biol. Chem., 254 4764
–4771
(1979). 0021-9258 Google Scholar
G. I. Zonios,
R. M. Cothren,
J. T. Arendt,
J. Wu,
J. V. Dam,
J. M. Crawford,
R. Manoharan, and
M. S. Feld,
“Morphological model of human colon tissue fluorescence,”
IEEE Trans. Biomed. Eng., 43 113
–122
(1996). https://doi.org/10.1109/10.481980 0018-9294 Google Scholar
C. K. Brookner,
M. Follen,
I. Boiko,
J. Galvan,
S. Thomsen,
A. Malpica,
S. Suzuki,
R. Lotan, and
R. Richards-Kortum,
“Autofluorescence patterns in short-term cultures of normal cervical tissue,”
Photochem. Photobiol., 71 730
–736
(2000). https://doi.org/10.1562/0031-8655(2000)071<0730:APISTC>2.0.CO;2 0031-8655 Google Scholar
R. Drezek,
K. Sokolov,
U. Utzinger,
I. Boiko,
A. Malpica,
M. Follen, and
R. Richards-Kortum,
“Understanding the contribution of NADH and collagen to cervical tissue fluorescence spectra: Modeling, measurements and implications,”
J. Biomed. Opt., 6 385
–396
(2001). https://doi.org/10.1117/1.1413209 1083-3668 Google Scholar
I. Georgakoudi,
B. C. Jacobson,
M. G. Muller,
E. E. Sheets,
K. Badizadegan,
D. L. Carr-Locker,
C. P. Crum,
C. W. Boone,
R. R. Dasari,
J. V. Dam, and
M. S. Feld,
“NAD(P)H and collagen as in vivo quantitative fluorescent biomarkers of epithelial precancerous changes,”
Cancer Res., 62 682
–687
(2002). 0008-5472 Google Scholar
K. Sokolov,
J. Galvan,
A. Myakov,
A. Lacy,
R. Lotan, and
R. Richards-Kortum,
“Realistic three-dimensional epithelial tissue phantoms for biomedical optics,”
J. Biomed. Opt., 7 148
–156
(2002). https://doi.org/10.1117/1.1427052 1083-3668 Google Scholar
A. Pradhan,
P. Pal,
G. Durocher,
L. Villeneuve,
A. Balassy,
F. Babai,
L. Gaboury, and
L. Blanchard,
“Steady state and time resolved fluorescence properties of metastatic and non-metastatic malignant cells from different species,”
J. Photochem. Photobiol., B, 31 101
–112
(1995). https://doi.org/10.1016/1011-1344(95)07178-4 1011-1344 Google Scholar
R. Drezek,
C. Brookner,
I. Pavlova,
I. Boiko,
A. Malpica,
R. Lotan,
M. Follen, and
R. Richards-Kortum,
“Autofluoresecence microscopy of fresh cervical-tissue sections reveals alterations in tissue biochemistry with dysplasia,”
Photochem. Photobiol., 73 636
–641
(2001). https://doi.org/10.1562/0031-8655(2001)073<0636:AMOFCT>2.0.CO;2 0031-8655 Google Scholar
T. J. Romer,
M. Fitzmaurice,
R. M. Cothren,
R. Richards-Kortum, M. V. Sivak Jr., J. R. Kramer Jr.,
“Laser-induced fluorescence microscopy of normal colon and dysplasia in colonic adenomas: Implications for spectroscopic diagnosis,”
Am. J. Gastroenterol., 90 81
–87
(1995). 0002-9270 Google Scholar
M. Kobayashi,
K. Shibuya,
H. Hoshino, and
T. Fujisawa,
“Spectroscopic analysis of the autofluorescence from human bronchus using an ultraviolet laser diode,”
J. Biomed. Opt., 7 603
–608
(2002). https://doi.org/10.1117/1.1506932 1083-3668 Google Scholar
Y. Wu,
P. Xi,
J. Y. Qu,
T. Cheung, and
M. Yu,
“Depth-resolved fluorescence spectroscopy reveals layered structure of tissue,”
Opt. Express, 12 3218
–3223
(2004). https://doi.org/10.1364/OPEX.12.003218 1094-4087 Google Scholar
Y. Wu,
P. Xi,
J. Y. Qu,
T. Cheung, and
M. Yu,
“Depth-resolved fluorescence spectroscopy of normal and dysplastic cervical tissue,”
Opt. Express, 13 382
–388
(2005). https://doi.org/10.1364/OPEX.13.000382 1094-4087 Google Scholar
J. A. Kiernan, Histological and Histochemical methods: Theory and Practice, Butterworth Heinemann, Oxford
(1999). Google Scholar
N. D. Kirkpatrick,
C. Zou,
M. A. Brewer,
W. R. Brands,
R. A. Drezek, and
U. Utzinger,
“Endogenous fluorescence spectroscopy of cell suspensions for chemopreventive drug monitoring,”
Photochem. Photobiol., 81 125
–134
(2005). https://doi.org/10.1562/2004-08-09-RA-267.1 0031-8655 Google Scholar
M. H. Ross,
E. J. Reith, and
L. J. Romrell, Histology: A text and atlas, 2nd ed.Williams & Wilkins, Baltimore
(1989). Google Scholar
B. Chance,
P. Cohen,
F. Jobsis, and
B. Schoener,
“Intracellular oxidation-reduction states in vivo,”
Science, 137 499
–508
(1962). 0036-8075 Google Scholar
N. Ramanujam,
“Fluorescence spectroscopy in vivo,”
Encyclopedia of Analytical Chemistry, 20
–56 John Wiley & Sons Ltd, New York
(2000). Google Scholar
T. Galeotti,
G. D. V. Van. Rossum,
D. H. Mayer, and
B. Chance,
“On the fluorescence of NAD(P)H in whole-cell preparations of tumours and normal tissues,”
Eur. J. Biochem., 17 485
–496
(1970). 0014-2956 Google Scholar
J. Eng,
R. M. Lynch, and
R. S. Balaban,
“NADH fluorescence spectroscopy and imaging of isolated cardiac myocytes,”
Biophys. J., 55 621
–630
(1989). 0006-3495 Google Scholar
L. Hassinen, and
B. Chance,
“Oxidation-reduction properties of the mitochondrial flavoprotein chain,”
Biochem. Biophys. Res. Commun., 31 895
–900
(1968). 0006-291X Google Scholar
S. Huang,
A. A. Heikal, and
W. W. Webb,
“Two-photon fluorescence spectroscopy and microscopy of NAD(P)H and Flavoprotein,”
Biophys. J., 82 2811
–2825
(2002). 0006-3495 Google Scholar
T. Collier,
M. Follen,
A. Malpica, and
R. Richards-Kortum,
“Source of scattering in cervical tissue: Determination of the scattering coefficient by confocal microscopy,”
Appl. Opt., 44 2072
–2081
(2005). https://doi.org/10.1364/AO.44.002072 0003-6935 Google Scholar
M. G. Muller,
T. A. Valdez,
I. Georgakoudi,
V. Backman,
C. Fuentes,
S. Kabani,
N. Laver,
Z. Wang,
C. W. Boone,
R. R. Dasari,
S. M. Shapshay, and
M. S. Feld,
“Spectroscopic detection and evaluation of morphologic and biochemical changes in early human oral carcinoma,”
Cancer, 97 1681
–1692
(2003). 0008-543X Google Scholar
K. Konig and
I. Riemann,
“High-resolution multiphoton tomography of human skin with subcellular spatial resolution of human skin with subcellular spatial resolution and picosecond time resolution,”
J. Biomed. Opt., 8 432
–439
(2003). https://doi.org/10.1117/1.1577349 1083-3668 Google Scholar
|
||||||||||||||||||||||||


