

|
|
|
Imaging of individual cells in flow in vivo is potentially important for studying cell–cell interaction, blood transport (e.g., oxygen delivery), the response of cells to different interventions (e.g., drugs, radiation), and disease diagnosis and prevention (e.g., metastases, heart attack or stroke alert, diabetic shock, sickle-cell crisis, etc.). In particular, degree and dynamic of changes in cells’ mechanical properties can be viewed as a new biological marker sensitive to early disease development because even small disturbances at the molecular level [e.g., modification of the protein-spectrin structure of red blood cells (RBCs)] may be accompanied by significant changes in cytoskeletal structures responsible for cell deformability and elasticity1, 2 (e.g., increased rigidity of cancer cells). A number of well-developed, highly sensitive methods provide high-resolution imaging of RBCs in vitro, including monitoring of RBC deformability dynamic with advanced flexible microchannel.3 Until now, these and others similar approaches were tested in only in vitro studies.4, 5 However, there is increasing recognition that in vitro data cannot correspond entirely to the physiological situation in vivo including complex environment within vessel, multilevel regulation of cell function, and cell-cell interactions.6, 7 Further, invasive isolation of cells from their native environment and their processing may not only introduce artifacts but also make it impossible to examine the same cell population over long time periods. Until now, imaging of the flowing blood cells was realized at the moderate CCD camera speeds, in particular, at 750 to (fps) in blood flow,8, 9 and in lymph flow10 on an animal rat model. These speeds are not quite enough to image fast-moving RBCs in most of the blood microvessels. In addition, high optical resolution was not realized in these experiments (e.g., RBCs looked like spots with fuzzy edges). On other hand, the relatively high resolution vital optical microscopy has been used in different animal models including our previous studies 11, 12, 13, 14, 15, 16 (e.g., rat and mouse mesentery, muscle, and ear) mainly in two modes: (1) a relatively slow, successive-framing mode by which only slow-moving cells can be imaged (e.g., so-called “rolling” leukocytes with an average velocity of ), or (2) a short-time-exposure mode ( to ) by which just single images of fast-moving cells can be captured. To our knowledge, simultaneous high-optical-resolution and high-speed imaging of fast-moving cells (e.g., RBCs in arterioles with a velocity up to 5 to ) in natural conditions with successive high-speed framing that is crucial to time-resolved monitoring of cells’ transient (i.e., dynamic) deformability has not yet been developed in vivo. In vivo flow image cytometery schematics 11, 12, 13, 14 on the technical platform of an Olympus BX51 microscope was adopted to realize this approach with an advanced CMOS camera (model MV-D1024-160-CL-8, Photonfocus, Lachen, Switzerland) [Fig. 1a ]. Rat mesentery as an almost ideal animal model was chosen to test high-speed optical imaging of flowing cells because it consists of very thin (8 to ), relatively transparent connective tissue with a single layer of blood and lymph microvessels.11 Male Sprague-Dawley rats weighting between 150 and were used for experiments according to animal protocol approved by the University of Arkansas for Medical Sciences (UAMS) Institutional Animal Care and Use Committee (IACUC). In accordance to well established procedure, 11, 12, 13, 14, 17 the anesthetized rats [ketamine/xylazine intramuscular (i.m.)] were laparotomized by midabdominal incision , and small-intestinal mesentery was placed on a thermostabilizing customized microscope stage and maintained at the same body temperature as the rat ). The mesentery was bathed with a constant diffusion of warm Ringer’s solution ( , pH 7.4). As established, such procedures do not markedly influence the properties of flowing cells for at least .17 Fig. 1(a) Schematic of high-speed imaging of cells in blood vessels of rat mesentery with different areas of interest: (b) and (c) with magnifications , and , respectively. 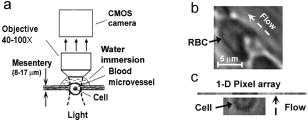 The minimum frame rate for avoiding optical resolution distortion due to motion, was chosen on the basis of the condition , where is the maximum flow velocity. For the typical parameters and , . High-speed imaging without loss of spatial resolution was achieved by adjusting the area of interest. For example, four typical areas of interests, , , , and pixels corresponded to frame rates of 500, 2500, 10,000, and , respectively. At magnification, the sizes of these areas of interest (at a pixel size) in the sample plane were , , , and , respectively. The largest areas of interest were useful for providing an overview of the mesenteric vessel network, while small areas were better suited for high-resolution imaging of single cells [Fig. 1b]. The highest frame speed could be achieved with a linear pixel array, although further reconstruction of 2-D cell images was required [Fig. 1c]. Optical resolutions, estimated with nanoscale colored polystyrene beads, were approximately 700, 350, and at , , and magnifications, respectively. The combination of light-absorption and scattering effects on cells made it possible to visualize and identify most blood cells without conventional labeling and vital staining with the use just of bright-field microscopy. In particular, due to relatively strong light absorption by RBCs in the visible spectral range, these single cells in flow appeared mostly as dark objects in transillumination mode, while weakly absorbing white blood cells (WBCs) and platelets appeared either as light objects (e.g., in the presence of many more strongly absorbing RBCs in blood flow or with dominant scattering effects) or, in contrast, as slightly dark objects (e.g., in the transparent plasma without RBCs). In the “packed” flow, RBCs sometimes exhibited bright margins, or are seen even as light objects due to multiply scattering effects. This is because the light during propagation through many other RBCs before reaching the plane of focus was significantly scattered and attenuated through absorption resulted in dominant scattering light around imaged cells. The CMOS camera’s sensitivity was sufficient to visualize most of these cells with conventional continuous mode illumination in the frame-rate range used. This technique confirmed the well-known fact that normal RBCs (basically a 5 to biconcave disk) flowing in single-file through capillaries or postcapillary venules with a velocity of 0.3 to are usually deformed into parachute-like shapes16, 18, 19 [Fig. 1b]. High-speed, high-resolution imaging, however, revealed for the first time that RBCs in fast blood flow undergo more significant (than previously believed) deformations in geometrically irregular regions (e.g., bifurcations, curves, narrowed areas, etc.), as well as in their interactions with other cells. In particular, Fig. 2a shows the high deformability of parachute-like RBCs as they squeezed through a narrow gap between the vessel wall and another cell (rigid RBC or small WBC), adherent to the opposite wall. High-speed imaging also demonstrated how quickly relatively fast flowing RBCs changed shape as they interacted with much more slowly moving rolling WBCs [Fig. 2b]. Figure 2c shows a very considerable stretching up to at least 0.4 to (in 2-D projection) of two RBCs in the diverging flow streams in a bifurcation zone. The typical value of deformation index (DI), defined as the ratio of cell length to width, was found to be approximately 7.3 in curved-vessel flow [Fig. 2c, middle] compared to a DI of 1.4 to 1.5 in straight-microvessel flow [Fig. 2a, left] and a DI of 1 for almost static or adherent cells [Fig. 2a]. Fig. 2(a) Three frames of parachute-shaped RBC traveling through capillary at ( , 3.7, and 1.5, respectively, , ); (b) interaction of fast-moving RBC (arrow head) with slow-rolling WBC (arrow with circle) ( , ); (c) two RBCs in an area of merging flow streams with a velocity of : left RBC , 6.7, and 7.3; right RBC , 2.2, and 3.4, respectively ( ; ).  Slow-moving (30 to ), rolling WBCs were reliably visualized at a relatively slow frame rate of 20 to , at which fast-flowing RBCs (velocity to ) looked like the nonstructural dark background due to motion distortion. Only a fast frame rate provided time-resolved monitoring of the deformation of fast-moving RBCs as they interacted with rolling WBCs [Fig. 2b]. Labeling-free identification of single platelets is difficult to achieve because these weakly absorbing cells are also small (2 to ). Nevertheless, our technique has provided relatively good contrast images of both slow- [Fig. 3a ] and fast-flowing [ , Fig. 3b] single platelets in blood microvessels. The best-quality images of platelets were obtained in the RBC-free space of the microvessel lumen [Fig. 3b]. Fig. 3(a) Images of platelets in slow flow with velocity of ( ; ) and (b) two (frames 106 and 110) images of platelets (arrows) in relatively fast flow with a velocity of ( ; ); dashed lines show internal margin of microvessel.  The most difficult task was to obtain images of RBCs in multifile cell flow in 30 to venules and especially in arterioles, which have the highest axial velocity (up to ). Nevertheless, the monitoring of image sequences at a high frame rate of by adjustment of the focus locations made it possible to record the size and shape dynamic of selected single RBCs in fast flow [Fig. 4a ]. In addition, the continuous video framing has the potential to measure linear velocity of several cells traveling along a cross-section of a microvessel simultaneously [Fig. 4a]. High-speed imaging demonstrated for the first time the dynamic changes of RBC 2-D shape, and correspondingly, transient deformation, in relatively fast arteriolar straight flow ( and higher). In particular, extremely high cell dynamic deformation (DI up to10) was observed in a very short time [Fig. 4b]. In comparison, for blood straight flow in a tube in vitro the maximum DI has been reported to be approximately 1.5 in healthy individuals, with a decrease to 1.05 in diabetes mellitus patients.21 Fig. 4(a) Three subsequent images (frames 128, 129 and 164) of a few RBCs in different files of fast arteriolar flow with velocities for left RBC (nearest to vessel wall), for middle RBC, and for right RBC (nearest to vessel axis) ( ; ); (b) fast transient deformation of single RBC in flow with a velocity of ; , 3.0, 5.9, and 10.3, respectively ( ; ). 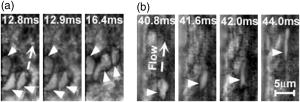 As expected, some limitations of the optical imaging used were revealed in fast multifile flow. In particular, even at a low hematocrit19, 20 , several cells simultaneously appeared in a small focal area of detection, and up to six to eight cells appeared in a whole microvessel cross section, which led to the overlapping of cell images in 2-D projection making their identification quite difficult. It seems that this problem could be resolved partly by hemodilution and reduction of hematocrit in analogy to study of RBC aggregation.8, 9 However, hematocrit may effect significantly on RBC deformability.18 The overcoming of this limitation may require developing of 3-D imaging in vivo. In some cases, fast radial displacement of cells in multifile flow prevented continuing high-resolution imaging of the same cell with a strongly focused micro-objective at high magnification. Small arterioles (diameter, 20 to ) were found to be the most suitable for such measurements with a fixed focal plane because cells in these vessels mainly moved along the flow axis. Furthermore, a high enough flow velocity in such vessels still decreased the probability of transient RBC aggregation19 (in “rouleaux” or clumps), thus facilitating the study of individual cells. In a future study, several modes (or digital cameras) operating at different frame rates and hence sensitivity levels (which usually decrease with increases in speed) might be useful for simultaneous imaging of cells moving at different velocities. This approach might include (1) imaging of static (i.e., adhered) or slow-moving cells (e.g., rolling WBCs) at 10 to , (2) monitoring of the deformability of RBCs traveling in single-file flow in capillaries and postcapillary venules (velocity, 500 to ) at 500 to , and (3) high-speed imaging of individual cells moving in multifile fast flow (velocity, 5 to ) at . Despite the distinctive optical contrast of RBCs, WBCs, and platelets, the low absorption sensitivity of transmission microscopy makes it difficult to differentiate cells with slightly different absorption properties (e.g., subtypes of WBCs). For this purpose, recently developed labeling-free, photothermal flow cytometry in vivo might be useful because its high absorption sensitivity makes it possible to image weakly absorbing cellular structures with specific “fingerprints.”11, 12, 14 The approach that we have developed also has the potential to be used in vivo in humans. Noninvasive mode can be realized with the use of thin, translucent structures, such as ear, eyelid, or interdigital membrane,11 with optical clearing.5 An invasive approach might involve incorporation of a fiber-chip-based catheter in vessels. In summary, a high-speed (up to 10,000 with the potential for ), high-resolution (up to ) continuous in vivo optical imaging technique was developed to monitor and identify RBCs, WBCs, and platelets in the blood flow of rat mesenteric microvessels without conventional labeling. It was demonstrated that the frame rate up to at the high optical resolution could be sufficient for full estimation of individual cell behavior and cellular biomechanical properties in vivo in microvascular net. Potential applications of this technique may include (1) fundamental study of cell-cell interactions in native flow, with a focus on transient RBC deformability during RBC-RBC or RBC-WBC interactions; (2) estimation of the proportion of fast-moving WBCs traveling with RBCs in axial (core) flow to slow-moving (rolling) WBCs, which may have diagnostic value for the study of some pathologic conditions (e.g., inflammation, when the number of rolling WBCs dramatically increases);20 (3) identification of rare abnormal cells (e.g., cancerous or sickled cells) on the basis of their different deformability in flow; (4) imaging of platelets during thrombus formation and interaction with metastatic cancer cells; (5) study of the influence of environmental factors (e.g., drugs or radiation) on individual blood cells; (6) estimation of blood viscosity in high-velocity flow through the principal determinants of blood rheology (hematocrit, cell deformability, and aggregation); (7) study of the dynamics of intravascular cell aggregation and adhesion to endothelial cells; (8) estimation of velocity profiles in fast flow; and (9) imaging and detection of individual cell dynamics in afferent lymph flow with cell velocity up to .10 AcknowledgmentsThis work, performed at UAMS, was supported by the National Institutes of Health/National Institute of Biomedical Imaging and Bioengineers (NIH/NIBIB) under Grants EB001858 and EB000873 (VPZ). The authors thank Scott Ferguson for his assistance with installation of the camera and heated stage. VVT was supported by grant of Federal Agency of Education of RF No. 1.4.06, RNP.2.1.1.4473, and by the Civilian Research and Development Foundation (CRDF) Basic Research and Higher Education Program (BRHE) Grant RUXO-006-SR-06. ReferencesJ. F. Stoltz,
“Red blood cell microrheology (clinical and pharmacological applications),”
Ric Clin. Lab, 13 53
–70
(1983). 0390-5748 Google Scholar
B. Lincoln,
H. M. Erickson,
S. Schinkinger,
F. Wottawah,
D. Mitchell,
S. Ulvick,
C. Bilby, and
J. Guck,
“Deformability-based flow cytometry,”
Cytometry, 59 203
–209
(2004). 0196-4763 Google Scholar
M. Abkarian,
M. Faivre, and
H. A. Stone,
“High-speed microfluidic differential manometer for cellular-scale hydrodynamics,”
Proc. Natl. Acad. Sci. U.S.A., 103 538
–542
(2006). 0027-8424 Google Scholar
G. Popescu,
T. Ikeda,
C. A. Best,
K. Badizadegan,
R. R. Dasari, and
M. S. Feld,
“Erythrocyte structure and dynamics quantified by Hilbert phase microscopy,”
J. Biomed. Opt., 10 060503
(2005). https://doi.org/10.1117/1.2149847 1083-3668 Google Scholar
V. V. Tuchin, Optical Clearing of Tissues and Blood, SPIE Press, Bellingham, WA (2005). Google Scholar
A. Chung,
S. Karlan,
E. Lindsley,
S. Wachsmann-Hogiu, and
D. L. Farkas,
“In vivo cytometry: a spectrum of possibilities,”
Cytometry, 69 142
–146
(2006). 0196-4763 Google Scholar
C. Scheinecker,
“Application of in vivo microscopy: evaluating the immune response in living animals,”
Arthritis Res. Ther., 7 246
–252
(2005). 1478-6354 Google Scholar
S. Kim,
A. S. Popel,
M. Intaglietta, and
P. C. Johnson,
“Aggregate formation of erythrocytes in postcapillary venules,”
Am. J. Physiol. Heart Circ. Physiol., 288 H584
–H590
(2005). 0363-6135 Google Scholar
S. Kim,
A. S. Popel,
M. Intaglietta, and
P. C. Johnson,
“Effect of erythrocyte aggregation at normal human levels on functional capillary density in rat spinotrapezius muscle,”
Am. J. Physiol. Heart Circ. Physiol., 290 H941
–H947
(2006). 0363-6135 Google Scholar
J. B. Dixon,
D. C. Zawieja,
A. A. Gashev, and
G. L. Cote,
“Measuring microlymphatic flow using fast video microscopy,”
J. Biomed. Opt., 10 064016
(2005). https://doi.org/10.1117/1.2135791 1083-3668 Google Scholar
V. P. Zharov,
E. I. Galanzha, and
V. V. Tuchin,
“Integrated photothermal flow cytometry in vivo,”
J. Biomed. Opt., 10 51502
(2005). 1083-3668 Google Scholar
V. P. Zharov,
E. I. Galanzha, and
V. V. Tuchin,
“Photothermal image flow cytometry in vivo,”
Opt. Lett., 30 628
–630
(2005). https://doi.org/10.1364/OL.30.000628 0146-9592 Google Scholar
E. I. Galanzha,
V. V. Tuchin, and
V. P. Zharov,
“In vivo integrated flow image cytometry and lymph/blood vessels dynamic microscopy,”
J. Biomed. Opt., 10 54018
(2005). 1083-3668 Google Scholar
V. P. Zharov,
E. I. Galanzha, and
V. V. Tuchin,
“In vivo photothermal flow cytometry: imaging and detection of cells in blood and lymph flow (review/prospect),”
J. Cell. Biochem., 97 916
–932
(2006). 0730-2312 Google Scholar
D. A. Sipkins,
X. Wei,
J. W. Wu,
J. M. Runnels,
D. Cote,
T. K. Means,
A. D. Luster,
D. T. Scadden, and
C. P. Lin,
“In vivo imaging of specialized bone marrow endothelial microdomains for tumour engraftment,”
Nature (London), 435 969
–973
(2005). 0028-0836 Google Scholar
R. Skalak and
P. I. Branemark,
“Deformation of red blood cells in capillaries,”
Science, 164 717
–719
(1969). 0036-8075 Google Scholar
G. Horstick,
T. Kempf,
M. Lauterbach,
M. Ossendorf,
L. Kopacz,
A. Heimann,
H. A. Lehr,
S. Bhakdi,
J. Meyer, and
O. Kempski,
“Plastic foil technique attenuates inflammation in mesenteric intravital microscopy,”
J. Surg. Res., 94 28
–34
(2000). https://doi.org/10.1006/jsre.2000.5990 0022-4804 Google Scholar
H. H. Lipowsky,
“Microvascular rheology and hemodynamics,”
Microcirculation (N.Y.), 12 5
–15
(2005). 0275-4177 Google Scholar
H. Schmid-Schonbein,
“Blood rheology and physiology of microcirculation,”
Ric Clin. Lab, 11 13
–33
(1981). 0390-5748 Google Scholar
J. C. Firrell and
H. H. Lipowsky,
“Leukocyte margination and deformation in mesenteric venules of rat,”
Am. J. Physiol., 256 H1667
–H1674
(1989). 0002-9513 Google Scholar
H. Minamitani,
K. Tsukada,
E. Sekizuka, and
C. Oshio,
“Optical bioimaging: from living tissue to a single molecule: imaging and functional analysis of blood flow in organic microcirculation,”
J. Pharmacol. Sci., 93 227
–233
(2003). Google Scholar
|


