
|
|
|
Dual energy x-ray absorptiometry (DEXA) has revolutionized the diagnosis and treatment of osteoporosis, a disorder characterized by loss of bone mass and quality resulting in more than 1 million fractures per year in the United States, causing disability and even death. DEXA measures only bone mineral density and not bone quality, a term that encompasses bone architecture, material properties, and remodeling dynamics. It thus predicts only 60 to 70% of fracture risk. There is significant overlap in measurements of bone mineral density between individuals with and without fractures.1, 2, 3 DEXA also grossly underpredicts the influence of drugs used to treat osteoporosis.4 The limitations of DEXA have fueled the search for new diagnostic and monitoring technologies. We used Raman microscopic imaging of trabecular bone (density and age matched) from the proximal femur to distinguish between tissue from females who had suffered osteoporotic fracture and those who died from causes unrelated to bone tissue problems.5 Iliac crest biopsies from females with and without the clinical diagnosis of osteoporosis were also evaluated. The best predictor for osteoporosis was the carbonate/phosphate ratio at the periosteal surface of the biopsy specimens. Matrix bands were less predictive because the archived specimens were fixed and embedded in polymethyl methacrylate which can partially denature proteins.6, 7 The role of diffusive light transport in highly scattering systems is widely known in biomedical optics,8, 9 but was not fully appreciated by the Raman community until recently.10, 11, 12 As in other spectroscopies, fiber optic Raman probes can be used to gather subsurface information from highly scattering specimens if the detecting fibers are located some distance from the point(s) of introduction of the exciting laser light.13 We have used a probe with distributed laser light and an array of collection fibers14 to recover bone tissue spectra in cadaveric human tissue15 at depths of . We have used glycerol optical clearing16 to improve transcutaneous signal recovery.17 Using a probe with two concentric rings of collection fibers and a single illumination fiber Matousek demonstrated in vivo transcutaneous Raman spectroscopy of phalanges of human volunteers.18 Here we demonstrate transcutaneous Raman spectroscopy using a fiber optic probe with an axicon/lens doublet19 that distributes laser power in an annulus surrounding the field of view of a circular array of 50 collection fibers. In our previously reported global illumination configuration, which enabled subsurface mapping, coincidence of the illumination region and the field of view emphasized Raman scatter arising from the surface or close to the surface of the specimen. A completely offset collection region results in a higher ratio of subsurface to surface spectra,13, 20 enhancing contrast at the cost of losing subsurface spatial information. Figure 1 is a schematic of the probe. A diode laser (Invictus, Kaiser Optical Systems, Ann Arbor, Michigan) is focused into a core-fused silica fiber, which is collimated and focused into a fused silica axicon (cone angle , Delmar Photonics, San Diego, California). A planoconvex and negative-focal-length fused silica lenses focus the beam to an annulus. A dichroic mirror aligns the annulus to the field of view of the collection fibers (PhAT probe, Kaiser Optical Systems). The assembly is mounted on the distal end of the PhAT probe. The PhAT probe output is presented to an imaging spectrograph (HoloSpec, Kaiser Optical Systems). The dispersed Raman scatter is imaged onto a back-illuminated deep-depletion CCD (Andor Classic, Andor Technologies, Belfast, United Kingdom) and analyzed by band target entropy minimization (BTEM).14 Band height ratios were calculated in GRAMS/AI (Thermo Galactic, Madison, Wisconsin). At the probe head the laser beam was about (chicken) and (rat). Fig. 1Schematic of fiber optic Raman system. The components are as marked in the figure. Lenses of different focal lengths were used to adjust dimensions of illuminating annulus as needed. The drawing is not to scale.  Sprague-Dawley rat tibiae and femora were used to study integration time dependence. Measurements were made at an overlying skin thickness of approximately 1 mm using integration times between 5 and 120 s. Depilatory lotion was used to remove hair from the rat skin. Chicken tibiae were used to study penetration at a depth of 2 and 4 mm. For all specimens, tissues were treated with an optical clearing agent, glycerol, for approximately 1 min before the start of each experiment, and after completing a sequence of measurements, the overlying tissue was removed and Raman spectra of the exposed bone were collected with the PhAT probe. Figure 2 shows recovered rat tibia spectra as a function of integration time. The spectra are presented as recovered by BTEM without low-pass filtering or smoothing. The mineral spectrum recovery is good above about . The intense phosphate band is visible, though distorted, even at integration times as low as . As Table 1 shows, it is possible to obtain reasonable agreement of carbonate/phosphate ratios between measurements made on exposed bone and through of skin at integration times of or longer. BTEM did not completely separate the skin spectrum from the bone spectrum. Amide III and the bending mode at ca. are about four times larger in the recovered spectra than in the spectrum of exposed bone. Incomplete separation results from oversampling the skin spectrum. In these experiments the annulus outer and inner diameters were about 7 and and the collection fiber field of view about . It was not possible with the available optics to generate a collection diameter below . Increasing the annulus i.d. to larger than to reduce contribution from skin caused a large fraction of laser light to miss the tibia entirely. Fig. 2Transcutaneous Raman spectra of rat tibia. The spectrum integration times are shown in the figure. The bands are phosphate, ; carbonate, ; amide III, ; matrix deformation, .  Table 1Carbonate/phosphate ratios measured transcutaneously and on exposed bone.
We collected spectra of chicken tibiae using the same excitation annulus. Figure 3 shows the recovered and corresponding exposed bone spectra at depth of 4 mm ( integration time), and also the average spectrum (dotted line) collected by the probe. The spectra have not been smoothed or filtered. Figure 3a shows the effect of using all 50 collection fibers for BTEM calculations. Comparison of the recovered spectrum with the exposed bone spectrum shows incomplete separation of the bone factor from the overlying tissue spectrum. This is most easily seen as the erroneously high intensity of the band. As Table 1 shows, at a depth, the error in measurement of carbonate/phosphate is 11.8%. If the outer ring of 18 collection fibers is excluded from the calculation, the recovery of the bone factor is improved [Fig. 3b] and the error is reduced to 7.6% because the operation is equivalent to increasing the distance between excitation annulus and collection fibers. SNR is not improved because the number of spectra included in the calculation is reduced. Fig. 3Measurements made through of overlying tissue on a chicken tibia at the mid diaphysis. Transcutaneous (dotted), recovered bone factor (gray), exposed bone (black): (a) recovered bone factor using data from all 50 collection fibers and (b) recovered bone factor using data from the 32 innermost collection fibers. 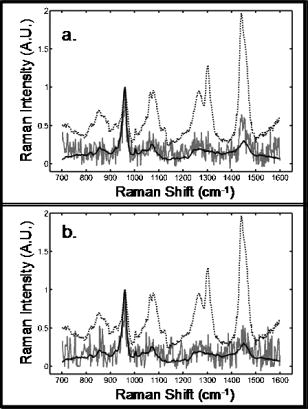 These preliminary results can be substantially improved by optimization of the design based on realistic modeling of the tissue optics of these complex skin, bone, and connective tissue systems. While much remains to be done, Raman spectroscopy shows promise as a complement to DEXA. Periosteal surfaces may be probed noninvasively up to a few millimeters below the skin surface (e.g., distal radius, vertebrae), or minimally invasive if deeper (e.g., iliac crest). Similarly, Raman spectroscopy may be useful in diagnosis and monitoring of patients with other bone diseases or genetic defects, most of which affect bone quality. Note that after this manuscript was submitted we learned that a similar annular illumination approach has been under independent development by P. Matousek with a manuscript reporting results in press.21 AcknowledgmentsThis research supported in part by the University of Michigan Musculoskeletal Core Research Center through National Institutes of Health (NIH) Grant No. P30 AR46024. ReferencesJ. R. Buchanan,
C. Myers,
R. B. Greer,
T. Lloyd, and
L. A. Varano,
“Assessment of the risk of vertebral fracture in menopausal women,”
J. Bone Jt. Surg., Am. Vol., 69 212
–218
(1987). 0021-9355 Google Scholar
B. L. Riggs,
H. W. Wahner,
W. L. Dunn,
R. B. Mazess,
K. Offord, and
L. J. Melton,
“Differential changes in bone mineral density of the appendicular and axial skeleton with aging: Relationship to spinal osteoporosis,”
J. Clin. Invest., 67 328
–335
(1981). 0021-9738 Google Scholar
B. L. Riggs,
H. W. Wahner,
E. Seeman,
K. P. Offord,
W. L. Dunn,
R. B. Mazess,
K. A. Johnson, and
L. J. d. Melton,
“Changes in bone mineral density of the proximal femur and spine with aging: differences between the posteneopausal and senine osteoporosis syndromes,”
J. Clin. Invest., 67 328
–335
(1982). 0021-9738 Google Scholar
P. D. Delmas and
E. Seeman,
“Changes in bone mineral density explain little of the reduction in vertebral or nonvertebral fracture risk with anti-resorptive therapy,”
Bone (N.Y.), 34 599
–604
(2004). 8756-3282 Google Scholar
B. R. McCreadie,
M. D. Morris,
T.-C. Chen,
D. S. Rao,
W. F. Finney,
E. Widjaja, and
S. A. Goldstein,
“Bone tissue compositional differences in women with and without osteoporotic fracture,”
Bone (N.Y.),
(8756-3282) Google Scholar
N. L. Pleshko,
A. L. Boskey, and
R. Mendelsohn,
“An FT-IR microscopic investigation of the effects of tissue preservation on bone,”
Calcif. Tissue Int., 51 72
–77
(1992). https://doi.org/10.1007/BF00296221 0171-967X Google Scholar
Y. Yeni,
J. Yerramshetty,
O. Akkus,
C. Pechey, and
C. Les,
“Effect of fixation and embedding on Raman spectroscopic analysis of bone tissue,”
Calcif. Tissue Int., 78 363
–371
(2006). 0171-967X Google Scholar
V. Tuchin, Tissue Optics. Light Scattering Methods and Instruments for Medical Diagnosis, SPIE Press, Bellingham, WA
(2000). Google Scholar
T. Vo-Dinh, Biomedical Photonics Handbook, CRC Press, Boca Raton, FL
(2003). Google Scholar
N. Everall,
T. Hahn,
P. Matousek, and
A. W. Parker,
“Photon migration in Raman spectroscopy,”
Appl. Spectrosc., 58 591
–597
(2004). https://doi.org/10.1366/000370204774103426 0003-7028 Google Scholar
N. Everall,
T. Hahn,
P. Matousek,
A. W. Parker, and
M. Towrie,
“Picosecond time-resolved Raman spectroscopy of solids: capabilities and limitations for fluorescence rejection and the influence of diffuse reflectance,”
Appl. Spectrosc., 55 1701
–1708
(2001). https://doi.org/10.1366/0003702011954053 0003-7028 Google Scholar
P. Matousek,
N. Everall,
M. Towrie, and
A. W. Parker,
“Depth profiling in diffusely scattering media using Raman spectroscopy and picosecond Kerr gating,”
Appl. Spectrosc., 59 200
–205
(2005). https://doi.org/10.1366/0003702053085115 0003-7028 Google Scholar
P. Matousek,
I. P. Clark,
E. Draper,
M. D. Morris,
A. Goodship,
N. Everall,
M. Towrie,
W. F. Finney, and
A. W. Parker,
“Subsurface probing of diffusely scattering media using spatially offset Raman spectroscopy (SORS),”
Appl. Spectrosc., 59 393
–400
(2005). 0003-7028 Google Scholar
M. V. Schulmerich,
W. F. Finney,
R. A. Fredericks, and
M. D. Morris,
“Subsurface Raman spectroscopy and mapping using a globally illuminated non-confocal fiber-optic array probe in the presence of Raman photon migration,”
Appl. Spectrosc., 60 109
–114
(2006). 0003-7028 Google Scholar
M. V. Schulmerich,
W. F. Finney,
V. Popescu,
M. D. Morris,
T. M. Vanasse, and
S. A. Goldstein,
“Transcutaneous Raman spectroscopy of bone tissue using a nonconfocal fiber optic array probe,”
Proc. SPIE, 6093 60930O
(2006). 0277-786X Google Scholar
V. V. Tuchin, Optical Clearing of Tissues and Blood, SPIE Press, Bellingham, WA
(2006). Google Scholar
M. V. Schulmerich,
M. D. Morris,
T. M. Vanasse, and
S. A. Goldstein,
“Optical clearing in transcutaneous Raman spectroscopy of bone tissue,”
Google Scholar
P. Matousek,
E. R. C. Draper,
A. E. Goodship,
I. P. Clark,
K. L. Ronayne, and
A. W. Parker,
“Noninvasive Raman spectroscopy of human tissue in vivo,”
Appl. Spectrosc., 60 758
–763
(2006). 0003-7028 Google Scholar
P.-A. Bélanger and
M. Rioux,
“Ring pattern of a lens-axicon doublet illuminated by a Gaussian beam,”
Appl. Opt., 17 1080
–1086
(1978). 0003-6935 Google Scholar
P. Matousek,
M. D. Morris,
N. Everall,
I. P. Clark,
M. Towrie,
E. Draper,
A. Goodship, and
A. W. Parker,
“Numerical simulations of subsurface probing in diffusely scattering media using spatially offset Raman spectroscopy,”
Appl. Spectrosc., 59 1485
–1492
(2005). 0003-7028 Google Scholar
P. Matousek,
“Inverse spatially offset Raman spectroscopy for deep non-invasive probing of turbid media,”
Appl. Spectrosc., Google Scholar
|


