|
|
|
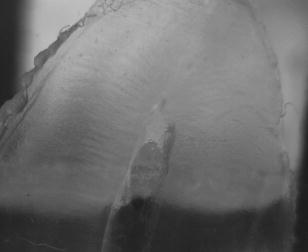
Characterization of biological tissues from intrinsically noisy digital images is currently considered in the frames of several scientific approaches, i.e., pattern recognition, texture analysis, and image processing.1, 2, 3, 4 Many methods are suggested to increase the contrast, eliminate scattered bright or dark pixels, and filter out noise and certain artifacts. Among the most popular are gray-level run techniques,5 fast Fourier transforms,6 and wavelet analysis.7 None is universal in application, but individual user preference is commonly based on features of the data. Texture analysis aims to characterize the image using a number of parameters that are sensitive to specific structural features of the object and especially to distinguish normal and abnormal biological tissues in the noisy images. For example, a few methods were developed for the detection of clustered microcalcifications from digital mammograms.8, 9, 10 Texture enhancement is also required when imaging subsurface tissue structures with a diffusively backscattered polarized beam. Previously it was shown that imaging the degree of polarization can enhance the visibility of the hidden x-ray-induced early fibrosis of mouse skin.11 The analysis of Pearson correlation coefficients was also used to estimate local variations of the directionality and orientation of the structural elements. That work led us to visualize the hidden structures of biological tissues by imaging regions of statistical similarities using the correlation coefficient as the measure of comparison. The mathematical basis for this approach was established earlier by a mathematical proof that such a measure enabled one to reveal dependencies between random variables.12, 13 Biological tissues often exhibit characteristic regular features or ornamental patterns. Therefore, various regions of the tissue image can be statistically well correlated. By choosing a region of interest (ROI) and comparing it with other regions of the image through the correlation coefficient, it is possible to map the degree of statistical similarities. This mapping can carry valuable comparative information about the structural features of the tissue. Let us consider the main principles of image processing using correlation coefficients. To evaluate the spatial correlation in the raw image data, one has an intensity matrix . Then two similar submatrices and of size , are introduced that are formed from the original matrix. Let the submatrix be centered at a given point with coordinates (indices) , while submatrix is shifted relative to by some vector . The Pearson correlation coefficient between two submatrices and is defined by the expression where and are the mean values of the elements of submatrices and , and stdev and stdev are the standard deviations of elements in submatrices and , respectively. The coefficient can vary between 1 and , depending on the degree of correlation between and . Correlation is maximal when or and minimal when . The minus sign of the correlation coefficient means that the corresponding elements have opposite signs relative to the mean values. To reveal possible structural similarities between various regions of the image (patterns), submatrix should be fixed at some reference point, while submatrix is scanned throughout the image, providing an image of correlation coefficients. Pearson correlation coefficient images were obtained by Matlab in with a computer (processor: amd64 3200). The image may be possible to obtain in real time with a high-speed computer.Note that linear tranforms of the intensity matrices do not affect the Pearson correlation coefficient: , where and are constants. For example, uniform scaling of the intensity matrices does not change the correlation coefficient. In practice, this means that overall intensity changes in the illuminating beam or background will not have an influence on the image of Pearson correlation coefficients. The efficiency of the proposed analysis is demonstrated by Fig. 1 . This image of a demineralized slice of human tooth illuminated by a linearly polarized illuminating light was taken by digital camera through a polarizer oriented perpendicular to the polarization vector of the incident beam. We expected to visualize the subsurface structure of the collagen network of the tooth using the birefringence effects of anisotropically oriented collagen bundles. In such experiments, diffusively scattered non-polarized light can mask the weak birefringence polarization effect, making some structural features barely visible on the sample surface. The multiple scattered light may be interpreted as a background noise. Some structural features may be barely visible on the surface of this sample. Processing the data with Pearson correlation coefficients, using the ROI as a reference, transforms the original image to the pattern shown in Fig. 2 . One can clearly see the ripples on the tooth slice. We believe that most of them are due to collagen bundles. The visibility of a set of weaker oblique narrow lines has been also enhanced. These lines reveal the slight scratches created by a diamond saw during sample preparation. More detailed consideration of Fig. 2 shows small grainy modulations of correlation coefficient that are independent of the pattern region. This fine effect is probably due to the CCD sensor’s matrix, not the intrinsic tissue structure. Fig. 2Eight-bit images of correlation coefficients corresponding to Fig. 1 calculated with respect to the ROIs shown by arrow. The size of ROI is .  Changes in the ROI position and size result in the transformation of the correlation pattern. However, the shift of the ROI position does not drastically change the characteristic features of the transformed patterns. The regions of statistical similarities are mainly preserved with variations only relative amplitude and sign. It appears that transformed matrices, corresponding to various ROI positions, are well correlated. It is especially true if the ROI is centered at the regions of statistical similarities with high correlation coefficients. Figure 2 demonstrates two images of correlation coefficients that were obtained with respect to different ROIs. Generally, if submatrix is correlated with submatrix and submatrix is also correlated with submatrix , then submatrix may not be correlated with submatrix . Fortunately, due to the textural characteristics of many tissues, submatrix is often correlated with submatrix . This factual independence from the ROI position choice enables us to plot regions of statistical similarities of the biological tissue with correlation coefficients in a robust manner. The size of the ROI should be optimized in accordance with expected characteristic scales of the tissue structure. Obviously, if the size of the ROI is too small, high levels of random fluctuations throughout the correlation coefficient image would not allow any structural features to be revealed. On the other hand, since spatial correlations at scales smaller than the ROI size are smoothed, the correlation coefficient would be close to zero everywhere if the chosen ROI size is too large. The influence of the ROI size on the information content of the image is illustrated in Fig. 3 . This figure presents correlation images obtained from the same raw data as in Fig. 2, but in Fig. 3a for smaller ROI size and in Fig. 3b for larger ROI sizes, relative to the Fig. 2. Though some features with characteristic scale close to the corresponding ROI size seem clearly enhanced, in general, both correlation images (Fig. 3) look less informative than that of Fig. 2. This may be due to loss of information at the characteristic scales of the sample structure, resulting either from less noise suppression [Fig. 3a] or smoothing out by spatial averaging [Fig. 3b]. Ideally, the ROI size should be close to the size of the major textural elements in question. In this letter, the optimal ROI position and size were chosen from analysis of correlation coefficient images obtained for different values of these parameters. A similar procedure can be easily implemented to extract structure information for investigation of other particular images. We plan to develop an algorithm to realize the automatic optimization of the ROI size for analysis of the tissue texture using correlation coefficients. Fig. 3Images of correlation coefficient corresponding to the same central point of ROI as in Fig. 2 For ROI dimensions of (a) and (b) .  ReferencesF. T. S. Yu and
S. Jutamulia, Optical Pattern Recognition, Cambridge University Press, Cambridge
(1998). Google Scholar
T. S. Huang, Picture Processing and Digital Filtering, Springer Verlag, Berlin
(1979). Google Scholar
R. H. T. Bates and
M. J. McDonnell, Image Restoration and Reconstruction, Clarendon Press, Oxford
(1986). Google Scholar
M. Sonka and
J. M. Fitzpatrick,
“Medical image processing and analysis,”
Handbook of Medical Imaging, 1218 SPIE Press, Bellingham
(2004). Google Scholar
S. Pavlopoulos,
E. Kyriacou,
D. Koutsouris,
K. Blekas,
A. Stafulopatis, and
P. Zoumpoulis,
“Fuzzy neural network-based texture analysis of ultrasonic images,”
IEEE Eng. Med. Biol., 19 39
–47
(2000). Google Scholar
J. H. Siewerdsen,
I. A. Cunninhgham, and
D. A. Jaffray,
“A framework for noise-power spectrum analysis of multidimensional images,”
Med. Phys., 29 2655
–2671
(2002). https://doi.org/10.1118/1.1513158 0094-2405 Google Scholar
E. Ercelebi and
S. Koc,
“Lifting-based wavelet domain adaptive Wiener filter for image enhancement,”
IEE Proc. Vision Image Signal Process., 153 31
–36
(2006). https://doi.org/10.1049/ip-vis:20045116 1350-245X Google Scholar
J. K. Kim and
H. W. Park,
“Statistical textural features for detection of microcalcifications in digital mammograms,”
IEEE Trans. Med. Imaging, 18 231
–238
(1999). https://doi.org/10.1109/42.764896 0278-0062 Google Scholar
T. Netsh and
H.-O. Peitgen,
“Scale-space signature foe the detection of clustered microcalcifications in digital mammograms,”
IEEE Trans. Med. Imaging, 18 774
–786
(1999). https://doi.org/10.1109/42.802755 0278-0062 Google Scholar
D. James,
B. D. Clymer, and
P. Schmalbrock,
“Texture detection of simulated microcalcification susceptibility effects in magnetic resonance imaging of breasts,”
J. Magn. Reson Imaging, 13 876
–881
(2001). 1053-1807 Google Scholar
A. P. Sviridov,
V. Chernomordik,
M. Hassan,
A. C. Boccara,
A. Russo,
P. Smith, and
A. Gandjbakhche,
“Enhancement of hidden structures of early skin fibrosis using polarization degree patterns and Pearson correlation analysis,”
J. Biomed. Opt., 10 051706
(2005). https://doi.org/10.1117/1.2073727 1083-3668 Google Scholar
E. H. Linfoot,
“An information measure of correlation,”
Inf. Control., 1 85
–89
(1957). 0019-9958 Google Scholar
C. B. Bell,
“Mutual information and maximal correlation as measures of dependence,”
Ann. Math. Stat., 33 587
–595
(1961). 0003-4851 Google Scholar
|