|
|
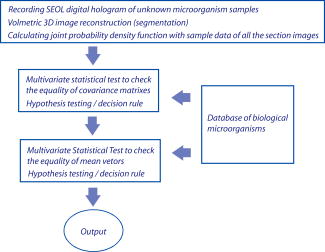
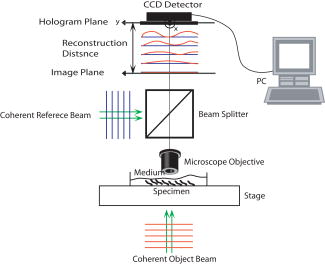
1.IntroductionDigital holographic techniques1, 2, 3 have been applied for three-dimensional (3D) visualization and recognition of objects. 4, 5, 6, 7, 8, 9, 10, 11 Recently, 3D holographic-based microscopy has been applied to the 3D recognition of micro-objects.19, 20, 21 Single-exposure on-line (SEOL) digital holography10 can provide real-time sensing and recognition of moving, growing, and reproducing microorganisms. One of the advantages of digital holography is that it allows us to digitally produce an autofocused volumetric 3D image of microorganisms or micro-objects from a single hologram. In particular, bacteria and other microorganisms have been currently analyzed by the traditional methods involving biochemical processing, which is not real time, may be very time-consuming, and requires special skills. Real-time sensing and recognition of bacteria or biological cells has many benefits. For example, it could be applied in biology, defense, and diagnosis of diseases. Most of the research in the recognition and classification of microorganisms has been based on their colors, two-dimensional (2D) intensity images, shapes, aggregation size, and reaction time. 12, 13, 14, 15, 16, 17, 18 Recently, we addressed two approaches for real-time 3D sensing and recognition of biological microorganisms.19, 20, 21 One is 3D morphology-based recognition, and the other is shape-independent 3D recognition. In the first approach, a series of image recognition techniques are used to analyze 3D geometrical shapes of microorganisms and consists of magnitude and phase distributions including segmentation, feature extraction, and graph matching. For the second approach, a number of sample segment features are randomly extracted from a reconstructed 3D image of a microorganism. These samples are processed using cost function and statistical estimation and inference algorithms. A hypothesis test for the comparing of the parameters between two populations is then performed for a statistical decision on the basis of sampling distribution information. In this paper, we present real-time volumetric 3D sensing and recognition of biological microorganisms using multivariate statistical estimation and inference algorithms based on digital holographic microscopy. The Fresnel transformation of biological microorganisms is recorded by SEOL holographic microscopy interfaced by computer. The complex-magnitude 3D image of the biological micro-object is reconstructed numerically. A number of serial section images of biological microorganisms are produced from the digital hologram. These section images can be digitally reconstructed along the longitudinal direction by inverse Fresnel transformation. For the volumetric 3D recognition, the multivariate probability density function (MPDF) is calculated22 from the sample segment features of the volume image, and multivariate statistical tests are performed to compare the parameters of populations. Multivariate statistical analysis enables us to explore the joint relationship among multiple variables from the volumetric 3D image, determine the contribution of each variable in the presence of the other variables, and perform the number of possible hypotheses because of many statistical parameters,22 which can improve the discrimination performance between two data sets. We compare classification of microorganisms using a volumetric 3D image with one section image. The multivariate statistical approach is robust to changes in the shapes of the biological microorganisms. Frameworks for the proposed approaches are presented in Fig. 1 . The following sections describe various stages of the proposed approach for the volumetric 3D sensing and recognition of biological microorganisms by using SEOL digital holography. In Sec. 2, the design procedure for volumetric 3D sensing and recognition of microorganisms is described. Statistical multivariate analysis and maximum likelihood estimation for the multivariate statistical inference are explained in Sec. 3. Preliminary experimental results using SEOL holographic microscopy and our conclusion are given in Sec. 4 and Sec. 5, respectively. 2.Proposed Design Procedure for Volumetric 3D Recognition of MicroorganismsIn the following, we describe the design procedure for a volumetric 3D sensing and recognition system of microorganisms using digital holography.1, 2, 3 First, we record SEOL holograms of the microorganisms of interest, as shown in Fig. 2 . We then reconstruct the corresponding biological microorganism as a volume image that consists of section images from a SEOL digital hologram in the Fresnel domain (see Fig. 3 ). The intensity interference pattern of the biological microorganisms at the CCD plane can be represented as follows: where the reference beam’s intensity can be obtained by one-time measurement in the experiment, and the object beam’s intensity can be approximately obtained by using the local window’s averaging method.Fig. 3Design procedure for real-time volumetric 3D sensing and recognition of biological microorganisms. The random sample vector is extracted in the reconstructed volume image from the SEOL digital hologram.  The 3D reconstruction of the original biological microorganism is performed computationally by using the following Fresnel propagation algorithm from the SEOL digital hologram: where means a convolution, and is the distance between the CCD plane (hologram plane) and the image plane. Equation 2 can be transformed into a spatial frequency domain as follows:where and denote transverse discrete spatial frequencies, and means inverse Fourier transform. The Fresnel propagation algorithm in Eq. 3 enables us to generate the 3D diffraction volume with the transverse resolution equal to that in the digital hologram because the scale factor between the hologram plane and the object plane is canceled.Real-time sensing and recognition can be achieved by SEOL holography, which requires a single exposure for 3D recording and development in specialized hardware or parallel processing for the fast Fourier transformation (FFT), which is , where is the total number of pixels in the hologram. For volumetric 3D recognition, we randomly select test pixel points in the segmented section image and extract pixel values of each section image at the test pixel points. The image segmentation can be automatically performed by the following actions:
We repeat the preceding steps times to reduce statistical data fluctuation and obtain averaged statistical data and produce sample vectors consisting of pixel values, where we denote the pixel values in the ’th sample vector as . We can extend the sample vectors with different specimens of the same microorganism. This process can be automatically performed on the computer after using the image segmentation algorithm. This idea can be efficiently used for sensing and classification of biological microorganisms such as bacteria and biological cells that are similar, unicellular, and branched in shape and profile. To test our volumetric 3D sensing system, we similarly produce sample vectors corresponding to an unknown input sample to be classified. The vectors consist of pixel values, where we denote the pixel values in the ’th sample vector as . 3.Statistical Multivariate Analysis and Maximum Likelihood EstimationIn the following, we apply multivariate statistical estimation and inference22, 23, 24 to the real-time volumetric 3D recognition system. From SEOL holographic microscopy, a number of serial section images of biological microorganisms can be produced. These section images are digitally reconstructed along the longitudinal direction by the Fresnel transformation and contain information about how the wave is diffracted. Therefore, we can obtain a number of diffraction patterns of a microorganism at different depths that provide us with information for recognizing biological microorganisms. Using the histogram analysis of these section images, we assume that the distribution of the pixel values of each section image has approximately normal distribution.18 For volumetric 3D sensing and classification of biological microorganisms, multivariate normal distribution can be mathematically modeled on all the section images. The parameters of the joint probability density function are calculated by using the method of maximum likelihood estimation. One of the advantages of a multivariate statistical method is that the number of possible hypotheses is very large because of the large number of parameters. Let be a -variate normal random variable with joint PDF given by: where ()′ denotes the transpose, is the vector mean, is the covariance matrix, and is -dimensional random vector.For volumetric 3D sensing of biological microorganisms, we conduct multivariate statistical tests for the equality of the -dimensional mean vectors and covariance matrices [ parameters] of two populations. First, to compare the -dimensional mean vectors, we assume that two independent random samples and are drawn from and , which are statistical distributions of reference microorganisms and unknown input microorganisms, respectively. All three statistical parameters are unknown, and , where we use sample data accepted with statistical testing for equality of two covariance matrices. The likelihood ratio approach can be used for the statistical test to check the equality of the -dimensional mean vectors and covariance matrices between reference and unknown input populations. The likelihood function that is the product of the joint density of observations is defined22, 23 as: The assumption of the equality of -dimensional mean vectors can be stated as a null hypothesis to be tested. Under , the likelihood function can be maximized by: where and are and , respectively, and . The maximum likelihood estimators of the -variate normal probability density function with can be given by:The likelihood ratio is then given23 by:where , a pooled estimator of the covariance matrix, , and the variable has the Hotelling distribution. For the statistical decision about the equality of -dimensional mean vectors between the two populations on the basis of the sampling distribution information, we can reject the null hypothesis if the statistics with critical values.To compare covariance matrices, the assumption of equality of covariance matrices can be stated as a null hypothesis to be tested. Similarly, under , the likelihood function can be maximized by: The maximum likelihood estimators of -variate normal probability density function can be given by:We can then obtain the likelihood ratio as follows:The estimators in Eq. 11 are biased. To obtain the unbiased version of the likelihood ratio, we can modify likelihood ratio LR 22 as follows:where is the pooled estimator of the covariance matrix. It is known that the statistics with the following Box transformation has an approximate distribution with degrees of freedom:22 whereFor the statistical decision about the equality of the covariance matrices between the two populations on the basis of the sampling distribution information, we can reject the null hypothesis if the statistics with critical values. 4.Experimental ResultsWe show experimental results of the image formation of two biological microorganisms (oscillatoria cyanobacteria and diatom alga) using SEOL digital holography and identify them by their morphological characteristics and diffracted wave patterns with multivariate statistical estimation and inference. 4.1.Volume Image of Microorganisms from SEOL Digital HologramIn the following subsection, we present the visualization of microorganisms using SEOL digital holography. In the experiments, the microorganisms were around several in size. They were recorded using a SEOL digital hologram with a CCD array of pixels and a pixel size of , where the specimen was sandwiched between two transparent cover slips. Figure 4a and 4b shows the oscillatoria and diatom images reconstructed at a distance of by the SEOL digital hologram, which was used to test our recognition system. Figure 5 shows the section images of diatom reconstructed from the single digital hologram at distances , 315, 345, and , respectively. The volumetric 3D image of biological microorganisms can be obtained with these section images. 4.2.Volumetric 3D Recognition by Multivariate Statistical Estimation and InferenceIn the following subsection, we evaluate the performance of our real-time volumetric 3D recognition system using SEOL digital holography. First, we obtained eight section images at different planes along the longitudinal direction from the single SEOL hologram, where the section images were reconstructed at intervals of from the distance to . The 16-variate random sample vector was then selected from the real and imaginary parts in the eight section images; for example, and are random samples from the real part and the imaginary part in the first section image, respectively. Finally, we produced 100 trial sample vectors from the oscillatoria volume image as the reference data sets to reduce a statistical fluctuation, where we changed the size of trial sample vectors from 10 to 200 and removed the background of the reconstructed image by image segmentation25 for more efficient recognition. Similarly, we produced 100 trial sample vectors from the oscillatoria volume image as the true-class inputs and in the diatom volume image as the false-class inputs, respectively. In order to more practically measure the similarity or dissimilarity between two data sets (reference and input), we randomly selected the test pixel points from the same specimen as a reference for true-class 1 and from a different specimen of the same microorganism for true-class 2. Figure 6 shows the experimental results of the Box M-test to measure the equality of the covariance matrices between the reference and the input sample vectors versus the sample size, where the 16-variate random sample vector was used and the percentage of correct matched sample vectors was calculated. For a statistical decision, we rejected the null hypothesis in the case that the statistic defined in Eq. 13 was greater than , which is the critical value of chi-square distribution at level of significance 1/10,000. It is noted that the percentages of the correct matched sample vector by the decision rule for true-class 1 and 2 were around 100% and above 80%, respectively, while for the false-class, the percentage rapidly decreased as a sample size increases. True-class 2 had a slightly different statistical distribution compared to the reference. Therefore, the percentage of correctly matched sample patches went down slightly as the sample size increased. Fig. 6Experimental results of the Box M-test for the equality of the covariance matrices between the reference and input sample vectors versus the sample size. Sixteen-variate random sample vectors from the volumetric 3D image were tested.  To compare the classification of microorganisms using a volumetric 3D image with one section image, we similarly conducted the Box M-test using the bivariate data set that consists of the real and imaginary parts in the well-focused one-section image. Figure 7 shows the experimental results of the Box M-test to measure the equality of the covariance matrices between the reference and the input sample vectors versus the sample size, where a bivariate random sample vector was used and the percentage of correct matched sample vectors was calculated. For a statistical decision, we rejected the null hypothesis in the case that the statistic defined in Eq. 13 was greater than , which is the critical value of chi-square distribution at level of significance 1/10,000. It is noted that the percentages of the correct matched sample data by the decision rule for true-class 1 and 2 were around 100%, while for the false-class, the percentages were above 60%. It is shown in Fig. 6 and Fig. 7 that the statistical discrimination performance can be improved by the volumetric 3D image. Fig. 7Experimental results of the Box M-test for the equality of the covariance matrices between the reference and input sample vectors versus the sample size. Two-variate random sample vectors from one section image (well-focused image) were tested. 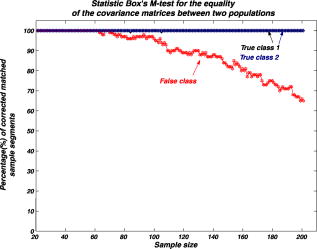 The Box M-test to measure the equality of covariance matrices between the true-class and the false-class of the microorganism by using 16 variables gave rise to much better discrimination than by using 2 variables. We also measured the intercorrelations among each variable22 by: where is the number of variables and are all the eigenvalues of a correlation matrix. If the in Eq. 14 is equal to 1, all of the variables are perfectly correlated. The experimental results are shown in Fig. 8 . It is noted that the measured value was around 0.3 for the oscillatoria bacteria and around 0.7 for the diatom alga. This indicates that there is a considerable intercorrelation among each variable in the multiple section images.Fig. 8Experimental results of measuring intercorrelation among a set of variables versus the sample size. 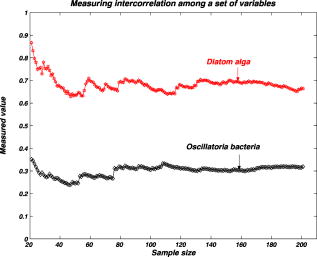 Figure 9 shows the results of the Hotelling -test for the difference of the location vectors between the reference and input sample vectors, where we rejected the null hypothesis in the case that the statistic Hotelling defined in Eq. 8 was larger than , which is the critical value of the Hotelling distribution at level of significance 1/10,000. We tested only the sample vectors accepted by the Box M-test for equality of two covariance matrices, since the assumption of is necessary for the Hotelling -test. It is noted that the percentages of the correct matched sample vector by the decision rule for true-class 1 and 2 were around 100% and above 80%, while for the false-class, the percentage rapidly decreased as the sample size increased. Fig. 9Experimental results of the Hotelling -test for the equality of the location vectors between the reference and input sample vectors versus the sample size. Sixteen-variate random sample vectors from the volumetric 3D image were tested. 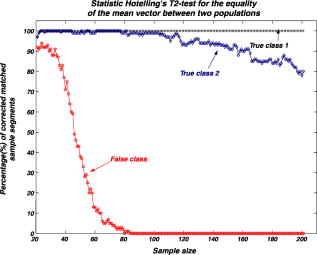 We also conducted the Hotelling -test using bivariate random sample data to compare with the results of the multivariate statistical test. Figure 10 shows the results of the Hotelling -test for the difference of the mean vectors between the reference and input sample data, where we rejected the null hypothesis in the case that the statistic Hotelling defined in Eq. 8 was larger than , which is the critical value of the Hotelling distribution at level of significance 1/10,000, and only the sample vectors accepted by the Box M-test were tested. It is noted that the percentages of the correct matched sample data by the decision rule for true-class 1 and 2 were around 100%, while for the false-class, the percentage rapidly decreased as the sample size increased. These experimental results indicate that there is a larger dissimilarity in the location parameter vectors between the oscillatoria bacteria and the diatom alga. It was more effective to use the Hotelling -test to measure similarity or dissimilarity between the oscillatoria bacteria and the diatom alga. 5.ConclusionIn conclusion, we have presented real-time volumetric 3D sensing and recognition of biological microorganisms using the multivariate statistical estimation and inference algorithms. We optically obtained the Fresnel diffraction intensity pattern of biological microorganisms by use of digital holographic microscopy and then digitally reconstructed many section images or diffraction patterns of biological microorganisms at different planes along the longitudinal direction from the digital hologram. For volumetric 3D sensing and recognition, the test pixel points are randomly selected from the segmented section image. The parameters of the joint normal density functions are then calculated from the pixel values of all the section images according to the proposed design procedure. For the statistical decision on the basis of the multivariate sampling distribution information, multivariate hypothesis tests for the equality of the mean vectors and covariance matrices between two populations have been performed. It has been shown in experiments that the discrimination performance to distinguish bacteria or microorganisms can be increased by using a multivariate statistical distribution that consists of a number of section images instead of using only one section image. We have also measured a considerable intercorrelation among each variable from the volumetric 3D image, which must be a substantial factor for the recognition of biological microorganisms. It is obvious that the performance of the discrimination will be enhanced by multiple variables. Digital holography can produce a number of section images along a longitudinal direction. By using only one digital hologram, we can obtain many more variables than we need to classify the microorganisms. The proposed method is independent of shape in recognizing biological microorganisms. Therefore, this technique will be more suitable to sensing and classification of biological microorganisms that look similar in terms of shape or profile. We have shown promising experimental results for the recognition and classification of biological microorganisms by merely adopting the multivariate statistical method and inference algorithms, but a more advanced statistical decision rule can be applied. AcknowledgmentsThis work has been supported by the Defense Advanced Research Projects Agency (DARPA). ReferencesJ. W. Goodman and
R. W. Lawrence,
“Digital image formation from electronically detected holograms,”
Appl. Phys. Lett., 11 77
–79
(1967). https://doi.org/10.1063/1.1755043 0003-6951 Google Scholar
Handbook of Holographic Interferometry, Wiley, VCH (2005). Google Scholar
I. Yamaguchi and
T. Zhang,
“Phase-shifting digital holography,”
Opt. Lett., 22 1268
–1270
(1997). 0146-9592 Google Scholar
B. Javidi and
E. Tajahuerce,
“Three dimensional object recognition using digital holography,”
Opt. Lett., 25 610
–612
(2000). 0146-9592 Google Scholar
Image Recognition and Classification: Algorithms, Systems, and Applications, Marcel Dekker, New York (2002). Google Scholar
Y. Frauel and
B. Javidi,
“Neural network for three-dimensional object recognition based on digital holography,”
Opt. Lett., 26 1478
–1480
(2001). 0146-9592 Google Scholar
E. Tajahuerce,
O. Matoba, and
B. Javidi,
“Shift-invariant three-dimensional object recognition by means of digital holography,”
Appl. Opt., 40 3877
–3886
(2001). 0003-6935 Google Scholar
P. Ferraro,
G. Coppola,
S. Nicola,
A. Finizio, and
G. Pierattini,
“Digital holographic microscope with automatic focus tracking by detecting sample displacement in real time,”
Opt. Lett., 28 1257
–1259
(2003). 0146-9592 Google Scholar
G. Popescu,
L. Deflores, and
J. Vaughan,
“Fourier phase microscopy for investigation of biological structures and dynamics,”
Opt. Lett., 29 2503
–2505
(2004). https://doi.org/10.1364/OL.29.002503 0146-9592 Google Scholar
B. Javidi and
D. Kim,
“Three-dimensional-object recognition by use of single-exposure on-axis digital holography,”
Opt. Lett., 30 236
–238
(2005). https://doi.org/10.1364/OL.30.000236 0146-9592 Google Scholar
P. Ferraro,
S. Grilli,
D. Alfieri,
S. D. Nicola,
A. Finizio,
G. Pierattini,
B. Javidi,
G. Coppola, and
V. Striano,
“Extended focused image in microscopy by digital holography,”
Opt. Express, 13 6738
–6749
(2005). https://doi.org/10.1364/OPEX.13.006738 1094-4087 Google Scholar
J. W. Lengeler,
G. Drews, and
H. G. Schlegel, Biology of the Prokaryotes, Blackwell Science, New York (1999). Google Scholar
M. G. Forero,
F. Sroubek, and
G. Cristobal,
“Identification of tuberculosis bacteria based on shape and color,”
Real-Time Imag., 10 251
–262
(2004). https://doi.org/10.1016/j.rti.2004.05.007 1077-2014 Google Scholar
J. Alvarez-Borrego,
R. R. Mourino-Perez,
G. Cristobal-Perez, and
J. L. Pech-Pacheco,
“Invariant recognition of polychromatic images of Vibrio cholerae 01,”
Opt. Eng., 41 872
–833
(2002). https://doi.org/10.1117/1.1459054 0091-3286 Google Scholar
A. L. Amaral,
M. da Motta,
M. N. Pons,
H. Vivier,
N. Roche,
M. Moda, and
E. C. Ferreira,
“Survey of protozoa and metazoa populations in wastewater treatment plants by image analysis and discriminant analysis,”
Environmetrics, 15 381
–390
(2004). https://doi.org/10.1002/env.652 1180-4009 Google Scholar
S.-K. Treskatis,
V. Orgeldinger,
H. Wolf, and
E. D. Gilles,
“Morphological characterization of filamentous microorganisms in submerged cultures by on-line digital image analysis and pattern recognition,”
Biotechnol. Bioeng., 53 191
–201
(1997). https://doi.org/10.1002/(SICI)1097-0290(19970120)53:2<191::AID-BIT9>3.0.CO;2-J 0006-3592 Google Scholar
T. Luo,
K. Kramer,
D. B. Goldgof,
L. O. Hall,
S. Samson,
A. Remsen, and
T. Hopkins,
“Recognizing plankton images from the shadow image particle profiling evaluation recorder,”
IEEE Trans. Syst., Man, Cybern., Part B: Cybern., 34 1753
–1762
(2004). https://doi.org/10.1109/TSMCB.2004.830340 1083-4419 Google Scholar
J. M. S. Cabral,
M. Mota, and
J. Tramper,
“Image Analysis and Multiphase Bioreactor,”
Multiphase Bioreactor Design, Taylor & Francis, London (2001). Google Scholar
B. Javidi,
I. Moon,
S. Yeom, and
E. Carapezza,
“Three-dimensional imaging and recognition of microorganism using single-exposure on-line (SEOL) digital holography,”
Opt. Express, 13 4492
–4506
(2005). https://doi.org/10.1364/OPEX.13.004492 1094-4087 Google Scholar
I. Moon and
B. Javidi,
“Shape-tolerant three-dimensional recognition of microorganisms using digital holography,”
Opt. Express, 13 9612
–9622
(2005). https://doi.org/10.1364/OPEX.13.009612 1094-4087 Google Scholar
S. Yeom,
I. Moon, and
B. Javidi,
“Real-time 3D sensing, visualization and recognition of dynamic biological micro-organisms,”
Proc. IEEE, 94 550
–566
(2006). https://doi.org/10.1109/JPROC.2006.870691 0018-9219 Google Scholar
Multivariate Statistical Inference and Application, Wiley-Interscience, New York (1998). Google Scholar
Probability and Statistical Inference, Marcel Dekker, New York (2000). Google Scholar
A. Papoulis and
S. U. Pillai, Probability, Random Variables and Stochastic Processes, McGraw-Hill, New York (2002). Google Scholar
R. C. Gonzalez and
R. E. Woods, Digital Imaging Processing, Prentice Hall, New York (2002). Google Scholar
|