

|
|
1.IntroductionOptical imaging is a rapidly evolving imaging modality with potential clinical impact for detecting and diagnosing breast cancer. 1, 2, 3, 4 Diffuse optical spectroscopy provides quantitative functional information based on the absorption and scattering properties of tissue that complements well high-resolution anatomical information obtained from radiographic methods. Tissue parameters derived from optical measurements include the concentration of oxy and deoxyhemoglobin ( and ), lipid and water, as well as the tissue hemoglobin oxygen saturation . These parameters correlate with cancer pathological markers such as angiogenesis, hypoxia, and edema.5 Our group has developed a multimodality instrument that performs simultaneous diffuse optical tomography with x-ray tomosynthesis, and has obtained some promising initial results in imaging angiogenesis related to large breast tumors.6 One notable feature of this system is that optical imaging is performed under mammographic compression. Jiang 7 studied the effect of applying circumferential compression on the breast and found increases in both the total hemoglobin concentration and optical scattering while water content decreased. However, due to significant differences in measurement geometry as well as much lower applied pressures, it is not obvious how their results apply to our imaging system. Thus, we performed a pilot study to assess the change in the physiological parameters of the breast under mammographic-like compression and to also look for dynamic features that could allow us to enhance the diagnostic ability of our optical imaging system. For this purpose, we have recruited 56 healthy volunteers and we have measured the concentration of the hemoglobin species at various compression levels using a frequency domain spectrometer (ISS, Incorporated, Champaign, Illinois) in a same-side reflective configuration. We have also developed an algorithm for extracting the tissue oxygen consumption and volumetric blood flow from the transient changes in hemoglobin oxygen saturation, and we include data for select volunteers. We believe these quantities could become useful biomarkers for the presence of breast cancer. 2.Materials and Methods2.1.Experimental DesignFigure 1 shows a schematic of the breast compression spectroscopy system. A computer-controlled translation stage applies between 0 and of compression to the subject’s breast by means of two plastic compression plates. The upper plate is attached to the translation stage by means of two strain gages to allow force measurement, while the lower plate is table mounted on a support, and contains the various light delivery and collection fibers. Fig. 1Experimental setup. A computer-controlled translation stage applies compression to a subject’s breasts while frequency domain optical measurements are acquired through one source and three detector fibers. Force transducers are integrated into the compression frame for monitoring.  The near-infrared measurements were performed with a frequency-domain tissue spectrometer (model 96208, ISS, Champaign, Illinois). This instrument uses four parallel photomultiplier tube detectors that are time shared by eight multiplexed laser diodes emitting at 635, 670, 691, 752, 758, 782, 811, and , respectively. The frequency of intensity modulation is , and heterodyne detection is performed with a cross-correlation frequency of . A complete acquisition cycle over the eight wavelengths is completed every . The laser diodes and the photomultiplier tubes are all coupled to fiber optics. The eight individual illumination fibers, each in internal diameter, are arranged into a fiber bundle having a rectangular cross section of . The collecting circular fiber bundles are in internal diameter. The optical fibers are placed in contact with the breast by means of a plastic plate. As shown in Fig. 2 , the tips of the illuminating and collecting fiber bundles are arranged along a line, from the edge of the plate, with three collecting fiber bundles at distances of 1.5, 2.0, and from the single illuminating bundle. Fig. 2Optical probe. The detector fiber bundles (D) are placed 1.5, 2.0, and away from the source fiber bundle (S, individual fibers shown as tiny circles), respectively. All fibers are arranged in a line parallel to the edge of the bottom plate of the compression system, approximately away from the chest wall.  2.2.Human Subject ProtocolOur Institutional Review Board (IRB) approved protocol called for the volunteer’s breast to be placed in contact with the lower plate of the compression system with her chest wall resting against the edge of the plate. The upper plate is then brought down until it just makes contact with the breast. Baseline optical properties are recorded for 30 to , then of force are applied and the position is held for , after which the force is increased to and the optical properties are acquired for another to . The upper plate is then moved up until all compression has been released and the entire cycle is repeated a total of 3 to 5 times. If the subject agreed, a four-step cycle was also used, containing 0-, 3-, 6-, and force plateaus (holding for at each force level) to more closely simulate the effects of mammographic compression (generally quoted to equal approximately of force). We chose these lower compression levels instead of full mammographic compression to improve subject compliance/accrual. Subjects were selected among healthy volunteers, more than 21 years old, with no open wounds on breast, breast implants, or breast biopsy within 3 months prior to participation in the study. The age range was 22 to 60 years old with an average of 30 years of age and standard deviation of 10 years. 2.3.Spectroscopy Data ProcessingThe tissue optical absorption and scattering coefficients are derived from the frequency domain measurements using a multidistance fitting algorithm as described in Refs. 8, 9. The dependence on the source detector separation of the measured DC and AC components as well as the phase of the diffusely reflected light is predicted by diffusion theory as follows:9 where , , and are the slopes characterizing the relationship between the source-detector separation and , , and , respectively. , , and are constants independent of . Again, from diffusion theory (if ):8 where is the modulation frequency of the light sources and is the speed of light in tissue. The calculated from Eq. 4 are then corrected for water absorption: . We assumed a value of 0.3 for the water fraction in breast tissue .5, 10, 11To determine the oxy- and deoxyhemoglobin concentrations, we assume that , or in matrix form: where is the vector containing the water-corrected absorption coefficient values, is a vector reflecting the concentration of the hemoglobin species, and is a matrix containing the absorption spectra of the hemoglobin species at the measurement wavelengths. Finally, by inverting Eq. 6 we obtain:2.4.Oxygen Consumption and Blood Flow EstimationEvery molecule of hemoglobin carries four molecules of oxygen, thus a mass balance for oxygenated hemoglobin within the measurement volume can be written as follows: where is the molar amount of oxygenated hemoglobin inside the measurement volume, is the oxygen consumption (in moles ) within the measurement volume, is the volumetric blood flow into the measurement volume (in L/second), is the total blood hemoglobin concentration in the bood circulating through the tissue (i.e., as opposed to which is the total hemoglobin concentration in the entire tissue volume sampled by the diffuse photons), is the oxygen saturation of arterial blood (incoming), and is the oxygen saturation of venous blood (outgoing). Here we assumed that blood inflow is equal to blood outflow (i.e., constant blood volume—this assumption is not always valid, but it applies to a significant number of our measurements). Dividing Eq. 8 by the tissue volume sampled by the spectrometer , we obtain:Assuming the measured tissue oxygen saturation is the average of and , and further noting that remains constant, we can rewrite Eq. 9 as: The general solution to Eq. 10 is: where is an integration constant. Subject to the initial condition that is equal to the measured tissue at , the particular solution to Eq. 10 can be written as:By fitting Eq. 12 to time-resolved tissue oxygenation measurements, the parameters and can be estimated (oxygen consumption and blood flow per unit tissue volume). Before this can be accomplished, however, assumptions for the values of and need to be made. In our analysis, we assumed , which is generally regarded as a normal value for arterial blood oxygenation in a healthy person. The choice of a value for is more complex. Normal systemic hemoglobin concentration values are 120 to for females.12 However, the blood in the region probed by our spectrometer is dominantly contained in capillary vessels, whose hematocrit values are known to be 2 to 5 times lower than the systemic hematocrit13 (due to the Fahraeus effect). For the purposes of this study, we assumed a value of for systemic hemoglobin concentration and a three times dilution factor in the capillaries, resulting in a value of for . 3.ResultsFigure 3 shows a representative recording of the total hemoglobin content acquired during two consecutive compression cycles for a 30 year old woman with a body mass index (BMI) of 25. The shading in the figure indicates the force plateaus. There is a notable drop in total hemoglobin concentration, most of which occurs in going from 0 to of force. As shown in Table 1 , when averaged over the entire patient set, a drop of in HbT (mean standard deviation) is noted to correspond to applying of force, with a further drop of resulting from increasing compression to the level. For five subjects that agreed to be tested at of compression, an extra 5% decrease in HbT was observed in going from 6 to of force. Fig. 3Sample total hemoglobin concentration ([HbT]) recording. The shading indicates the compression plateaus. The [HbT] decreases proportionally to the amount of force applied.  Table 1Changes in total hemoglobin concentration averaged over all measurements. Only five subjects tested at 12lbs of force.
Figure 4 shows a total hemoglobin recording illustrating another physiological effect of breast compression: hyperemia. As can be seen in the figure, upon releasing compression after the first cycle, [HbT] does not simply return to the baseline level but rather significantly exceeds it. The overshoot in [HbT] continues to increase in later cycles and in the end stabilizes at approximately 25% beyond the initial baseline [HbT]. This hyperemic effect was observed in 35% of the subjects, with an average HbT overshoot of 11%. Fig. 4Example of reactive hyperemia during repeated compression cycles. The shading indicates the compression force. The peak total hemoglobin content increases from cycle 1 through cycle 4, then plateaus.  Figure 5 shows a time-resolved measurement of the hemoglobin oxygen saturation for the same subject as Fig. 3. While is relatively constant when no pressure is applied, it decreases during the compression plateaus, suggesting blood flow has been at least partially occluded and the tissue oxygen consumption exceeds oxygen delivery. Upon compression relief, returns to the precompression value, but does so more slowly than the recovery in HbT levels. Fig. 5Hemoglobin oxygen saturation recording. decreases during compression due to reduced blood flow in the presence of sustained tissue oxygen consumption.  As shown in Fig. 6 , optical scattering also changes during breast compression and generally mimics the changes in [HbT], suggesting a correlation between the two physiological parameters. Fig. 6Recording of the reduced scattering coefficient at . The shading indicates the compression force. decreases during compression.  Finally, we used the time-resolved profile from the 6-lbs compression step for ten subjects where the compression plateau lasted for to estimate the volume-normalized blood flow and oxygen consumption. Figure 7 shows an example fit to the measured profile using Eq. 11. The small oscillations in are probably artifacts caused by the cardiac cycle and serve as proof that blood flow has not ceased due to compression. Table 2 summarizes the oxygen consumption and blood flow findings. Average blood flow was , while average oxygen consumption was . Fig. 7Sample fit using Eq. 11. The solid line is the model prediction, while the dotted line is the experimental recording. The small oscillation in is probably caused by the cardiac cycle. 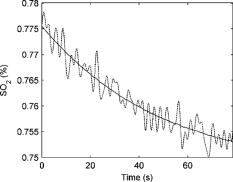 Table 2Volume normalized blood flow and oxygen consumption for ten subjects during 90-s , 6lbs compression plateaus.
4.DiscussionIn the past, concerns have been raised that optical imaging under mammographic compression might be affected by depletion of the blood in breast tissues. From our results we can estimate that at least 50 to 70% of the initial blood volume should still be present in tissue at mammographic compression , which should allow for effective optical tomography. In fact, we could speculate that a higher percentage of the blood volume would be retained inside a tumor in comparison with the surrounding tissue because of the higher interstitial pressure of malignant lesions;14 thus compression could actually enhance the tumor/normal tissue contrast. A hyperemic effect was noted in many of the subjects, in which the total hemoglobin concentration rose above its initial level on release of compression. Only very weak correlations could be found between the strength of the hyperemic effect and the subject’s body mass index, age, or day of menstrual cycle, but it is possible that the strength or time scale of hyperemia will be different in the presence of tumors/lesions. As mentioned in the previous section, the hemoglobin oxygen saturation steadily decreases in all subjects during the compression plateaus. By modeling this decrease for the simplified case of constant , we were able to obtain quantitative measures for the normalized blood flow and oxygen consumption within the measurement volume. To our knowledge, these are the first absolute measurements of breast tissue oxygen consumption (OC) and volumetric blood flow (BF) by optical methods. Beaney 15 have measured the regional blood flow and oxygen consumption in patients with breast carcinoma by means of the oxygen-15 steady-state inhalation technique and positron emission tomography (PET). They noted an average BF of and an average OC of for normal breast tissue. Another PET study by Wilson 16 reported an estimated blood flow of . Our values are approximately three and ten times lower, respectively, for BF and OC. We believe most of the difference is explained by the difference in measurement geometry—the PET study measured the more metabolically active central area of the breast, while our measurements are limited to the most superficial of tissue, where a significant fat content leads to lower oxygen consumption estimates,17 while at the same time the compression applied to the tissue has lead to decreased blood flow. It is worth noting that in the PET study, breast tumors were found to have 4.7 times higher BF and 1.5 times higher OC than normal breast tissue. This leads us to believe that the tissue metabolic state will prove to be a highly specific marker for breast cancer. As shown in Fig. 8 , from the optical scattering measurements a certain degree of correlation has been found between the change in and the change in the total hemoglobin concentration. However, the data suggest a change of in for every of HbT, which in turn would indicate that blood is responsible for approximately half of the tissue scattering. This is not realistic and in fact is contradicted by previously published results.18 Therefore, other tissue components that co-vary with HbT during compression must account for the additional scattering changes, such as water and lipid concentration. To quantify changes in these components, the wavelength range of our spectroscopic system needs to be extended further into the infrared, a future focus for our work. 5.ConclusionsWe show that breast compression leads to changes in the total hemoglobin content as well as hemoglobin oxygen saturation and tissue scattering. From the steady decrease in hemoglobin saturation observed during compression plateaus, we are able to extract quantitative estimates of the tissue metabolic state that have the potential to aid cancer detection. While changes in breast optical properties during compression are significant, we do not expect them to impede tomographic optical imaging once taken into account. Furthermore, the compression-induced dynamic features of the optical/physiological property changes as well as the tissue oxygen consumption will likely be different in the presence of cancer pathology and should provide useful diagnostic information. AcknowledgmentsWe acknowledge Dana Brooks and Dibo Ntuba for useful discussions, as well as funding under the National Institutes of Health (NIH) grants R01-CA97305 and U54-CA105480. ReferencesB. W. Pogue,
S. P. Poplack,
T. O. McBride,
W. A. Wells,
K. S. Osterman,
U. L. Osterberg, and
K. D. Paulsen,
“Quantitative hemoglobin tomography with diffuse near-infrared spectroscopy: pilot results in the breast,”
Radiology, 218 261
–266
(2001). 0033-8419 Google Scholar
J. C. Hebden,
H. Veenstra,
H. Dehghani,
E. M. C. Hillman,
M. Schweiger,
S. R. Arridge, and
D. T. Delpy,
“Three-dimensional time-resolved optical tomography of a conical breast phantom,”
Appl. Opt., 40 3278
–3287
(2001). 0003-6935 Google Scholar
H. Jiang,
Y. Xu,
N. Iftimia,
J. Eggert,
K. Klove,
L. Baron, and
L. Fajardo,
“Three-dimensional optical tomographic imaging of breast in a human subject,”
IEEE Trans. Med. Imaging, 20 1334
–1340
(2001). https://doi.org/10.1109/42.974928 0278-0062 Google Scholar
R. Barbour,
H. Graber,
Y. Pei,
S. Zhong, and
C. Schmitz,
“Optical tomographic imaging of dynamic features of dense scattering media,”
J. Opt. Soc. Am. A, 18 3018
–3036
(2001). 0740-3232 Google Scholar
N. Shah,
A. E. Cerussi,
D. Jakubowski,
D. Hsiang,
J. Butler, and
B. J. Tromberg,
“The role of diffuse optical spectroscopy in the clinical management of breast cancer,”
Dis. Markers, 19 95
–105
(2003, 2004). 0278-0240 Google Scholar
Q. Zhang,
T. J. Brukilacchio,
A. Li,
J. J. Stott,
T. Chaves,
T. Wu,
M. Chorlton,
E. Rafferty,
R. H. Moore,
D. B. Kopans, and
D. A. Boas,
“Coregistered tomographic x-ray and optical breast imaging: initial results,”
J. Biomed. Opt., 10 024033
(2005). https://doi.org/10.1117/1.1899183 1083-3668 Google Scholar
S. D. Jiang,
B. W. Pogue,
K. D. Paulsen,
C. Kogel, and
S. P. Poplack,
“In vivo near-infrared spectral detection of pressure-induced changes in breast tissue,”
Opt. Lett., 28 1212
–1214
(2003). 0146-9592 Google Scholar
S. Fantini,
M. A. Franceschini,
J. B. Fishkin,
B. Barbieri, and
E. Gratton,
“Quantitative determination of the absorption spectra of chromophores in scattering media: a light-emitting-diode based technique,”
Appl. Opt., 33 5204
–5213
(1994). 0003-6935 Google Scholar
S. Fantini,
M. A. Franceschini, and
E. Gratton,
“Semi-infinite-geometry boundary problem for light migration in highly scattering media: a frequency-domain study in the diffusion approximation,”
J. Opt. Soc. Am. B, 11 2128
–2138
(1994). 0740-3224 Google Scholar
D. R. White,
H. Q. Woodard, and
S. M. Hammond,
“Average soft-tissue and bone models for use in radiation dosimetry,”
Br. J. Radiol., 60 907
–913
(1987). 0007-1285 Google Scholar
H. Q. Woodard and
D. R. White,
“The composition of body tissues,”
Br. J. Radiol., 59 1209
–1219
(1986). 0007-1285 Google Scholar
R. Berkow,
M. H. Beers,
R. M. Bogin, and
A. J. Fletcher,
“Common medical tests,”
The Merck Manual of Medical Information (Home Edition), 1375
–1376 Merck Research Laboratories, Whitehouse Station, NJ (1997). Google Scholar
C. Desjardins and
B. R. Duling,
“Microvessel hematocrit: measurement and implications for capillary oxygen transport,”
Am. J. Physiol. Heart Circ. Physiol., 252
(3), H494
–H503
(1987). 0363-6135 Google Scholar
S. D. Nathanson and
L. Nelson,
“Interstitial fluid pressure in breast-cancer, benign breast conditions, and breast parenchyma,”
Ann. Surg. Oncol., 1
(4), 333
–338
(1994). 1068-9265 Google Scholar
R. P. Beaney,
A. A. Lammertsma,
T. Jones,
C. G. McKenzie, and
K. E. Halnan,
“Positron emission tomography for in-vivo measurement of regional blood flow, oxygen utilisation, and blood volume in patients with breast carcinoma,”
Lancet, 8369
(1), 131
–134
(1984). 0140-6736 Google Scholar
C. B. J. H. Wilson,
A. A. Lammertsma,
C. G. McKenzie,
K. Sikora, and
T. Jones,
“Measurements of blood-flow and exchanging water space in breast-tumors using positron emission tomography—a rapid and noninvasive dynamic method,”
Cancer Res., 52
(6), 1592
–1597
(1992). 0008-5472 Google Scholar
M. Niwayama,
T. Hamaoka,
L. Lin,
J. Shao,
N. Kudo,
C. Katoh, and
K. Yamamoto,
“Quantitative muscle oxygenation measurement using NIRS with correction for the influence of a fat layer: comparison of oxygen consumption rates with measurements by other techniques,”
Proc. SPIE, 3910 256
–265
(2000). https://doi.org/10.1117/12.384911 0277-786X Google Scholar
L. A. Paunescu,
A. Michalos,
J. H. Choi,
U. Wolf,
M. Wolf, and
E. Gratton,
“In vitro correlation between reduced scattering coefficient and hemoglobin concentration of human blood determined by near-infrared spectroscopy,”
Proc. SPIE, 4250 319
–326
(2001). https://doi.org/10.1117/12.434505 0277-786X Google Scholar
|


