|
|
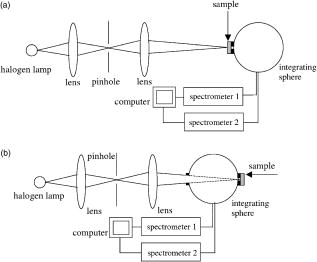
1.IntroductionNonmelanoma skin cancers, including basal cell carcinomas (BCCs) and squamous cell carcinomas (SCCs), are more common than all other types of human cancers. These cancers have an intrinsically low optical contrast in the visible spectral range. A number of techniques 1, 2, 3, 4, 5, 6, 7 and contrast agents8, 9, 10 have been suggested and tested for the detection and delineation of these tumors. So far the best results were yielded with methods that employ exogenous contrast agents.11, 12 However, if a method capable of resolving subtle differences in the optical properties of endogenous chromophores of normal and cancerous tissues was available, this would be a great asset for tumor detection. Thus far, to the best of our knowledge, the optical properties of nonmelanoma skin cancers have not been reported so far. The optical properties of normal skin have been investigated by several groups.13, 14, 15 However, most of the investigators studied either the optical properties of dermis and subcutaneous fat,16 or reported on the combined optical properties of epidermis and dermis.17, 18 Data on the optical properties of epidermis are rare.19 In this study, we have determined and compared the optical properties of normal skin layers to those of nonmelanoma skin cancers in the wide spectral range from with the purpose of selecting the spectral range where the differences between cancer and normal tissue are maximal. We employed integrating sphere spectrophotometry combined with the inverse Monte Carlo technique. At least five samples of each tissue type, including epidermis, dermis, subcutaneous fat, nodular BCC, infiltrative BCC, and invasive SCC, were measured. The resulting optical properties of different tissue types were compared. The differences in scattering and absorption between each normal and cancerous tissue type were statistically analyzed using an unpaired two-tailed -test, and the spectral ranges where these differences were maximal identified. 2.Materials and Methods2.1.Sample PreparationFreshly discarded specimens of normal and cancerous human skin were obtained from the surgeries under an institutional review board–approved protocol. The time between the surgical removal of the skin and the measurements did not exceed . Skin excisions from the face, scalp, neck, and back of the patients were used for the experiments. The samples were briefly rinsed in Dulbecco’s phosphate-buffered saline (pH 7.4) solution and sectioned using a microcryotome. Sections were cut parallel to the tissue surface. We measured the thickness of each section using a high-precision digital micrometer (Mitutoyo Corp., Kawasaki, Japan) with the accuracy of . The thickness of the epidermis, dermis, fat, and cancerous tissues sections varied between 60 and , 100 and , 280 and , and 170 and , respectively. The lateral size of the sectioned tissues was in the range. Sectioned specimens were hydrated with saline and sealed between a microscopic slide and a coverslip with rapid mounting media for microscopy Entellan New (Electron Microscopy Science, Hatfield, Pennsylvania) to prevent desiccation. In total, 7 epidermis, 8 dermis, 10 subcutaneous fat, 6 infiltrative BCC, 5 nodular BCC, and 8 SCC specimens were investigated. 2.2.Integrating Sphere SpectrophotometryThe integrating sphere spectrophotometric system was constructed for the diffuse reflectance and total transmittance measurements of skin specimens. The experimental arrangements are presented in Figs. 1a and 1b . We have chosen a single-integrating sphere configuration to avoid light interactions between the spheres.20 For measuring total transmittance and diffuse reflectance, the light from a halogen lamp (HL-2000-HP-FHSA, Ocean Optics, Dunedin, Florida) was focused onto the sample, which was mounted on the entrance and exit ports of the integrating sphere (4P-GPS-033-SL, Labsphere, North Sutton, New Hampshire), respectively. The lateral size of the investigated sample always exceeded the diameter of the respective sphere port. The diameter of the beam on the sample did not exceed . For the samples with lateral sizes between 6 and , the size of the beam was reduced to . The light diffusely reflected and transmitted by the sample was detected by two charge-coupled device–based spectrometers connected via the optical fibers to the detector ports. We have used a HR2000 spectrometer (Ocean Optics) in the region and an EPP2000-NIR InGaAs spectrometer (StellarNet, Tampa, Florida) in the spectral range. The wavelength calibration of the spectrometers was performed using a Hg(Ar) calibration lamp (HG-1 Mercury Argon Calibration Source, Ocean Optics) with an accuracy better than . For all the measurements, a signal-to-noise ratio was not worse than 200:1. To ensure that the same area of the sample was examined, all the slides were marked with a perma-nent marker around the investigated area during the first measurement. 2.3.Confocal ImagingTo verify that the skin specimens contained only one type of tissue (i.e., epidermis, dermis, fat, or cancer), each section was imaged using reflectance confocal microscopy. The exact same area of the sample that corresponded to the region measured during the integrating sphere experiments was examined. The confocal microscope that was used for verification experiments was described in detail elsewhere.5 Confocal images were acquired at the wavelength of . Water immersion objective (Nikon, Japan) was employed. The system provided an axial resolution of , and lateral resolution of . Confocal images were acquired from both the front and the back sides of the samples at a depth of . Single confocal images covered the area of . To identify the tissue type, confocal mosaics were created from sequences of single images of adjacent areas. These mosaics covered an area of . Reflectance confocal microscopy provided high-quality images of the sections. Distinctive features of skin layers can be clearly seen in these images. The samples that contained more than one tissue type were discarded. 2.4.Data Processing TechniqueWe have used an inverse Monte Carlo technique to recover the optical properties of the samples from the measured quantities of diffuse reflectance and total transmittance.21 The technique employs a combination of a quasi-Newton inverse algorithm22 and a forward Monte Carlo simulation.21, 23 The inverse quasi-Newton algorithm is an iterative optimization technique that combines rapid local convergence of the Newton method with the ability to achieve proximity of the solution if the initial approximation is poor. In most practical cases, the algorithm required less than 10 iterations to converge. The forward Monte Carlo method is based on the numerical simulation of photon transport in scattering media. The algorithm takes into account exact optical and geometrical configuration of experiment: mismatch of the refractive indices on the boundaries of the sample, light losses at the edges of the sample, finite beam diameter and port dimensions of the integrating sphere, and arbitrary angular distribution of the incident light. Interpretation of all the experimental data obtained in this study was conducted under the assumption of the Henyey-Greenstein scattering phase function. The anisotropy factor was assumed to be 0.8 and the refractive index to be 1.4 for all the skin layers in the entire spectral range investigated.24, 25, 26, 14 2.5.Statistical AnalysisA Student’s unpaired two-tailed -test (STATISTICA 6.0, StatSoft, Inc, Tulsa, Oklahoma) was used to evaluate the significance of the difference between obtained optical properties of healthy skin layers and cancerous tissues. The differences between optical coefficients of normal and cancerous tissues were considered to be statistically significant when the calculated probability value ( value) was equal or less than 0.05. value means that the probability that the two data sets are different is . This level of significance is considered acceptable for the biological samples. Calculated values were plotted against the wavelength to identify the spectral regions, where the optical properties of normal and cancerous tissues differed significantly. 3.Results and DiscussionIn total, we have measured and analyzed 7 samples of human epidermis, 8 samples of dermis, 10 samples of subcutaneous fat, 5 samples of nodular BCC, 6 samples of infiltrative BCC, and 8 samples of invasive SCC. All the samples were measured in the spectral range from . Averaged absorption and reduced scattering coefficients for each of the examined tissue types were calculated using the inverse Monte Carlo technique. The results are presented in Figures 2, 3, 4, 5, 6, 7, 8, 9, 10, 11 . Fig. 2(a) Optical properties of epidermis. Triangles—reduced scattering coefficients, circles—absorption coefficients, bars—standard errors. Averaged over seven samples. (b) Typical confocal image of epidermis; arrows point to hair follicles.  Fig. 3(a) Optical properties of dermis. Triangles—reduced scattering coefficients, circles—absorption coefficients, bars—standard errors. Averaged over eight samples. (b) Typical confocal image of dermis; gray arrow points to collagen-elastin bundle, black arrow points to sebaceous gland, dashed arrow points to hair shaft.  Fig. 4(a) Optical properties of subcutaneous fat. Triangles—reduced scattering coefficients, circles—absorption coefficients, bars—standard errors. Averaged over 10 samples. (b) Typical confocal image of subcutaneous fat; gray arrows point to fat cells adipocytes, black arrow points to connective tissue septum.  Fig. 5(a) Confocal image of subcutaneous fat sample with dense connective tissue septa separating multilocular adipocytes (the excision was taken from the facial area); (b) confocal image of subcutaneous fat sample without the septa (the excision was taken from the back). Gray arrows point to fat cells adipocytes, black arrows point to connective tissue septum. (c) Scattering properties of subcutaneous fat. Circles—reduced scattering coefficient of fat with dense connective tissue septa, triangles—reduced scattering coefficient of fat without the septa.  Fig. 6(a) Optical properties of infiltrative BCC. Triangles—reduced scattering coefficients, circles—absorption coefficients, bars—standard errors. Averaged over six samples. (b) Confocal image of infiltrative BCC specimen; arrows point to the strands of tumor cells. 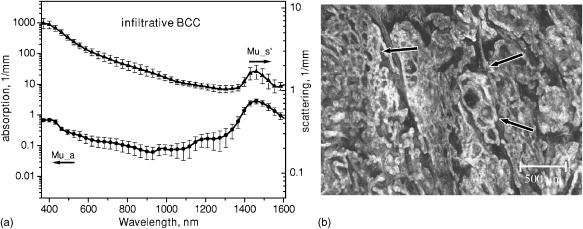 Fig. 7(a) Optical properties of nodular BCC. Triangles—reduced scattering coefficients, circles—absorption coefficients, bars—standard errors. Averaged over five samples. (b) Confocal image of nodular BCC specimen. 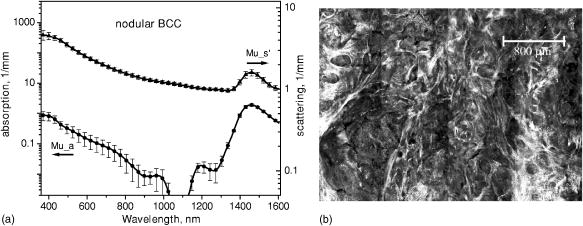 Fig. 8(a) Optical properties of SCC. Triangles—reduced scattering coefficients, circles—absorption coefficients, bars—standard errors. Averaged over eight samples. (b) Confocal image of SCC specimen.  Fig. 9-test results comparing epidermis and cancerous skin absorption (a) and scattering (b) properties. Solid line—comparison of epidermis and infiltrative BCC, dashed line—comparison of epidermis and nodular BCC, dashed dotted line—comparison of epidermis and SCC absorption and scattering properties. 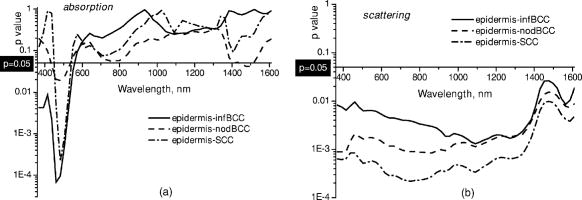 Fig. 10-test results comparing dermis and cancerous skin absorption (a) and scattering (b) properties. Solid line—comparison of dermis and infiltrative BCC, dashed line—comparison of dermis and nodular BCC, dashed dotted line—comparison of dermis and SCC absorption and scattering properties.  Fig. 11-test results comparing subcutaneous fat and cancerous skin absorption (a) and scattering (b) properties. Solid line—comparison of fat and infiltrative BCC, dashed line—comparison of fat and nodular BCC, dashed dotted line—comparison of fat and SCC absorption and scattering properties.  Absorption and scattering coefficients of healthy skin layers are shown in Figs. 2a, 3a, 4a. The graphs demonstrate that the scattering of normal skin layers decreases with the increasing wavelength. The steady decrease can be explained by the decrease of the contribution of Rayleigh scattering, whereas the contribution of Mie scattering increases with the increasing wavelength.27 For all the tissues investigated, we have noticed an increase of scattering coefficient in the vicinity of the strong water absorption band around . Similar behavior of the absorption and scattering coefficients can be seen in the graphs presented in Refs. 28, 29 for human blood, gallbladder, and bile. As experimental conditions and/or models of light propagation used to derive the optical properties in the referenced literature and our work were different, it is more likely that the obtained results manifest the general optical property of the tissues, rather than the evidence of some cross talk between the two parameters in the measurements and calculations. This correlation in the behavior of absorption and scattering may be caused by the existing relation between the real and imaginary parts of the dielectric constant. However, more detailed investigation of the observed phenomenon is required to confirm or refute our hypothesis. The scattering of epidermis is noticeably higher than the scattering of dermis and subcutaneous fat in the entire wavelength range. It is known that optical properties of epidermis in the range of are determined by melanin content.13 For this study, we used excisions taken from Caucasian subjects with fair skin. The content of melanin in the epidermis of these skin samples was comparatively low. However, the relative refractive index of melanin with respect to the surrounding medium is approximately 1.3.30 Therefore, light scattering in the epidermis is significantly higher than in other skin tissues. In the dermis, scattering is predominantly caused by collagen fibers and their associated small structures.31 The irregular bundles of thick collagen and elastin fibers can be clearly seen in the confocal image of the dermis [Fig. 3b, the gray arrow points toward the fibers]. The scattering properties of subcutaneous fat are also affected by the presence of connective tissue septa composed of collagen and elastin. In the confocal image of subcutaneous fat [Fig. 4b], the septum separating conglomerates of fat cells—adipocytes—is shown with black arrows. It was noticed that the scattering properties of fat differed depending on the body area from which the excisions were taken. The collagen-elastin net appeared thicker and denser in the subcutaneous fat samples obtained from the facial or scalp area [Fig. 5a, collagen bundles are shown with black arrows]. The presence of collagen and elastin resulted in increased scattering coefficients [Fig. 5c]. Skin excisions taken from the back of the subjects revealed fat with large multilocular adipocytes and very thin connective tissue septa [Fig. 5b]. In this case, scattering was much lower [Fig. 5c]. Absorption spectra of normal skin layers are presented in Figs. 2a, 3a, 4a. In the visible wavelength range, melanin determines absorption in the epidermis. Absorption of melanin is monotonously decreasing with the increase of the wavelength. Therefore, the effect of melanin on epidermis absorption properties is more pronounced at shorter wavelengths. Hemoglobin dominates absorption properties of dermis and fat in the visible spectral range. Hemoglobin absorption peaks around 410 and appear consistently in the spectra of dermis and fat, as all the specimens, except the epidermal, contained some blood. Absorption of the epidermis, dermis, and fat in the near-infrared region is determined by water and lipid content. In the proximity of , water and lipid absorption bands overlap. Therefore, this peak is more pronounced for the subcutaneous fat as compared to the epidermis and dermis. At the same time, the epidermis and dermis exhibit stronger absorption in the range from . In Figs. 6a, 7a, 8a, absorption and scattering properties of cancerous tissues are presented. Scattering of all investigated nonmelanoma skin tumor types demonstrate qualitatively similar behavior. It gradually decreases with the increasing wavelength. Quantitatively, infiltrative BCC is characterized by a higher scattering coefficient in comparison with the scattering of nodular BCCs and SCCs. The higher scattering coefficient of infiltrative BCC may be explained by its structural characteristics. Typically, these tumors have thin strands or cords of tumor cells extending into the surrounding highly scattering dermis. The scattering of squamous cell carcinomas is consistently lower than the scattering of both types of BCCs in the entire wavelength range. Absorptive properties of nonmelanoma skin cancers are determined by melanin and hemoglobin in the visible spectral range and by water in the near-infrared spectral range. Depositions of melanin often occur in the nonmelanoma tumors.10 The presence of this chromophore strongly affects absorption and scattering of the tumors. However, in general, the content of both melanin and hemoglobin in nonmelanoma skin cancers is highly variable. Therefore, the contrast based on the differences in melanin and hemoglobin content of the tumors as compared to normal skin tissues cannot be expected to occur reproducibly. We have found that on average, nodular BCCs contain less blood as compared to infiltrative BCCs and SCCs. We also noted that infiltrative BCCs are characterized by a slightly higher absorption than SCCs in the range from . Absorption of nodular BCCs is lower than that of infiltrative BCCs and SCCs. We used statistical analysis to evaluate the significance of the differences between optical properties of normal skin layers and cancerous tissues. The analysis was performed using unpaired two-tailed -tests. In the resulting plots, the dependences of values on the wavelength are presented. The spectral regions where the differences between cancerous tissues and healthy skin layers were statistically significant can be clearly identified. plots presented in the Figs. 9, 10, 11 show the differences between absorption and scattering properties of the healthy epidermis, dermis, fat, and nonmelanoma skin tumors, respectively. The spectral regions where optical properties of healthy and cancerous tissues differ significantly are listed in the Table 1 . Table 1Spectral regions of maximal optical contrast between normal and cancerous tissues.
In Fig. 9, the plots comparing absorption [Fig. 9a] and scattering [Fig. 9b] of epidermis to those of cancerous tissues are presented. As can be seen in Fig. 9a, the differences in absorption between the epidermis and all the types of cancer investigated are significant below , in the vicinity of the hemoglobin Soret absorption band. As the blood content in cancerous samples is highly variable and may be affected by sample preparation technique, the identified significant differences in absorption are not likely to provide a reliable basis for tissue discrimination. At the same time, the differences in scattering between the epidermal and cancerous tissues were found to be significant in the complete spectral range investigated. plots in Figs. 10a and 10b show the differences in the absorption and scattering properties of the dermis and cancerous tissues, respectively. No significant differences were found in the absorption properties of the dermis and infiltrative BCC. This type of cancer is difficult to detect because, as was mentioned earlier, it is characterized by thin cancer cell strands invading the dermis. Therefore, the optical properties of infiltrative BCC are similar to those of the dermis. The differences in absorption of nodular BCCs and SCCs versus the dermis are significant in the wavelength range from and from , respectively. Absorption in these cancer types was generally lower than in the dermis. plots comparing scattering properties of dermis-tumor pairs reveal that the scattering properties of dermis–nodular BCC and dermis-SCC exhibit significant differences in the complete wavelength range investigated. For infiltrative BCCs, the spectral range of significant differences was much narrower and covered the wavelengths between 1050 and . plots comparing absorption properties of subcutaneous fat and cancerous specimens [see Fig. 11a] demonstrate that for all tumor types there exist significant differences in the regions from and from . These two regions correspond to the absorption bands of blood and water, respectively. Our results indicate that on average, cancerous tissue contains less blood and more water as compared to subcutaneous fat. Differences in scattering properties of subcutaneous fat-tumors pairs are significant for all cancer types in the wavelength range between 1050 and [see Fig. 11b]. The detected differences in the absorption properties of healthy skin-tumor pairs were provided by variations in the concentration of hemoglobin, melanin, and water. It has been reported previously1, 32 that variations in water absorption can be used as a reliable parameter for distinguishing nonmelanoma skin cancers. We also found significant differences in water content in all subcutaneous fat-tumor pairs. Water absorption in fat was consistently lower than that of cancerous specimens. However, other skin layers (i.e., epidermis and dermis) did not differ from cancer in terms of water content. Statistical and comparative analysis of the differences in the optical properties of cancerous and normal skin revealed that all healthy skin layer–tumor pairs exhibited significant differences in scattering in the spectral range between 1050 and . Scattering in cancer specimens was substantially lower as compared to normal skin. At the same time, absorption properties of healthy and cancerous skin, with the exception of nodular BCC, which exhibited significantly lower absorption than that of normal skin, did not differ substantially in this wavelength region. Our results indicate that in the wavelength range between 370 and , there is no spectral region where the differences in absorption are significant for all healthy tissue–cancer pairs. 4.ConclusionsWe have determined and compared absorption and scattering properties of healthy human skin layers and nonmelanoma skin cancers in the wavelength range from . We identified several wavelength regions where the difference in absorption and scattering properties of each healthy tissue–cancer pair were statistically significant . The results of our study indicate that there exists no spectral region within the wavelength range investigated where the differences in absorption are significant for all healthy tissue–tumor pairs simultaneously. However, all healthy tissue–cancer pairs exhibited statistically significant differences in scattering in the wavelength range from . Absorption properties of normal skin layers and cancerous specimens did not differ significantly in this region with the exception of nodular BCC–normal tissue pair. Nodular BCCs exhibit lower absorption as compared to normal skin. Thus the spectral range from , where scattering properties of normal and cancerous tissues exhibit maximal difference, may provide a reliable base for pathology discrimination. ReferencesR. Woodward,
V. Wallace,
R. Pye,
B. E. Cole,
D. D. Arnone,
E. H. Linfield, and
M. Pepper,
“Terahertz pulse imaging of ex vivo basal cell carcinoma,”
J. Invest. Dermatol., 120 72
–78
(2003). https://doi.org/10.1046/j.1523-1747.2003.12013.x 0022-202X Google Scholar
N. Lassay,
A. Spatz,
M. F. Avril,
A. Tardivon,
A. Margulis,
G. Mamelle,
D. Vanel, and
J. Leclere,
“Value of high-frequency US for preoperative assessment of skin tumors,”
Radiographics, 17 1559
–1565
(1997). 0271-5333 Google Scholar
L. M. McIntosh,
M. Jackson,
H. H. Mantsch,
M. F. Stranc,
D. Pilavdzic, and
A. N. Crowson,
“Infrared spectra of basal cell carcinomas are distinct from non-tumor-bearing components,”
J. Invest. Dermatol., 112 951
–956
(1999). https://doi.org/10.1046/j.1523-1747.1999.00612.x 0022-202X Google Scholar
M. Rajadhyaksha,
G. Menaker,
T. Flotte,
P. Dwyer, and
S. Gonzales,
“Confocal examination of nonmelanoma cancers in thick skin excisions to potentially guide Mohs micrographic surgery without frozen histopatology,”
J. Invest. Dermatol., 117 1137
–1143
(2001). https://doi.org/10.1046/j.0022-202x.2001.01524.x 0022-202X Google Scholar
A. N. Yaroslavsky,
J. Barbosa,
V. Neel,
C. DiMarzio, and
R. R. Anderson,
“Combining multispectral polarized light imaging and confocal microscopy for localization of nonmelanoma skin cancer,”
J. Biomed. Opt., 10
(1), 1
–6
(2005). 1083-3668 Google Scholar
S. L. Jacques,
J. C. Ramella-Roman, and
K. Lee,
“Imaging skin pathology with polarized light,”
J. Biomed. Opt., 7
(3), 329
–340
(2002). https://doi.org/10.1117/1.1484498 1083-3668 Google Scholar
S. L. Jacques,
J. C. Ramella-Roman, and
K. Lee,
“Imaging superficial tissues with polarized light,”
Lasers Surg. Med., 26
(2), 119
–129
(2000). https://doi.org/10.1002/(SICI)1096-9101(2000)26:2<119::AID-LSM3>3.0.CO;2-Y 0196-8092 Google Scholar
W. B. Gill,
J. L. Huffman,
E. S. Lyon,
D. H. Bagley,
H. W. Schoenberg, F. H. Straus II,
“Selective surface staining of bladder tumors by intravesical methylene blue with enhanced endoscopic identification,”
Cancer, 53 2724
–2727
(1984). 0008-543X Google Scholar
A. M. Wennberg,
F. Gudmundson,
B. Stenquist,
A. Ternesten,
L. Molne,
A. Rosen, and
O. Larko,
“In vivo detection of basal cell carcinoma using imaging spectroscopy,”
Acta Derm Venereol, 80
(2), 152
(2000). 0001-5555 Google Scholar
Mohs Surgery. Fundamentals and Techniques, Mosby, St. Louis
(1999). Google Scholar
A. N. Yaroslavsky,
V. Neel, and
R. R. Anderson,
“Demarcation of nonmelanoma skin cancer margins in thick excisions using multispectral polarized light imaging,”
J. Invest. Dermatol., 121 259
–266
(2003). https://doi.org/10.1046/j.1523-1747.2003.12372.x 0022-202X Google Scholar
A. N. Yaroslavsky,
V. Neel, and
R. R. Anderson,
“Fluorescence polarization imaging for delineating nonmelanoma skin cancers,”
Opt. Lett., 29
(17), 2010
–2012
(2004). https://doi.org/10.1364/OL.29.002010 0146-9592 Google Scholar
R. R. Anderson and
J. A. Parrish,
“Skin optics,”
J. Invest. Dermatol., 77 13
–19
(1981). https://doi.org/10.1111/1523-1747.ep12479191 0022-202X Google Scholar
S. L. Jacques,
C. A. Alter, and
S. A. Prahl,
“Angular dependence of He-Ne laser light scattering by human dermis,”
Lasers Life Sci., 1 309
–334
(1987). 0886-0467 Google Scholar
S. Prahl,
“Light transport in tissue,”
University of Texas at Austin,
(1988). Google Scholar
C. R. Simpson,
M. Kohl,
M. Essenpreis, and
M. Cope,
“Near infrared optical properties of ex vivo human skin and subcutaneous tissues measured using Monte Carlo inversion technique,”
Phys. Med. Biol., 43 2465
–2478
(1998). https://doi.org/10.1088/0031-9155/43/9/003 0031-9155 Google Scholar
T. Throy and
S. N. Thennadil,
“Optical properties of human skin in the near infrared wavelength range of ,”
J. Biomed. Opt., 6
(2), 167
–176
(2001). https://doi.org/10.1117/1.1344191 1083-3668 Google Scholar
J. D. Hardy,
H. T. Hammel, and
Dorothy Murgatroyd,
“Spectral transmittance and reflectance of excised human skin,”
J. Appl. Physiol., 9 257
–264
(1956). 0021-8987 Google Scholar
S. Wan,
R. R. Anderson, and
J. A. Parrish,
“Analytical modeling for the optical properties of the skin with in vitro and in vivo applications,”
Photochem. Photobiol., 34 493
–499
(1981). 0031-8655 Google Scholar
J. W. Pickering,
S. A. Prahl,
N. van Wieringen,
J. F. Beek,
H. J. C. M. Sterenborg, and
M. J. C. van Gemert,
“Double-integrating sphere system for measuring the optical properties of tissue,”
Appl. Opt., 32 399
–410
(1993). 0003-6935 Google Scholar
I. V. Yaroslavsky,
A. N. Yaroslavsky,
T. Goldbach, and
H.-J. Schwarzmaier,
“Inverse hybrid technique for determining the optical properties of turbid media from integrating-sphere measurements,”
Appl. Opt., 35 6797
–6809
(1996). 0003-6935 Google Scholar
J. E. Dennis and
R. B. Schnabel, Numerical Methods for Unconstrained Optimization and Nonlinear Equations, Prentice-Hall, Englewood Cliffs, NJ
(1983). Google Scholar
A. N. Yaroslavsky,
T. Goldbach,
I. V. Yaroslavsky, and
H.-J. Schwarzmaier,
“Different phase-function approximations to determine optical properties of blood: A comparison,”
Proc. SPIE, 2982 324
–330
(1997). 0277-786X Google Scholar
Laser-Induced Interstitial Thermotherapy, SPIE Press, Bellingham, WA
(1995). Google Scholar
F. A. Duck, Physical Properties of Tissues. A Comprehensive Reference Book, Academic Press, London
(1990). Google Scholar
F. P. Bolin,
L. E. Preuss,
R. C. Taylor, and
R. J. Ference,
“Refractive index of some mammalian tissues,”
Appl. Opt., 28 2297
–2303
(1989). 0003-6935 Google Scholar
A. N. Yaroslavsky,
P. C. Schulze,
I. V. Yaroslavsky,
R. Shober,
F. Ulrich, and
H.-J. Schwarzmaier,
“Optical properties of selected native and coagulated human brain tissues in vitro in the visible and near infrared spectral range,”
Phys. Med. Biol., 47 2059
–2073
(2002). https://doi.org/10.1088/0031-9155/47/12/305 0031-9155 Google Scholar
D. J. Maitland, J. T. Walsh Jr., J. B. Prystowsky,
“Optical properties of human gallbladder tissue and bile,”
Appl. Opt., 32
(4), 586
–591
(1993). 0003-6935 Google Scholar
A. Roggan,
M. Friebel,
K. Dörschel,
A. Hahn, and
G. Müller,
“Optical properties of circulating human blood in the wavelength range ,”
J. Biomed. Opt., 4
(1), 36
–46
(1999). https://doi.org/10.1117/1.429919 1083-3668 Google Scholar
T. Yamashita,
T. Kuwahara,
S. Gonzales, and
M. Takahashi,
“Non-invasive visualization of melanin and melanocytes in reflectance mode confocal microscopy,”
J. Invest. Dermatol., 124 235
–240
(2005). https://doi.org/10.1111/j.0022-202X.2004.23562.x 0022-202X Google Scholar
S. L. Jacques,
“Origins of tissue optical properties in the UVA, visible and NIR regions,”
OSA TOPS on Advances in Optical Imaging and Photon Migration 2, 364
–371 Optical Society of America, Washington, DC
(1996). Google Scholar
L. M. McIntosh,
R. Summers,
M. Jackson,
H. H. Mantsch,
J. R. Mansfield,
M. Howlett,
A. N. Crowson, and
J. W. Toole,
“Towards non-invasive screening of skin lesions by near-infrared spectroscopy,”
J. Invest. Dermatol., 116 175
–181
(2001). https://doi.org/10.1046/j.1523-1747.2001.00212.x 0022-202X Google Scholar
|