|
|
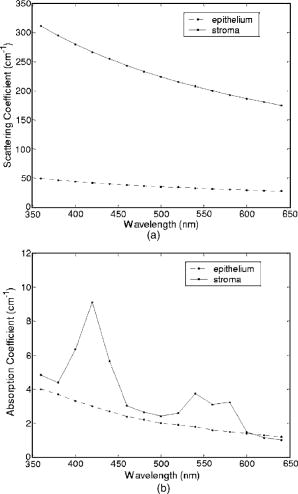
1.IntroductionNumerous clinical studies present good evidence that reflectance spectroscopy is sensitive to the morphological, structural, and biochemical changes associated with development of epithelial precancer. 1, 2, 3, 4, 5, 6, 7, 8, 9, 10, 11 However, the biological basis of observed differences in reflectance spectra of normal and dysplastic tissue is not completely understood. Modeling studies are necessary to analyze how the presence of dysplasia alters the optical properties of epithelial tissues and to provide a quantitative understanding of the specific contributions of known physiological dysplastic changes to the overall spectral response. Monte Carlo modeling provides the most flexible approach to study photon propagation in tissues. While analytical models generally impose limitations on the tissue parameters and the source-detector geometry to be simulated,12, 13, 14 Monte Carlo–based models can accurately describe photon propagation in multilayered tissue geometries and can account for sophisticated fiber-optic probe designs used in in vivo clinical studies. Monte Carlo modeling has been widely employed to analyze tissue reflectance from a number of different organ sites.15, 16, 17, 18 These studies have provided significant insight to understand disease-related changes in tissue reflectance spectra. For reflectance spectroscopy to be adopted as a tool for diagnosis of epithelial precancer, however, additional studies are required to more fully understand the connection between the changes in tissue optical properties that occur with dysplasia and the resulting changes in reflectance spectra. Epithelial tissues, such as the intestine, oral cavity, and cervix, are generally described as two-layer media consisting of a thin epithelium on top of an underlying stroma. The presence of dysplasia in epithelial tissues leads to increased light scattering from epithelial cells and increased absorption in the stroma. Increased scattering from epithelial cells occurs as a result of increased nuclear size, increased DNA content, and hyperchromasia with coarse and irregular chromatin clumping.19, 20 Increased absorption in the stroma arises from elevated hemoglobin concentration due to increased microvessel density and angiogenic activity in dysplastic tissue.21, 22 Recent evidence suggests that dysplastic progression also leads to decreased scattering in the stroma,6, 8 possibly due to decomposition and reorganization of the collagen matrix.23, 24, 25, 26 Monte Carlo modeling can be used to investigate the influence of all of these changes on reflectance signals and to identify key features that can aid in interpretation of reflectance spectra with the ultimate goal of distinguishing normal and precancerous tissues. Another benefit of Monte Carlo modeling is the ability to assess the significance of acquiring spatially resolved reflectance spectra using multiple source-detector separations. It is known that as the distance between the source and the detector fiber is increased, the sampling depth of detected photons increases.27, 28, 29 Therefore, spatially resolved reflectance spectroscopy can be used to sample different depths in epithelial tissues.7, 30, 31, 32, 33 Analysis of the spectral response and the sampling depth characteristics of different source-detector fiber pairs can provide insight into which source-detector separations may provide the most diagnostically significant information. Recently, there have been many attempts to develop mathematical or computational models that enable inverse estimation of optical parameters from in vivo fluorescence and/or reflectance measurements. 3, 34, 35, 36, 37, 38, 39 A basic premise of these studies is that direct information about diagnostically relevant optical parameters will result in more effective classification algorithms. Progress in this respect is possible only through investigation and identification of differences in spectral characteristics of normal and precancerous tissues within the framework of a forward modeling scheme. Such an approach based on Monte Carlo simulations is likely to facilitate development of inverse models and help devise inverse estimation strategies. The goal of the research described in this paper is to develop a forward model that provides a quantitative understanding of the differences observed in spatially resolved reflectance spectra of normal and highly dysplastic cervical tissue. Our group has collected a significant amount of clinical reflectance data as part of a large diagnostic trial of in vivo fluorescence and reflectance spectroscopy for cervical precancer detection. We have used Monte Carlo modeling to simulate the clinical fiber-optic probe used to acquire reflectance measurements at six different source-detector separations. Simulations have been carried out to analyze the sensitivity of spectral measurements to various possible changes in epithelial and stromal optical properties associated with dysplasia and to predict reflectance spectra of normal and highly dysplastic cervical tissue for different source-detector separations. Predictions from simulations are compared to spectra measured in vivo from patients in different diagnostic categories. Comparing Monte Carlo simulation results to real clinical measurements provides a basis to understand the biological basis of spectral changes that accompany dysplastic progression. Penetration depth statistics of photons detected at the six source-detector separations are also presented to reveal the sampling depth profile of the clinical fiber-optic probe. 2.Methods2.1.Clinical Measurements of Reflectance Spectra from Cervical TissueClinical reflectance spectroscopy data have been collected over the past several years at The University of Texas M. D. Anderson Cancer Center (Houston, Texas), Lyndon B. Johnson Hospital (Houston, Texas), and The British Columbia Cancer Research Center (Vancouver, Canada) as part of a large ongoing diagnostic trial of in vivo fluorescence and reflectance spectroscopy for cervical precancer detection. Reflectance measurements presented in this paper represent the subset of data obtained at The British Columbia Cancer Research Center. The fiber-optic probe used in this clinic had a outer diameter, and reflectance spectra were obtained at six different source-detector separations. A schematic diagram of the tip of the probe is shown in Fig. 1 . The central portion of the probe was utilized for fluorescence excitation and collection. The fibers shown in Fig. 1 were used to acquire spatially resolved reflectance spectra. All of the fibers had a diameter and a numerical aperture of 0.22. In Fig. 1, indicates the detector fiber, and the fibers labeled 1 to 6 represent the source fibers delivering broadband excitation light from a Xenon lamp. The labels 1 to 6 are used to distinguish the source fibers belonging to different groups corresponding to six different source-detector separations. The source-detector geometry is detailed in Table 1 , which lists the center-to-center source-detector separations and the total number of source fibers present for each source-detector separation. Note that the number of source fibers increases with increasing source-detector separation. Since reflectance signals are expected to be lower for large source-detector separations, using a larger number of source fibers increases the volume of tissue sampled and allows satisfactory signal to noise ratios to be obtained. As part of preprocessing, spectra measured from cervical tissue sites were normalized by standard spectra measured from an integrating sphere made of spectralon. This normalization corrected for the wavelength-dependent source intensity and the wavelength-dependent response of the optical system and scaled the tissue measurements to factor out the number of source fibers. Fig. 1Schematic diagram of the tip of the fiber-optic probe used to acquire clinical measurements. The central portion of the probe was used for fluorescence measurements, whereas the fibers shown were used to obtain spatially resolved reflectance spectra. In the figure, is the detector fiber, and the labels 1 to 6 represent different sets of source fibers located at specified distances from the detector fiber. 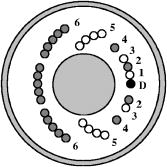 Table 1Source-detector geometry used to acquire spatially resolved reflectance spectra from cervical tissue.
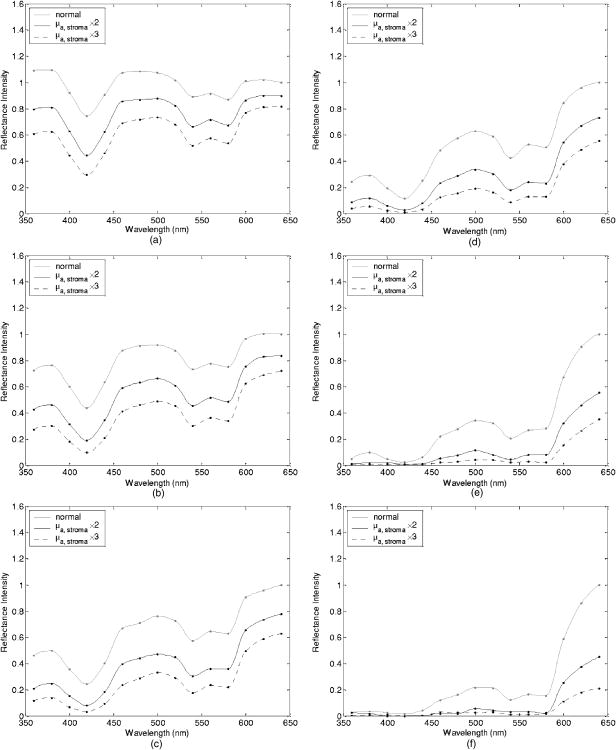
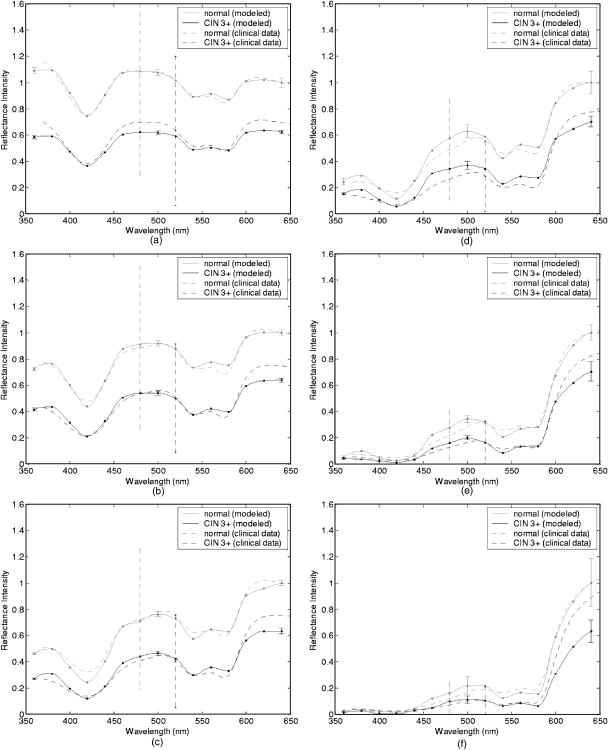
Tissue spectra for each of the six source-detector separations consisted of 113 intensity measurements corresponding to wavelengths from in increments. Following spectroscopic measurements, cervical tissue sites were biopsied and submitted for histopathologic analysis. Spectral measurements were made and biopsies were taken under colposcopic guidance with 7 to magnification. All measurements were made by providers with significant experience in performing colposcopy, which has a spatial resolution of approximately . A group of pathologists classified the biopsied sites into diagnostic categories including normal (negative for dysplasia), atypia, human papilloma virus (HPV)–associated changes, CIN (cervical intraepithelial neoplasia), and CIS (carcinoma in situ). The CIN biopsies were further subclassified as CIN 1 (mild dysplasia), CIN 2 (moderate dysplasia), and CIN 3 (severe dysplasia). Since the main focus of the research described in this paper is to analyze reflectance spectra of normal and highly dysplastic cervical tissue, the clinical data set presented hereafter consists solely of reflectance measurements obtained from sites that were classified as normal, CIN 3, or CIS. 2.2.Input for Monte Carlo ModelingThe fixed-weight, multilayered Monte Carlo code used for the simulations presented hereafter has been implemented in C/C++. The simulations have been carried out for every between and . These fifteen wavelengths were sufficient to provide a reasonable characterization of spectral reflectance. Each simulation has been performed using input photons. 2.2.1.Tissue parametersCervical tissue was considered to be a two-layer medium with the epithelium on the top and the stroma underneath. The thickness of the normal cervical squamous epithelium40 was assumed to be , and the stroma was modeled as a semi-infinite medium. Use of realistic and relevant optical properties is a crucial part of modeling. The values used in this paper to model normal cervical tissue have been collected from various sources. These were mostly based on measurements from cervical tissue or other tissues having a similar architecture. Epithelial scattering coefficients were obtained from confocal measurements of ex vivo cervical tissue samples.41 Epithelial absorption coefficients and stromal scattering coefficients were based on a study by Qu 42 reporting integrating sphere measurements of bronchial tissue. Absorption in the stroma can be attributed to hemoglobin and collagen. Absorption coefficients of both of these components were calculated separately and summed to characterize stromal absorption. Hemoglobin absorption coefficients were computed using the extinction coefficients compiled by Prahl.43 Concentration of hemoglobin in blood18, 43 was assumed to , hemoglobin oxygen saturation3, 17, 18, 44 was assumed to be 60%, and the volume fraction of the blood in the stroma3, 18, 44, 45 was estimated to be 0.3%. Collagen absorption coefficients were based on results reported for bloodless skin samples.45, 46 Figure 2 shows the scattering and absorption coefficients used to model squamous normal cervical tissue. The wavelength resolution in the plots is . In the simulations, the refractive indices of both the epithelium and the stroma were set to 1.4. The epithelial anisotropy factor was assigned a value of 0.95, and the stromal anisotropy factor was assumed to be 0.88, independent of wavelength.47 In modeling epithelial precancer, we considered only changes in epithelial scattering coefficient, stromal absorption coefficient, and stromal scattering coefficient. An increase in epithelial scattering coefficient for highly dysplastic cervical tissue has been reported by Collier 41 An increase in stromal absorption coefficient is also expected since angiogenesis associated with progression of dysplasia has been well documented.21, 22 It has also been reported that the collagen matrix in the stroma degrades with progression of dysplasia,23, 24, 25, 26 and degradation of the collagen matrix may lead to a decrease in stromal scattering coefficient.6, 8 Therefore, the main focus of the modeling studies presented in this paper was to assess the contribution of alterations in these three optical parameters to dysplasia-associated changes in spectral response. The epithelial absorption coefficient, the refractive indices, and the anisotropy factors were kept the same as in the case of normal tissue. Epithelial thickness for dysplastic tissue was again assumed to be .40 2.2.2.Fiber-optic probe parametersFiber parameters were selected to match the geometry of the clinical fiber-optic probe and to simulate the six source-detector separations given in Table 1. Photon launch and detection were restricted to an angular range that was consistent with the numerical aperture of the fibers. The refractive indices of both the source and the detector fibers were set to 1.5, and the refractive index mismatch between the fibers and the tissue was accounted for using the Fresnel relation. We also assumed that the material between the fiber tips was highly absorptive to prevent any internal reflection off the probe surface. 2.3.Output from Monte Carlo ModelingThe output of each simulation includes detected reflectance intensity for each of the six source-detector separations. Three simulations have been carried out for each set of optical properties considered, and the spectra presented for each source-detector separation correspond to the averages over three different simulations. Intensities at the fifteen wavelengths simulated have been interpolated in MATLAB using piecewise cubic Hermite polynomials, decreasing the sampling interval for the spectral Monte Carlo modeling plots to . Maximum penetration depths of all the photons collected at each source-detector separation have also been recorded during the Monte Carlo simulations. Note that maximum penetration depth as used here is defined to be the maximum depth in tissue at which a photon undergoes a scattering event. Average maximum penetration depth corresponds to the maximum penetration depth averaged over all detected photons, and analysis of this parameter as a function of wavelength can provide a better understanding of the differences in reflectance spectra for different source-detector separations and can reveal the sampling depth characteristics of different source-detector fiber pairs. 3.Results3.1.Sensitivity of Spectral Reflectance to Possible Dysplastic ChangesAs an initial step to better understand the spectral changes associated with each optical property affected by the presence of dysplasia, simulations were carried out to investigate each change separately. The following sections present Monte Carlo modeling results that demonstrate the sensitivity of spectral reflectance to increased epithelial scattering, increased stromal absorption, and decreased stromal scattering. 3.1.1.Epithelial scatteringFigure 3 shows the effect of varying the epithelial scattering coefficient, , on reflectance spectra for the six different source-detector separations. The light-colored spectra correspond to the results obtained with the base optical properties shown in Fig. 2. The solid black spectra were obtained by increasing by a factor of two, and the dashed black spectra were obtained by increasing by a factor of three. All the other optical parameters were held constant. For each source-detector separation, the base spectrum designated as normal has been normalized such that the reflectance intensity at equals one. The same scaling factor has been applied to the other two spectra shown in each plot. Simulation results show that the difference in intensity levels for the smallest and the largest source-detector separation is about two orders of magnitude. Note, however, that the normalization scheme described allows all the spectra to be plotted on the same scale and enables direct comparison of spectral shapes for different source-detector separations. The spectra in Fig. 3 illustrate typical characteristics associated with tissue reflectance. The valleys in the spectra due to hemoglobin absorption maxima at around , , and are evident for all source-detector separations, and these valleys tend to become wider and shallower as the source-detector separation is increased. Note also that the spectra for smaller source-detector separations are flatter, whereas the relative rate of wavelength-dependent increase in reflectance intensity is higher for larger source-detector separations. The results also demonstrate that changing the epithelial scattering coefficient does not have a significant effect on either the reflectance intensity or the spectral shape for any of the source-detector separations. For the smallest source-detector separation that represents the case where the source fiber and the detector fiber are placed next to each other, increasing results in a slight decrease in reflectance intensity [Fig. 3a]. For the other five source-detector separations, increasing leads to a slight increase in reflectance intensity [Fig. 3b, 3c, 3d, 3e, 3f]. 3.1.2.Stromal absorptionFigure 4 shows the effect of varying the stromal absorption coefficient, , on reflectance spectra for the six different source-detector separations. As in Fig. 3, the light-colored spectra correspond to the results obtained with the base optical properties. The solid black spectra and the dashed black spectra were obtained by increasing by a factor of two and three, respectively, while keeping all the other parameters constant. These results have also been normalized such that the reflectance intensity at equals one for the base case. Figure 4 shows that increasing significantly decreases the reflectance intensity for all source-detector separations. Increasing the stromal absorption coefficient also results in wider and shallower hemoglobin absorption valleys, which is particularly evident for source-detector separations of , , , and [Fig. 4b, 4c, 4d, 4e]. Note that for the source-detector separation of [Fig. 4f], increasing leads to detection of very few reflected photons, almost entirely flattening out spectral features associated with hemoglobin absorption. 3.1.3.Stromal scatteringThe effect of varying the stromal scattering coefficient, , is shown in Fig. 5 . The solid black spectra were obtained by decreasing by 25% relative to that used for the light-colored spectra, and the dashed black spectra were obtained by decreasing by 50%. All other optical parameters were held constant. The results were normalized using the same method described for Figs. 3 and 4. Results in Fig. 5 illustrate that changing the stromal scattering coefficient has considerable influence on spectral profiles. Decreasing decreases the reflectance intensity and flattens out the spectra for the four smallest source-detector separations [Fig. 5a, 5b, 5c, 5d], with separation being least sensitive to changes in [Fig. 5d]. Interestingly, the trend reverses for source-detector separations greater than , and decreasing actually increases the reflectance intensity for the two largest source-detector separations [Fig. 5e and 5f]. In these cases, decreasing increases the relative rate of wavelength-dependent increase in reflectance intensity and deepens the hemoglobin absorption valleys. 3.2.Predictions for Spectral Reflectance of Highly Dysplastic Cervical TissueTo predict spectral changes associated with dysplastic progression, we must consider the effects of increased epithelial scattering, increased stromal absorption, and decreased stromal scattering simultaneously. Measurements by Collier 41 using confocal microscopy indicate that there is a threefold increase in the epithelial scattering coefficient of highly dysplastic cervical tissue relative to normal tissue. It has been shown that the microvessel density in the stroma increases by approximately a factor of two in the case of severe cervical dysplasia.21, 22 Therefore, in modeling reflectance spectra for highly dysplastic cervical tissue, we increased the epithelial scattering coefficient, , by a factor of three and the stromal absorption coefficient, , by a factor of two. Since there is no quantitative information about changes in stromal scattering, three cases were considered. In the first case, the stromal scattering coefficient, , was kept the same as in normal tissue. In the second case, was decreased by 25% compared to normal tissue, and in the third case, was decreased by 50%. Figure 6 shows the simulation results corresponding to different combinations of optical properties. The light-colored solid spectra represent results for normal tissue, and the remaining three spectra represent results corresponding to different stromal scattering coefficients. For each source-detector separation, the spectrum for normal tissue has been normalized such that the reflectance intensity at equals one. The same scaling factor has been applied to the other spectra shown in each plot. The results illustrate that decreasing in addition to other dysplastic changes simulated decreases the reflectance intensity for the first four source-detector separations [Fig. 6a, 6b, 6c, 6d]. For the remaining two source-detector separations, decreasing increases the reflectance intensity. These results are consistent with those presented in Fig. 5, where only changes in were considered. 3.3.Comparison of Monte Carlo Modeling Results to Clinical MeasurementsThe clinical data set available consisted of reflectance spectra measured in vivo from 176 cervical tissue sites in 136 patients. The mean age of the patients was 35, with a standard deviation of 10. Table 2 shows the breakdown of measurements according to histopathologic diagnosis as well as age. The CIN category involves sites that were classified as CIN 3 or CIS. Table 2Description of the clinical data set used for comparison to Monte Carlo simulation results. Figure 7 shows the averaged reflectance spectra for the two diagnostic categories. Two different age groups are plotted separately to explore whether there are any age-related differences in reflectance measurements, as have been observed in autofluorescence measurements.47, 48 For each source-detector separation, the averaged spectrum corresponding to normal tissue sites obtained from patients older than 35 has been normalized such that the reflectance intensity at equals one. The same scaling factor has been applied to the remaining three averaged spectra. The figure also shows the standard deviations corresponding to the averages for each group. The averaged clinical reflectance spectra shown in Fig. 7 indicate that CIN leads to an overall decrease in reflectance intensity for all source-detector separations. The hemoglobin absorption valleys at around , , and tend to be broader for the case of CIN . Age-related differences are most pronounced for the smallest source-detector separation [Fig. 7a]. The relative intensity differences between normal and CIN tissue sites tend to be larger for patients older than 35. For patients old or younger, the intensity differences are smaller. Note that as the source-detector separation increases, age-related differences in the averaged spectra diminish. Figure 7 also demonstrates that there can be extensive variability in the measured reflectance spectra, as evidenced by the large standard deviations characterizing the averages. Fig. 7Averaged clinical reflectance spectra for different diagnostic categories at a source-detector separation of (a) , (b) , (c) , (d) , (e) , and (f) .  Figure 8 compares the averaged clinical reflectance spectra for different diagnostic categories to predictions from Monte Carlo simulations. In comparing clinical measurements to model predictions, we combined the two age groups and computed the averages for normal and CIN sites over the entire data set. Visual inspection of these averages and model predictions from Fig. 6 revealed that the simulation results that best matched the dysplastic changes observed in averaged clinical data corresponded to the case with , , and . Therefore, the modeled spectra shown in Fig. 8 for CIN represent this particular case. For each source-detector separation, the modeled spectrum for normal tissue has been normalized such that the reflectance intensity at equals one. The same scaling factor has been used to normalize the modeled spectrum for CIN tissue. A similar normalization scheme has been applied to the averaged clinical data, enabling comparison of modeled and measured spectra on the same scale. Also shown in Fig. 8 are the standard deviations of Monte Carlo modeling results over three different simulations. These standard deviations provide some insight into the variability of simulation results and are included for only three wavelengths to maintain clarity of the plots. The figure shows that there is extremely good agreement between modeled and measured reflectance spectra for all source-detector separations. We conclude that the base optical properties of Fig. 2 that have been used to model squamous normal tissue can adequately reproduce spectral features observed in clinical measurements. The modeled spectra accurately predict the relative rate of wavelength-dependent increase in reflectance intensity for different source-detector separations. It is also evident in Fig. 8 that increasing the epithelial scattering coefficient by a factor of three, increasing the stromal absorption coefficient by a factor of two, and decreasing the stromal scattering coefficient by 25% predict changes with severe dysplasia that are in good agreement with those observed in clinical data. Simulation results based on these assumptions accurately predict the relative decrease in reflectance intensity for CIN tissue sites. Broadening of hemoglobin absorption valleys in spectra measured from CIN tissue sites is also well captured in the modeled spectra. The most significant intensity discrepancies between averaged clinical measurements and modeling results for CIN tissue tend to occur for wavelengths greater than , especially for the largest source-detector separation [Fig. 8f]. Note that for large source-detector separations, there is increased variability in Monte Carlo modeling results, which is evidenced by large standard deviations. This is due to the fact that the relative number of detected photons is smaller for larger source-detector separations. 3.4.Analysis of Depth SensitivityFigure 9 shows the average maximum penetration depths computed for two sets of optical properties. The first set corresponds to the optical properties for normal tissue, and the second set corresponds to the case with , , and . These two particular sets were chosen since they represent the two extreme cases presented in Fig. 6. The standard deviations over three different simulation results are shown for three wavelengths. The results shown in Fig. 9 demonstrate that as the distance between the source and the detector increases, photons penetrate deeper into the tissue before they reach the detector fiber. The wavelength-dependent increase in average maximum penetration depth is greater for larger source-detector separations. Note also that as the source-detector separation increases, hemoglobin absorption appears to have a more profound effect on the penetration depth profiles. The average maximum penetration depths are almost always smaller for the case with , , and . Fig. 9Average maximum penetration depths computed for a source-detector separation of (a) , (b) , (c) , (d) , (e) , and (f) .  An important point to note is that even for the smallest source-detector separation, the average maximum penetration depth is greater than the epithelial thickness over the entire spectral range. This means that almost all of the photons collected penetrate into the stroma, and this source-detector geometry cannot exclusively probe the epithelial layer. In fact, the simulation results for the smallest source-detector separation indicate that for normal tissue, only 0.2 to 0.6% of detected photons do not enter the stroma and scatter only in the epithelium. For the case with , , and , this fraction increases to only about 5 to 17%. In both cases, the high end of the percentages corresponds to results computed at . 4.DiscussionThe averaged clinical spectra presented in this paper indicate that severe dysplasia results in decreased reflectance intensity. A decrease in reflectance signals with progression of dysplasia has been previously observed in a number of recent clinical studies.3, 6, 7, 8, 11 Huh, 10 on the other hand, have reported an overall increase in reflectance intensity for highly dysplastic cervical tissue. It should be pointed out, however, that the study by Huh 10 employed a noncontact optical probe operating at a distance of from the tissue surface, as opposed to a contact probe employed in our study and in those reporting similar results.3, 6, 7, 8, 11 Zonios 3 have also noted that the reflectance spectra for highly dysplastic tissues are characterized by more prominent hemoglobin absorption valleys. This is in line with our observation of broader hemoglobin absorption valleys in CIN tissue sites. Monte Carlo simulations presented provide a quantitative understanding of the relationship between tissue optical properties and spatially resolved reflectance spectra. Increase in epithelial scattering, increase in stromal absorption, and decrease in stromal scattering are all likely to accompany dysplastic progression, but the results of the sensitivity analysis presented in Fig. 3 through Fig. 5 indicate that for the simulated fiber-optic probe geometry, increasing epithelial scattering has minimal effect on detected reflectance. The slight differences brought on by varying the epithelial scattering coefficient are mostly within the uncertainty limits of the simulation results. Increasing stromal absorption and decreasing stromal scattering, on the other hand, profoundly affect spectral reflectance. It is also important to note that changing a given optical parameter can lead to different trends in spectral response depending on the source-detector separation. This is best illustrated in Fig. 5, which shows that decreasing the stromal scattering coefficient decreases the reflectance intensity for small source-detector separations. For large source-detector separations, decreasing the stromal scattering coefficient tends to increase the reflectance intensity. This result is consistent with the diffusive characteristics of a highly scattering medium such as the stroma. A decrease in stromal scattering coefficient allows photons to penetrate deeper into the tissue and reduces the probability of reflection close to the source fiber. Thus, the number of photons detected at small source-detector separations decreases. Photons that penetrate deep into the stroma exit the tissue at larger distances from the source fiber, resulting in enhanced probability of detection at large source-detector separations. Figure 5 also shows that reflectance spectra are least sensitive to changes in stromal scattering coefficient for an intermediate source-detector separation. Existence of a particular range of source-detector fiber separations for which reflectance signals are quite insensitive to the scattering parameters has been previously reported by Mourant 49 In predicting reflectance spectra for highly dysplastic tissue, three different combinations of optical properties were tested. These different combinations focused on analyzing the effect of changing the stromal scattering coefficient. Simulation results indicate that increasing the epithelial scattering coefficient by a factor of three, increasing the stromal absorption coefficient by a factor of two, and decreasing the stromal scattering coefficient by 25% resulted in generation of spectra that were consistent with dysplastic changes observed in averaged clinical measurements. An important question is whether the dysplastic changes observed in averaged reflectance measurements can be explained through alternative combinations of optical properties. For example, intensity level differences can be accounted for by assuming no reduction in stromal scattering coefficient but by further elevating the stromal absorption coefficient. Note, however, that, as evidenced in Fig. 4, further elevation of stromal absorption would flatten out spectral features to an extent not consistent with clinical measurements. More importantly, visual inspection of the modeled spectra presented in Fig. 6 reveals that incorporation of reduced stromal scattering plays an integral role in characterizing the rate of wavelength-dependent increase in reflectance intensity, especially for larger source-detector separations. Averaged reflectance spectra measured from CIN sites illustrate that reflectance intensity for wavelengths greater than tends to increase sharply for the three largest source-detector separations. Monte Carlo modeling results shown in Fig. 6 provide strong evidence that this behavior is most consistent with decreased scattering coefficient. Although the structural and optical properties used to model cervical tissue can accurately describe spectral features observed in clinical measurements, it is important to revisit and discuss some of the assumptions involved. For example, the same refractive index was assigned to both epithelium and stroma. It is true that collagen fibers in the stroma are optically denser compared to epithelial cells, but the extracellular medium in which both epithelial cells and collagen fibers are embedded has a refractive index of about 1.35.50 Therefore, assignment of a refractive index of 1.4 to both tissue layers is a reasonable assumption. To assess the effect of a possible refractive index mismatch at the interface of the two tissue layers, we have carried out Monte Carlo simulations where a refractive index of 1.35 was assigned to the epithelium and a refractive index of 1.45 was assigned to the stroma, corresponding to the maximum probable refractive index difference between the two layers. Simulation results indicate that for normal tissue, the deviation of reflectance intensity at from the default value averages to about 4% for the six source-detector separations, and the deviation of the corresponding average maximum penetration depth averages to about 3%. For the case with , , and , the deviations for the reflectance intensity and the average maximum penetration depth, again at , average to about 6% and 2%, respectively. These deviations are mostly within the uncertainty limits of the simulation results, indicating that the effect of a possible refractive index mismatch between the two layers is not significant compared to variations produced by other changes in optical properties. In modeling highly dysplastic cervical tissue, we did not increase the thickness of the epithelial layer. We are not aware of a quantitative study that shows epithelial thickening with progression of dysplasia. There is, however, a recent study40 that specifically reports no correlation between epithelial thickness and the grade of cervical dysplasia. Given that there is no sound evidence of epithelial thickening with precancer progression, we chose to keep this parameter constant and instead focused on the changes in optical coefficients. Since there is also no sound evidence of significant changes in anisotropy factors with progression of dysplasia, we also kept these parameters fixed for both tissue layers. The simulations presented did not consider any possible effect of acetic acid applied to cervical tissue before spectroscopic measurements and biopsy removal. Acetic acid alters the refractive index profile of epithelial cell nuclei51 and can potentially lead to changes in epithelial scattering coefficient. Nevertheless, the results in Fig. 3 suggest that any acetic acid–induced changes in epithelial scattering coefficient would have minimal effect on reflectance profiles. It should also be emphasized that although the modeling results demonstrate good agreement with measured spectra on the average, Fig. 8 illustrates that there can be significant variability among clinical spectra from the same diagnostic category. Biographical variables such as age, race, or hormonal status are likely to influence the biochemical, architectural, and structural properties of cervical tissue. Alterations in optical parameters due to differences in these variables are potential sources of variability in reflectance signals acquired from different patients. A better understanding of the significant interpatient variation observed in clinical measurements requires a quantitative assessment of the influence of biographical variables on optical properties of cervical tissue. It is also evident from Fig. 7 that even when patients from different age groups are considered separately, there can still be significant variability in reflectance intensity. This observation suggests that age alone cannot explain the variability in clinical measurements. On the average, however, the intensity differences between spectra from normal and CIN sites tend to be larger for patients older than 35. It has been reported that collagen cross-linking increases with age,52 and differences in stromal scattering properties resulting from alterations in the collagen matrix may provide a possible explanation for this trend. The main benefit of acquiring spatially resolved reflectance spectra is the ability to probe different depths within the tissue. Penetration depth statistics presented in Fig. 9 indicate that larger source-detector separations sample deeper tissue regions, consistent with the results previously reported.27, 28, 29 Figure 9 also illustrates that the wavelength-dependent increase in average maximum penetration depth is much greater for large source-detector separations, leading to a more significant increase in the number of scattering events a photon undergoes before being detected. This trend explains why the relative rate of wavelength-dependent increase in reflectance intensity is higher for larger source-detector separations. Increasing the epithelial scattering coefficient and increasing the stromal absorption coefficient lead to a decrease in average maximum penetration depth, whereas decreasing the stromal scattering coefficient results in an increase in average maximum penetration depth. Figure 9 indicates that the combined effect of these changes is an overall decrease in average maximum penetration depth. This suggests that the same probe geometry can sample more superficial tissue depths when dysplasia is present. Perhaps the most important aspect of the penetration depth analysis is the observation that the average maximum penetration depths calculated are always greater than the epithelial thickness. Simulation results indicate that almost all of the photons collected penetrate deep into the stroma and scatter many times before reaching the detector fibers. This is due to the fact that scattering in the epithelial layer is relatively low and mostly forward directed, and stroma is highly scattering. Even for the case where the source and the detector fibers are closely spaced, the number of detected photons that scatter only in the epithelium without penetrating into the stroma is negligibly small. This is consistent with the results shown in Fig. 3, where changes in epithelial scattering coefficient do not seem to have a significant effect on spectral reflectance even for the smallest source-detector separation. Epithelial scattering is sensitive to changes in nuclear morphology and chromatin texture, which are important indicators of dysplastic progression.53 Therefore, collection of photons that scatter only in the epithelium without penetrating into the stroma can prove diagnostically significant. Based on the simulation results presented here, we can conclude that the clinical fiber-optic probe geometry used in this study is mainly sensitive to stromal optical properties. The diagnostic potential of reflectance spectroscopy can be optimized by designing fiber-optic probes that can resolve spectral information from the epithelial layer and hence reveal information about dysplastic changes in both the epithelium and the stroma. Some of the promising probe designs that have recently been explored involve the use of angled source and detector fibers54, 55, 56 or lens-coupled source and detector fibers.57, 58 5.ConclusionsThe goal of the research presented in this paper was to carry out modeling studies to explain differences observed in spatially resolved reflectance spectra of normal and highly dysplastic cervical tissue. Monte Carlo modeling results provide a quantitative understanding of the specific contributions of different epithelial and stromal optical parameters to the overall spectral response. Predictions from simulations agree well with in vivo clinical measurements and can successfully describe differences in intensity and shape of reflectance spectra obtained from normal and CIN tissue sites. The results from this study are expected to provide a basis to better interpret tissue spectra. ReferencesJ. R. Mourant,
I. J. Bigio,
J. Boyer,
R. L. Conn,
T. Johnson, and
T. Shimada,
“Spectroscopic diagnosis of bladder cancer with elastic light scattering,”
Lasers Surg. Med., 17 350
–357
(1995). 0196-8092 Google Scholar
F. Koenig,
R. Larne,
H. Enquist,
F. J. McGovern,
K. T. Schomacker,
N. Kollias, and
T. F. Deutsch,
“Spectroscopic measurement of diffuse reflectance for enhanced detection of bladder carcinoma,”
Urology, 51 342
–345
(1998). https://doi.org/10.1016/S0090-4295(97)00612-2 0090-4295 Google Scholar
G. Zonios,
L. T. Perelman,
V. Backman,
R. Manoharan,
M. Fitzmaurice,
J. Van Dam, and
M. S. Feld,
“Diffuse reflectance spectroscopy of human adenomatous colon polyps in vivo,”
Appl. Opt., 38 6628
–6637
(1999). 0003-6935 Google Scholar
I. J. Bigio,
S. G. Bown,
G. Briggs,
C. Kelley,
S. Lakhani,
D. Pickard,
P. M. Ripley,
I. G. Rose, and
C. Saunders,
“Diagnosis of breast cancer using elastic-scattering spectroscopy: preliminary clinical results,”
J. Biomed. Opt., 5 221
–228
(2000). https://doi.org/10.1117/1.429990 1083-3668 Google Scholar
R. J. Nordstrom,
L. Burke,
J. M. Niloff, and
J. F. Myrtle,
“Identification of cervical intraepithelial neoplasia (CIN) using UV-excited fluorescence and diffuse-reflectance tissue spectroscopy,”
Lasers Surg. Med., 29 118
–127
(2001). https://doi.org/10.1002/lsm.1097 0196-8092 Google Scholar
I. Georgakoudi,
E. E. Sheets,
M. G. Müller,
V. Backman,
C. P. Crum,
K. Badizadegan,
R. R. Dasari, and
M. S. Feld,
“Trimodal spectroscopy for the detection and characterization of cervical precancers in vivo,”
Am. J. Obstet. Gynecol., 186 374
–382
(2002). https://doi.org/10.1067/mob.2002.121075 0002-9378 Google Scholar
Y. N. Mirabal,
S. K. Chang,
E. N. Atkinson,
A. Malpica,
M. Follen, and
R. Richards-Kortum,
“Reflectance spectroscopy for in vivo detection of cervical precancer,”
J. Biomed. Opt., 7 587
–594
(2002). https://doi.org/10.1117/1.1502675 1083-3668 Google Scholar
M. G. Müller,
T. A. Valdez,
I. Georgakoudi,
V. Backman,
C. Fuentes,
S. Kabani,
N. Laver,
Z. Wang,
C. W. Boone,
R. R. Dasari,
S. M. Shapshay, and
M. S. Feld,
“Spectroscopic detection and evaluation of morphologic and biochemical changes in early human oral carcinoma,”
Cancer, 97 1681
–1692
(2003). 0008-543X Google Scholar
A. Garcia-Uribe,
N. Kehtarnavaz,
G. Marquez,
V. Prieto,
M. Duvic, and
L. V. Wang,
“Skin cancer detection by spectroscopic oblique-incidence reflectometry: classification and physiological origins,”
Appl. Opt., 43 2643
–2650
(2004). https://doi.org/10.1364/AO.43.002643 0003-6935 Google Scholar
W. K. Huh,
R. M. Cestero,
F. A. Garcia,
M. A. Gold,
R. S. Guido,
K. McIntyre-Seltman,
D. M. Harper,
L. Burke,
S. T. Sum,
R. F. Flewelling, and
R. D. Alvarez,
“Optical detection of high-grade cervical intraepithelial neoplasia in vivo: results of a 604-patient study,”
Am. J. Obstet. Gynecol., 190 1249
–1257
(2004). https://doi.org/10.1016/j.ajog.2003.12.006 0002-9378 Google Scholar
M. P. Bard,
A. Amelink,
M. Skurichina,
M. den Bakker,
S. A. Burgers,
J. P. van Meerbeeck,
R. P. Duin,
J. G. Aerts,
H. C. Hoogsteden, and
H. J. Sterenborg,
“Improving the specificity of fluorescence bronchoscopy for the analysis of neoplastic lesions of the bronchial tree by combination with optical spectroscopy: preliminary communication,”
Lung Cancer, 47 41
–47
(2005). 0169-5002 Google Scholar
W. M. Star,
“Diffusion theory of light transport,”
Optical-Thermal Response of Laser-Irradiated Tissue, 131
–206 Plenum, New York
(1995). Google Scholar
P. Thueler,
I. Charvet,
F. Bevilacqua,
M. St. Ghislain,
G. Ory,
P. Marquet,
P. Meda,
B. Vermeulen, and
C. Depeursinge,
“In vivo endoscopic tissue diagnostics based on spectroscopic absorption, scattering, and phase function properties,”
J. Biomed. Opt., 8 495
–503
(2003). https://doi.org/10.1117/1.1578494 1083-3668 Google Scholar
B. Chen,
K. Stamnes, and
J. J. Stamnes,
“Validity of the diffusion approximation in bio-optical imaging,”
Appl. Opt., 40 6356
–6366
(2001). 0003-6935 Google Scholar
A. H. Gandjbakhche,
R. F. Bonner,
A. E. Arai, and
R. S. Balaban,
“Visible-light photon migration through myocardium in vivo,”
Am. J. Physiol., 277 H698
–H704
(1999). 0002-9513 Google Scholar
D. A. Boas,
J. P. Culver,
J. J. Stott, and
A. K. Dunn,
“Three dimensional Monte Carlo code for photon migration through complex heterogeneous media including the adult human head,”
Opt. Express, 10 159
–170
(2002). 1094-4087 Google Scholar
I. V. Meglinski and
S. J. Matcher,
“Computer simulation of the skin reflectance spectra,”
Comput. Methods Programs Biomed., 70 179
–186
(2003). https://doi.org/10.1016/S0169-2607(02)00099-8 0169-2607 Google Scholar
D. Hidovic-Rowe and
E. Claridge,
“Modelling and validation of spectral reflectance for the colon,”
Phys. Med. Biol., 50 1071
–1093
(2005). https://doi.org/10.1088/0031-9155/50/6/003 0031-9155 Google Scholar
R. Drezek,
M. Guillaud,
T. Collier,
I. Boiko,
A. Malpica,
C. MacAulay,
M. Follen, and
R. Richards-Kortum,
“Light scattering from cervical cells throughout neoplastic progression: influence of nuclear morphology, DNA content, and chromatin texture,”
J. Biomed. Opt., 8 7
–16
(2003). https://doi.org/10.1117/1.1528950 1083-3668 Google Scholar
D. Arifler,
M. Guillaud,
A. Carraro,
A. Malpica,
M. Follen, and
R. Richards-Kortum,
“Light scattering from normal and dysplastic cervical cells at different epithelial depths: finite-difference time-domain modeling with a perfectly matched layer boundary condition,”
J. Biomed. Opt., 8 484
–494
(2003). https://doi.org/10.1117/1.1578640 1083-3668 Google Scholar
P. Ravazoula,
V. Zolota,
O. Hatjicondi,
G. Sakellaropoulos,
G. Kourounis, and
M. E. Maragoudakis,
“Assessment of angiogenesis in human cervical lesions,”
Anticancer Res., 16 3861
–3864
(1996). 0250-7005 Google Scholar
J. S. Lee,
H. S. Kim,
J. J. Jung,
M. C. Lee, and
C. S. Park,
“Angiogenesis, cell proliferation and apoptosis in progression of cervical neoplasia,”
Anal Quant Cytol. Histol., 24 103
–113
(2002). 0884-6812 Google Scholar
K. J. Heppner,
L. M. Matrisian,
R. A. Jensen, and
W. H. Rodgers,
“Expression of most matrix metalloproteinase family members in breast cancer represents a tumor-induced host response,”
Am. J. Pathol., 149 273
–282
(1996). 0002-9440 Google Scholar
W. C. Parks, Matrix Metalloproteinases, Academic, San Diego
(1998). Google Scholar
I. Pavlova,
K. Sokolov,
R. Drezek,
A. Malpica,
M. Follen, and
R. Richards-Kortum,
“Microanatomical and biochemical origins of normal and precancerous cervical autofluorescence using laser-scanning fluorescence confocal microscopy,”
Photochem. Photobiol., 77 550
–555
(2003). https://doi.org/10.1562/0031-8655(2003)077<0550:MABOON>2.0.CO;2 0031-8655 Google Scholar
P. Wilder-Smith,
K. Osann,
N. Hanna,
N. El Abbadi,
M. Brenner,
D. Messadi, and
T. Krasieva,
“In vivo multiphoton fluorescence imaging: a novel approach to oral malignancy,”
Lasers Surg. Med., 35 96
–103
(2004). https://doi.org/10.1002/lsm.20079 0196-8092 Google Scholar
I. V. Meglinskii and
S. D. Matcher,
“Analysis of the spatial distribution of detector sensitivity in a multilayer randomly inhomogeneous medium with strong light scattering and absorption by the Monte Carlo method,”
Opt. Spectrosc., 91 654
–659
(2001). https://doi.org/10.1134/1.1412689 0030-400X Google Scholar
M. Larsson,
W. Steenbergen, and
T. Strömberg,
“Influence of optical properties and fiber separation on laser Doppler flowmetry,”
J. Biomed. Opt., 7 236
–243
(2002). https://doi.org/10.1117/1.1463049 1083-3668 Google Scholar
M. S. Patterson,
S. Andersson-Engels,
B. C. Wilson, and
E. K. Osei,
“Absorption spectroscopy in tissue-simulating materials: a theoretical and experimental study of photon paths,”
Appl. Opt., 34 22
–30
(1995). 0003-6935 Google Scholar
U. Utzinger and
R. Richards-Kortum,
“Fiber optic probes for biomedical optical spectroscopy,”
J. Biomed. Opt., 8 121
–147
(2003). https://doi.org/10.1117/1.1528207 1083-3668 Google Scholar
M. Larsson,
H. Nilsson, and
T. Strömberg,
“In vivo determination of local skin optical properties and photon path length by use of spatially resolved diffuse reflectance with applications in laser Doppler flowmetry,”
Appl. Opt., 42 124
–134
(2003). 0003-6935 Google Scholar
A. Pifferi,
J. Swartling,
E. Chikoidze,
A. Torricelli,
P. Taroni,
A. Bassi,
S. Andersson-Engels, and
R. Cubeddu,
“Spectroscopic time-resolved diffuse reflectance and transmittance measurements of the female breast at different interfiber distances,”
J. Biomed. Opt., 9 1143
–1151
(2004). https://doi.org/10.1117/1.1802171 1083-3668 Google Scholar
C. Zhu,
G. M. Palmer,
T. M. Breslin,
F. Xu, and
N. Ramanujam,
“Use of a multiseparation fiber optic probe for the optical diagnosis of breast cancer,”
J. Biomed. Opt., 10 024032
(2005). https://doi.org/10.1117/1.1897398 1083-3668 Google Scholar
M. G. Müller,
I. Georgakoudi,
Q. Zhang,
J. Wu, and
M. S. Feld,
“Intrinsic fluorescence spectroscopy in turbid media: disentangling effects of scattering and absorption,”
Appl. Opt., 40 4633
–4646
(2001). 0003-6935 Google Scholar
S. K. Chang,
D. Arifler,
R. Drezek,
M. Follen, and
R. Richards-Kortum,
“An analytical model to describe fluorescence spectra of normal and pre-neoplastic epithelial tissue: comparison with Monte Carlo simulations and clinical measurements,”
J. Biomed. Opt., 9 511
–522
(2004). https://doi.org/10.1117/1.1695559 1083-3668 Google Scholar
J. C. Finlay and
T. H. Foster,
“Hemoglobin oxygen saturations in phantoms and in vivo from measurements of steady-state diffuse reflectance at a single, short source-detector separation,”
Med. Phys., 31 1949
–1959
(2004). https://doi.org/10.1118/1.1760188 0094-2405 Google Scholar
J. C. Finlay and
T. H. Foster,
“Recovery of hemoglobin oxygen saturation and intrinsic fluorescence with a forward-adjoint model,”
Appl. Opt., 44 1917
–1933
(2005). https://doi.org/10.1364/AO.44.001917 0003-6935 Google Scholar
R. L. P. van Veen,
A. Amelink,
M. Menke-Pluymers,
C. van der Pol, and
H. J. C. M. Sterenborg,
“Optical biopsy of breast tissue using differential path-length spectroscopy,”
Phys. Med. Biol., 50 2573
–2581
(2005). 0031-9155 Google Scholar
P. R. Bargo,
S. A. Prahl,
T. T. Goodell,
R. A. Sleven,
G. Koval,
G. Blair, and
S. L. Jacques,
“In vivo determination of optical properties of normal and tumor tissue with white light reflectance and an empirical light transport model during endoscopy,”
J. Biomed. Opt., 10 034018
(2005). https://doi.org/10.1117/1.1921907 1083-3668 Google Scholar
D. C. Walker,
B. H. Brown,
A. D. Blackett,
J. Tidy, and
R. H. Smallwood,
“A study of the morphological parameters of cervical squamous epithelium,”
Physiol. Meas, 24 121
–135
(2003). 0967-3334 Google Scholar
T. Collier,
D. Arifler,
A. Malpica,
M. Follen, and
R. Richards-Kortum,
“Determination of epithelial tissue scattering coefficient using confocal microscopy,”
IEEE J. Sel. Top. Quantum Electron., 9 307
–313
(2003). https://doi.org/10.1109/JSTQE.2003.814413 1077-260X Google Scholar
J. Qu,
C. MacAulay,
S. Lam, and
B. Palcic,
“Optical properties of normal and carcinomatous bronchial tissue,”
Appl. Opt., 33 7397
–7405
(1994). 0003-6935 Google Scholar
S. Prahl,
“Optical absorption of hemoglobin,”
(1999) http://omlc.ogi.edu/spectra/hemoglobin/ Google Scholar
I. V. Meglinski and
S. J. Matcher,
“Quantitative assessment of skin layers absorption and skin reflectance spectra simulation in the visible and near-infrared spectral regions,”
Physiol. Meas, 23 741
–753
(2002). 0967-3334 Google Scholar
S. L. Jacques,
“Skin optics,”
(1998) http://omlc.ogi.edu/news/jan98/skinoptics.html Google Scholar
I. S. Saidi,
“Transcutaneous optical measurement of hyperbilirubinemia in neonates,”
Rice University,
(1992). Google Scholar
R. Drezek,
K. Sokolov,
U. Utzinger,
I. Boiko,
A. Malpica,
M. Follen, and
R. Richards-Kortum,
“Understanding the contributions of NADH and collagen to cervical tissue fluorescence spectra: modeling, measurements, and implications,”
J. Biomed. Opt., 6 385
–396
(2001). https://doi.org/10.1117/1.1413209 1083-3668 Google Scholar
C. Brookner,
U. Utzinger,
M. Follen,
R. Richards-Kortum,
D. Cox, and
E. N. Atkinson,
“Effects of biographical variables on cervical fluorescence emission spectra,”
J. Biomed. Opt., 8 479
–483
(2003). https://doi.org/10.1117/1.1578642 1083-3668 Google Scholar
J. R. Mourant,
I. J. Bigio,
D. A. Jack,
T. M. Johnson, and
H. D. Miller,
“Measuring absorption coefficients in small volumes of highly scattering media: source-detector separations for which path lengths do not depend on scattering properties,”
Appl. Opt., 36 5655
–5661
(1997). 0003-6935 Google Scholar
J. M. Schmitt and
G. Kumar,
“Turbulent nature of refractive-index variations in biological tissue,”
Opt. Lett., 21 1310
–1312
(1996). 0146-9592 Google Scholar
R. A. Drezek,
T. Collier,
C. K. Brookner,
A. Malpica,
R. Lotan,
R. R. Richards-Kortum, and
M. Follen,
“Laser scanning confocal microscopy of cervical tissue before and after application of acetic acid,”
Am. J. Obstet. Gynecol., 182 1135
–1139
(2000). https://doi.org/10.1067/mob.2000.104844 0002-9378 Google Scholar
A. J. Bailey,
R. G. Paul, and
L. Knott,
“Mechanisms of maturation and ageing of collagen,”
Mech. Ageing Dev., 106 1
–56
(1998). 0047-6374 Google Scholar
L. G. Koss, Diagnostic Cytology and Its Histopathologic Bases,
(1992) Google Scholar
M. C. Skala,
G. M. Palmer,
C. Zhu,
Q. Liu,
K. M. Vrotsos,
C. L. Marshek-Stone,
A. Gendron-Fitzpatrick, and
N. Ramanujam,
“Investigation of fiber-optic probe designs for optical spectroscopic diagnosis of epithelial pre-cancers,”
Lasers Surg. Med., 34 25
–38
(2004). https://doi.org/10.1002/lsm.10239 0196-8092 Google Scholar
L. Nieman,
A. Myakov,
J. Aaron, and
K. Sokolov,
“Optical sectioning using a fiber probe with an angled illumination-collection geometry: evaluation in engineered tissue phantoms,”
Appl. Opt., 43 1308
–1319
(2004). https://doi.org/10.1364/AO.43.001308 0003-6935 Google Scholar
A. M. J. Wang,
J. E. Bender,
J. Pfefer,
U. Utzinger, and
R. A. Drezek,
“Depth-sensitive reflectance measurements using obliquely oriented fiber probes,”
J. Biomed. Opt., 10 044017
(2005). https://doi.org/10.1117/1.1989335 1083-3668 Google Scholar
R. A. Schwarz,
D. Arifler,
S. K. Chang,
I. Pavlova,
I. A. Hussain,
V. Mack,
B. Knight,
A. M. Gillenwater, and
R. Richards-Kortum,
“Ball lens coupled fiber-optic probe for depth-resolved spectroscopy of epithelial tissue,”
Opt. Lett., 30 1159
–1161
(2005). 0146-9592 Google Scholar
D. Arifler,
R. A. Schwarz,
S. K. Chang, and
R. Richards-Kortum,
“Reflectance spectroscopy for diagnosis of epithelial precancer: model-based analysis of fiber-optic probe designs to resolve spectral information from epithelium and stroma,”
Appl. Opt., 44 4291
–4305
(2005). https://doi.org/10.1364/AO.44.004291 0003-6935 Google Scholar
|