
|
|
1.IntroductionFunctional imaging with high spatial and temporal resolution is required to investigate coherent interactions of neurons in complex neural networks. A number of methodologies, e.g., electroencephalograph (EEG), magnetoencephalograph (MEG), and functional megnetic resonance imaging (fMRI), allow the recording of dynamic activation patterns from large neural populations. Although each approach provides information about neural activation, each has limitations. Multielectrode array (MEA) systems allow the study of neural activation in isolated retina1 and other neural tissues, but spatial resolution is limited by the electrode distance, typically . From a neuroscience perspective, the retina is the most accessible outpost of the brain. The retina is a complex neural tissue, composed of a variety of neurons. The first layers of retina consisting of the photoreceptors, horizontal, bipolar, and some amacrine cells, are somewhat specialized neurons responding with analog changes in membrane potential, but they are excitable neuronal cells that operate according to the same basic mechanisms of other neurons. The output layer of the retina, the ganglion cells, are rather generic neurons that spike in a manner very similar to most other neurons of the central and peripheral nervous systems. The electroretinogram (ERG) has been used for many years to estimate electrophysiological function of the whole retina, by measuring the summed electrophysiological responses of retinal neurons to a visible light flash. The ERG response typically consists of a negative-going a-wave, followed by a positive-going b-wave. The a-wave generally is associated with photoreceptor activity, while the b-wave is ascribed to the action of bipolar cells and other inner retinal neurons. Functional defects of the retina may be detected by abnormal amplitudes and time courses of a- and b-waves. While the ERG measurement is a simple and useful test, clinical and research applications are limited by the absence of spatial information. The multifocal ERG (mfERG) technique,2 based on traditional ERG measurement coupled with sequences of structured stimulation, can provide 2-D maps of retinal function. Recent mfERG investigations have demonstrated the feasibility of early diagnostics of retinal pathology by measurement of electrophysiological function.3 This provides important advantages over traditional diagnostic methodologies of eye disease, e.g., ophthalmoscope and fundus imaging, which mainly detect abnormal morphological changes associated with nonreversible visual losses. Early detection of eye diseases can substantially enhance opportunities to prevent or treat visual impairments. However, applications of the mfMEG are limited by its low spatial resolution and impracticability of 3-D imaging. Given the delicate, complex structure of the retina with layered cell types and functional specialization, fast 3-D imaging of retinal function is desirable for investigation of dynamic visual processing, screening of eye diseases, and monitoring of clinical treatments. Recently emerging techniques for visual prosthesis also require advanced methodology for fast, reliable validation of electromagnetic stimulation of the retina.1, 4 Optical methods might provide important technical advantages over traditional electrophysiological techniques. Optical recording of retinal function can be noninvasive, offering high spatial resolution, wide field of view, and 3-D imaging capability. A variety of voltage-sensitive dyes or ion-selective indicators have been developed to allow optical imaging of dynamic neural activation. However, phototoxicity of the dyes and the difficulty of loading procedures limit their application, especially in human subjects. Indicators based on proteins that can be expressed within cells address some problems, but still pose major issues for in-vivo research and clinical applications. Intrinsic optical changes 5, 6, 7, 8, 9 associated with metabolic changes, blood flow, or hemoglobin oxygenation can be used for noninvasive imaging, but these signals are relatively slow and do not provide direct information on neural activation dynamics. Fast intrinsic optical changes in scattering and polarization, closely associated with action potentials and postsynaptic potentials, have also been observed in neural tissues. 10, 11, 12, 13, 14, 15, 16 Imaging of these fast intrinsic optical responses holds promising technical advantages over single and multichannel electrophysiological techniques for dynamic measurements of visual processing, and early functional diagnostics of visual system diseases. Optical methods should also have utility for the monitoring of the treatment of eye diseases, and the validation and characterization of electrical stimulation paradigms employed by emerging prosthetic implant technology. However, to date, practical applications of fast intrinsic optical signals for dynamic neural imaging have been limited by the small size of the signals and limited signal-to-noise ratio (SNR). Typically, hundreds or even thousands of averages were required for imaging fast intrinsic optical responses.13, 16 Averaging techniques improve the SNR for measurement of small signals in the presence of noisy, high background intensity. However, averaging of multiple experimental passes is a time-consuming procedure. In addition, given the requirement for multiple measurements with repeated stimulus, at least some components of dynamic optical responses may be reduced, changed, or lost because of the imperfection of synchronization for stimulations, degradation of neural tissues over time, and the possibility that some fast stimulus-evoked signals may vary in phase relative to the stimulus in individual passes. Past investigations have demonstrated the feasibility of imaging slow intrinsic optical responses of the visual system. 17, 18, 19, 20 Although fast intrinsic optical responses have been observed in photoreceptors,21, 22, 23 those signals appear specifically associated with the transduction process; responses can be observed in preparations of isolated photoreceptors with leaky plasma membranes. A modified fundus camera24, 25 has been demonstrated for in-vivo measurement of intrinsic optical responses in retina, but these optical signals were slow and may be related to metabolic changes of the visual system. We and others have demonstrated the use of functional optical coherence tomography (OCT) to measure intrinsic optical responses for retina.15, 26, 27 However, practical application of these intrinsic optical responses is still limited by small amplitude and low SNR of interesting signals. Our recent investigations indicate that the SNR of functional optical measurements of the retina can be improved through optimized illumination in the NIR and improved optical design.28, 29 We demonstrate the feasibility of imaging fast intrinsic optical changes in activated isolated frog retina using bright-field, dark-field, and polarization imaging systems. High resolution charge-coupled device (CCD) imaging disclosed larger local fractional changes of optical responses. Fast imaging sequences showed evidence of multiple response components with both negative- and positive-going signals, with different timescales. Fast photodiode measurements typically disclosed an integrated dynamic optical response of whole retina in transmitted light at the level of . At single cell resolution, with conventional bright-field illumination, fast functional imaging disclosed maxima of optical responses . Dark-field imaging techniques further improved the sensitivity, with maxima of optical responses . Polarization imaging disclosed improvement of optical sensitivity similar to dark-field imaging, but we observed different optical patterns associated with neural activation. The biophysical mechanism(s) of fast optical responses in neurons are not well understood, and further investigation is needed to characterize the relationship of electrophysiological and optical signals. However, our previous experimental and modeling studies, and work by others suggest that cellular volume changes associated with the flow of ions and water across the cell membrane during neural activation can account for at least some observed fast intrinsic optical responses of neural tissue.14, 30, 31 2.Methods and MaterialsA NIR probe light was used to measure dynamic optical responses associated with neural activation in the retina (Fig. 1 ). For our earlier experiments, a fast photodiode was used to measure fast transmitted light changes during visible light-evoked neural activation. A high resolution 14-bit CCD was used for our later fast imaging measurements. Bright-field, dark-field, and cross-polarized illumination and detection systems were implemented in an effort to improve the sensitivity of optical measurement. Simultaneous electrophysiological measurements32 were conducted with a 60-channel multielectrode array (MEA) and amplifier system (MCS, ALA Scientific Instruments, Inc., Westbury, NY). Fig. 1Schematic diagram of experimental setup. During the measurement, a frog or salamander retina was illuminated continuously by a NIR light for recording dynamic optical changes, and a white light emitting diode (LED) was used to produce a visible light stimulus. Optical and electrical responses were measured simultaneously. Photodiode or CCD was used to record dynamic optical responses. At the dichroic beam splitter (DBS), the visible stimulus light was reflected and the NIR recording light was passed through. The NIR filter (NIRF) was used to cut off the visible light reflected from the retina and optics. The polarizer and analyzer were used for cross-polarized optical measurement. 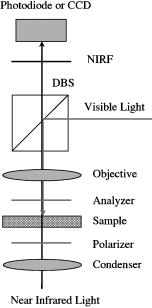 Leopard frogs Rana pipiens and tiger salamanders Ambystoma tigrinums were used for these experiments. The experiments were performed following protocols approved by the Institutional Animal Care and Use Committee of Los Alamos National Laboratory. During the experiments, the frog or salamander was rapidly euthanized by decapitation and double pithing before the eyes were removed. Surgery was conducted in a dark room with dim red light. The dissection was performed in Ringer’s solution containing (in mM): , , , , , 10 D-glucose.32 Typically, we first removed the intact eye, then hemisected the eye with fine scissors to remove the lens and anterior structures before removing the retina. Finally, the whole retina was transferred into the recording chamber. 3.Fast Transmitted Light Measurement Using a Fast PhotodiodeUsing a fast photodiode, we began dynamic transmission measurements from amphibian retina activated by a visible light flash. A superluminescent diode (SLD) with center wavelength at was used as the near-infrared (NIR) probe light for our earlier experiments. Dynamic optical responses were typically measured at the level of , where is the dynamic optical change and is the baseline background light intensity (Fig. 2 ). Although optical changes could be observed in single pass measurements (Fig. 2), tens of averages were typically required for recording clear, useful functional responses due to the low signal-to-noise ratio (SNR) of optical signals. Averaging is useful for SNR improvement. However, it is time consuming. In addition, some components of these dynamic optical responses associated with neural activation in retina may be reduced, changed, or lost, because of the degradation of retina or changes in light adaptation across time in multiple pass measurements. Better SNR was required for single pass, high performance optical measurement of neural activation in the retina. Fig. 2Dynamic transmitted light measurements using a NIR SLD. Top traces are optical responses and bottom traces are corresponding electrophysiological changes. (a) Dynamic light evoked optical responses in frog retina with a single pass measurement. A visible light flash was used to activate the frog retina. (b) Averaged dynamic light evoked optical responses in frog retina. The signals were averaged responses of 30 measurements with time interval of . For each trial, the frog retina was stimulated by a visible light flash. (c) Averaged dynamic light evoked optical responses in salamander retina. The signals were averaged responses of 30 measurements with time interval of . For each trial, the salamander retina was stimulated by a visible light flash. Vertical lines indicate the stimulation time. 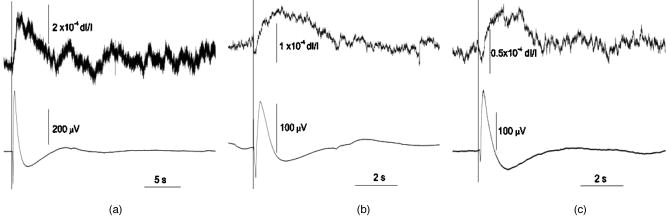 With only 15-nm bandwidth at full-width half maximum (FWHM), the SLD was a narrowband, coherent light. For any coherent light source, speckle noise can limit the SNR of optical measurement. We hypothesized that it might be practical to improve the SNR using a noncoherent NIR probe light. Our later experiments proved that the SNR of optical measurements using a broadband, noncoherent light source, i.e., NIR light emission diode (LED) or white lamp with NIR long-pass filter, was much better than earlier measurements with the NIR SLD. The improvement of SNR suggested that a noncoherent NIR light is desirable for highly sensitive optical measurement of neural activation. With the same photodiode detector for NIR SLD measurements, using a NIR LED with 200-nm FWHM, we routinely measured dynamic optical transmission responses in single passes, at the level of (Fig. 3 ) corresponding to a three- to five-fold increase in SNR. The optical responses increased corresponding to prolonged stimulus (Fig. 3) or enhanced light intensity.29 Our experiments using white light with a NIR filter also shows similar improvement of the SNR. High performance functional imaging of the retina using white light with a NIR filter (center wavelength ) is presented in the next section. Fig. 3Dynamic transmitted light measurements using a NIR LED. The optical (gray traces) and electrophysiological (black traces) responses were from single pass measurements. Bottom panel: the frog retina was activated by a visible light flash. Middle panel: the frog retina was activated by a visible light flash. Top panel: the frog retina was activated by a visible light flash. Vertical line indicates the time of visible light flash for stimulation. 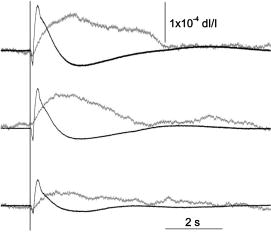 4.Fast Optical Imaging Using a High Resolution Charge-Coupled DeviceGiven the improved SNR of optical measurement, with bright-field illumination we were able to image the fast optical responses in single pass experiments with a fast commercial CCD camera (Fig. 4 ). Although the total transmitted NIR changes in light-activated retina were dominated by a positive optical response (Figs. 2 and 3), high resolution optical imaging sequences disclosed both positive and negative optical responses with larger fractional changes. At the single cell level, the maxima of both positive and negative responses were (Fig. 3), 2 or 3 orders of magnitude larger than observed in wide field transmitted light measurements with the photodiode. Although the functional imaging sequence showed optical responses with different polarities and timescales at a well localized area corresponding closely to the pentagonal shape of the stimulus light spot, the simultaneous MEA measurement showed similar electrophysiological responses over a larger area extending least from the edge of the activated region of the retina (Fig. 4). Fig. 4High resolution bright-field imaging of retinal responses to visible light stimulation. The frog retina was activated by a , pentagonal, visible light flash delivered with prestimulus baseline recording. (a) Each illustrated frame is an average over a one second interval with the average prestimulus baseline image subtracted. Raw frames were acquired at pixels, . The exposure time of the CCD camera was . Although 1-s image sequence blocks are averaged for presentation purposes, functional responses were clearly visible in individual frames in sequences of difference images. (b) Structure of retinal photoreceptor array. (c) Enlarged image of the fourth frame of top line. (d) Corresponding electrophysiological measurement of channels. For the MEA, the diameter of each electrode was , and the electrode distance was . Four of the electrodes can be seen in image (b) as dark blobs along the upper and lower edges of the anatomical image, two of which are aligned near the right edge of the image field. (e) Fast optical responses at resolution (average of 25 pixels). Vertical lines indicate the stimulation time. These traces show different polarities and timescales of optical responses.  The discrepancy of optical and electrical patterns related to neural activation may suggest that the optical responses provide better spatial sensitivity and resolution for monitoring of neural activation in the retina. The limited spatial resolution of electrophysiological responses may result from imperfect contacts between the electrodes and the retina. However, the electrical conductivities of Ringer solution and retinal tissue may also spatially blur the electrophysiological signals associated with neural activation. Dark-field imaging experiments show further improved fractional optical changes. In Fig. 5 , the strongest optical response is greater than at single cell resolution. Although the structure of optical responses in Figs. 4 and 5 show similar defined patterns over the pentagonal areas covered by the stimulus light, there are differences if we pay attention to the detailed structure and polarities of optical responses at specific locations. Although the optical responses were robust and detectable for several hours with repeated stimulation, the amplitudes of optical responses were reduced, and the pattern of neural activation spread gradually (Fig. 6 ). Polarization imaging disclosed similar improved optical sensitivity as dark-field imaging, but provided a better defined structure within the area covered by the stimulus light (Fig. 6). Fig. 5High resolution dark-field imaging of retinal responses to visible light stimulation. This measurement was performed after the experiment shown in Fig. 4 using the same frog retina. The same area of the retina was activated by a 100-ms, pentagonal, visible light flash delivered with 2-s prestimulus baseline recording. (a) Each illustrated frame is an average over a one second interval with the average prestimulus baseline image subtracted. Raw frames were acquired at pixels, . The exposure time of the CCD camera was . The stimulus was a 100-ms, pentagonal, visible light flash delivered with 2-s prestimulus baseline recording. (b) Structure of retina photoreceptor array. (c) Enlarged image of the fourth frame of top line. (d) Corresponding channel electrophysiological measurement. For the MEA, the diameter of each electrode was , and the electrode distance was . (e) Fast optical responses at resolution (average of 25 pixels). Vertical lines indicate the stimulation time. These traces show different polarities and timescales of optical responses.  Fig. 6Dark-field and polarization imaging of retinal functional responses. The frog retina was activated by a 1-s, pentagonal, visible light step delivered with a 2-s prestimulus baseline recording. Raw frames were acquired at pixels, . The exposure time of the CCD camera was . (a) Dark-field imaging from fresh retina. Each illustrated frame is an average of 100 framed over a one second interval with the average prestimulus baseline image subtracted. (b) A raw image shows structure of the retina photoreceptor matrix. (c) Enlarged picture of the fifth frame of (a). (d) The three measurements were performed after the experiment shown in (a) using the same retina and same experimental conditions. Top: dark-field imaging. The functional image sequence shows optical responses and their spread over time. Middle: cross-polarized imaging. Bottom: dark-field imaging. Each illustrated frame is an average of 100 frames over a one second interval with the average prestimulus baseline image subtracted. The top image sequence was recorded first and the following sequences (middle and bottom) were recorded at 2-min intervals.  5.DiscussionWe optimized NIR sources for transmitted light measurements of optical responses, initially using a photodiode detector. The improved NIR probe light sources allowed detection of optical responses in single passes. In contrast to the low SNR of coherent light (SLD) measurements, our experimental results with incoherent light show substantially improved SNR. Using the NIR SLD as a probe light, optical responses could be observed in single pass measurements, but tens of averages were typically required for recording useful dynamic transmitted light changes associated with neural activation in visible light-activated retina. Using an incoherent NIR LED, we routinely measured clear optical responses from single passes. Our choices of illumination wavelengths to date have been dictated by available sources or filters, but we have observed similar amplitude responses over a range of wavelengths from at least 750 to . Using a white light incandescent lamp coupled with a NIR filter, we imaged dynamic neural activation in isolated frog retina with a fast, high resolution (approximately microns), commercial CCD. We (and probably others) had avoided high resolution cameras in our previous work, reasoning that available high resolution instruments did not have the speed nor the dynamic range to capture the tiny signals observed in our photodiode studies. However, high resolution imaging significantly improved functional image contrast by resolving nearby areas of functional response with different polarities. Although the results reported here exploit the high-performance features of a 14-bit camera, the substantial enhancements of the functional signal should enable us to use even faster cameras by accepting some compromise in the required dynamic range. When the whole retina was activated by a visible light flash, a positive peak was typically observed in the optical response integrated over the entire recording area. High resolution imaging disclosed larger fractional responses in small local areas, and opposite response polarities were often observed in adjacent areas. Although the functional imaging sequence showed optical responses within a well localized area corresponding to the pentagonal shape of the stimulus light spot, the simultaneous electrophysiological measurement showed similar, electrical responses in a much larger area, extending at least from the edge of the region of the retina activated by the visible light stimulus. This suggests that the optical responses may provide better spatial sensitivity and resolution for imaging neural activation in retina. The limited spatial sensitivity of electrophysiological responses may partially result from the imperfect contacts of the electrical electrodes and the retina. However, electrical conductivities of the Ringer solution and the retinal tissue may easily spread the electrophysiological signals over a large area. At single cell resolution, bright-field imaging disclosed optical responses with maxima of . Dark-field imaging techniques further improved the sensitivity, with maxima of optical responses exceeding for fast functional imaging of neural activation in the retina. In principle, dark-field imaging only records the scattered light from objects observed, reducing the relative contribution of background light. The improved sensitivity supports our hypothesis that fast optical responses mainly represent light scattering changes corresponding to the swelling and shrinking of neurons.14, 30, 31 Cross-polarization techniques14 can also be used to reject high background intensity and increase sensitivity to scattered light. Our experiments with cross-polarized imaging showed promising results, with sensitivity and contrast similar to dark-field imaging (Fig. 6). Although the strongest optical responses in fresh retina were at the level of (Figs. 5 and 6), the amplitudes of neural activation reduced gradually to in (Fig. 6). In fresh retina, the dark-field patterns related to neural activation were well defined within the area covered by the visible stimulus light, but subsequent dark-field measurements disclosed the spreading of neural activation beyond the area covered by stimulus light (Fig. 6). These changes may result from metabolic changes or light adaptation of the retina. Polarization functional imaging was also implemented between two dark-field measurements (Fig. 6). Although obvious spreading of neural activation beyond the area covered by stimulus light was observed in dark-field imaging, the polarization imaging kept a consistent pattern over time (Fig. 6). We do not yet fully understand the relationship between dark-field, bright-field, and polarization responses in the retina. While these responses are similar in many respects and probably result from closely related mechanisms, we observed differences in the spatial and temporal patterns of these responses. Bright-field responses probably result from dynamic scattering changes, but might have a component of absorbance change due to cellular biochemistry. Dark-field responses have lower background intensity and presumably are dominated by transient scattered light changes. Even if the responses are due to the same underlying mechanism, we might observe differences due to the differing optical configurations used for these measurements. Previous studies have argued that polarization responses may result from molecular motions during neural activation.12 However, other work14, 30, 31 with isolated nerves suggests that both scattering and polarization optical responses may result from the volume changes of neurons due to water fluxes associated with ion movements during neural activation. In previous studies with a variety of tissues, we have observed that fast optical responses typically resemble the integral of the corresponding electrophysiological response.29 If all membrane charge carriers were equivalent, this pattern would not be expected; the optical response would be expected to look like a low-pass-filtered version of the electrical response. However, differences in the dynamics of sodium and potassium fluxes, the difference in the radius and volume of the hydrated ions ( is larger than ), and differences in the affinity of hydrogen bonding ( binding of water is weaker and bound water is lost during channel transit) may account for the characteristic deserved form of the optical response. We are exploring this idea with further experiments in simple neural systems. AcknowledgmentsThe authors thank David M. Rector and Beth Perry for help on this project. Financial support of this work was from the U.S. DOE under the auspices of the Artificial Retina Program. ReferencesA. E. Grumet,
J. L. Wyatt, and
J. F. Rizzo,
“Multi-electrode stimulation and recording in the isolated retina,”
J. Neurosci. Methods, 101 31
–42
(2000). 0165-0270 Google Scholar
D. C. Hood,
“Assessing retinal function with the multifocal technique,”
Prog. Retin Eye Res., 19 607
–646
(2000). 1350-9462 Google Scholar
Y. Han,
M. A Bearse,
M. E. Scheneck,
S. Barez,
C. H. Jacobsen, and
A. J. Adams,
“Multifocal electroretinogram delays predict sites of subsequent diabetic retinopathy,”
Invest. Ophthalmol. Visual Sci., 45 948
–954
(2004). 0146-0404 Google Scholar
J. D. Weiland,
W. T. Liu, and
M. S. Humayun,
“Retinal prosthesis,”
Annu. Rev. Biomed. Eng., 7 361
–401
(2005). 1523-9829 Google Scholar
B. Chance,
Q. Luo,
S. Nioka,
D. Alsop, and
J. Detre,
“Optical investigations of physiology: a study of intrinsic and extrinsic biomedical contrast,”
Philos. Trans. R. Soc. London, Ser. B, 352 707
–716
(1997). https://doi.org/10.1098/rstb.1997.0053 0962-8436 Google Scholar
S. Chen,
P. Li,
W. Luo,
H. Gong,
S. Zeng, and
Q. Luo,
“Time-varying spreading depression waves in rat cortex revealed by optical intrinsic signal imaging,”
Neurosci. Lett., 396 132
–136
(2006). 0304-3940 Google Scholar
Y. Hoshi,
I. Oda,
Y. Wada,
Y. Ito,
Y. Yutaka,
M. Oda,
K. Ohta,
Y. Yamada, and
T. Mamoru,
“Visuospatial imagery is a fruitful strategy for the digit span reflected task: a study with near-infrared optical tomography,”
Brain Res. Cognit. Brain Res., 3 339
–342
(2000). 0926-6410 Google Scholar
R. U. Maheswari,
H. Takaoka,
H. Kadono,
R. Homma, and
M. Tanifuji,
“Novel functional imaging technique from brain surface with optical coherence tomography enabling visualization of depth resolved functional structure in vivo,”
J. Neurosci. Methods, 124 83
–92
(2003). https://doi.org/10.1016/S0165-0270(02)00370-9 0165-0270 Google Scholar
M. Lazebnik,
D. L. Marks,
K. Potgieter,
R. Gillette, and
S. A. Boppart,
“Functional optical coherence tomography for detecting neural activity through scattering changes,”
Opt. Lett., 28 1218
–1220
(2003). 0146-9592 Google Scholar
I. Tasaki,
A. Watanabe,
R. Sandlin, and
L. Carnay,
“Changes in fluorescence, turbidity, and birefringence associated with nerve excitation,”
Proc. Natl. Acad. Sci. U.S.A., 61 883
–888
(1968). 0027-8424 Google Scholar
L. B. Cohen,
R. D. Keynes, and
B. Hille,
“Light scattering and birefringence changes during nerve activity,”
Nature (London), 218 438
–441
(1968). 0028-0836 Google Scholar
D. Landowne,
“Molecular motion underlying activation and inactivation of sodium channels in squid giant axons,”
J. Membr. Biol., 88 173
–185
(1985). https://doi.org/10.1007/BF01868431 0022-2631 Google Scholar
D. M. Rector,
G. R. Poe,
M. P. Kristensen, and
R. M. Harper,
“Light scattering changes follow evoked potentials from hippocampal Schaeffer collateral stimulation,”
J. Neurophysiol., 78 1707
–1713
(1997). 0022-3077 Google Scholar
X. C. Yao,
A. Foust,
D. M. Rector,
B. Barrowes, and
J. S. George,
“Cross-polarized reflected light measurement of fast optical responses associated with neural activation,”
Biophys. J., 88 4170
–4177
(2005). 0006-3495 Google Scholar
X. C. Yao,
A. Yamauchi,
B. Perry, and
J. S. George,
“Rapid optical coherence tomography and recording scattering changes from activated frog retina,”
Appl. Opt., 44 2019
–2023
(2005). https://doi.org/10.1364/AO.44.002019 0003-6935 Google Scholar
D. M. Rector,
R. F. Rogers,
J. S. Schwaber,
R. M. Harper, and
J. S. George,
“Scattered-light imaging in vivo tracks fast and slow processes of neurophysiological activation,”
Neuroimage, 14 977
–994
(2001). 1053-8119 Google Scholar
H. Ripps,
L. I. Mehaffey, and
I. M. Siegel,
“Rapid regeneration in the cat retina: a case for spreading depression,”
J. Gen. Physiol., 77 335
–346
(1981). 0022-1295 Google Scholar
P. J. DeLint,
T. T. Berendschot,
J. van de Kraats, and
D. van Norren,
“Slow optical changes in human photoreceptors induced by light,”
Invest. Ophthalmol. Visual Sci., 41 282
–289
(2000). 0146-0404 Google Scholar
M. A. Duarte,
A. C. Almeida,
A. F. Infantosi, and
J. W. Bassani,
“Functional imaging of the retinal layers by laser scattering: an approach for the studyof Leaõ’s spreading depression in intact tissue,”
J. Neurosci. Methods, 123 139
–151
(2003). 0165-0270 Google Scholar
M. D. Abramoff,
Y. H. Kwon,
D. Ts’o,
P. Soliz,
B. Zimmerman,
J. Pokorny, and
R. Kardon,
“Visual stimulus-induced changes in human near-infrared fundus reflectance,”
Invest. Ophthalmol. Visual Sci., 47 715
–721
(2006). https://doi.org/10.1167/iovs.05-0008 0146-0404 Google Scholar
H. H. Harary,
J. E. Brown, and
L. H. Pinto,
“Rapid light-induced changes in near infrared transmission of rods in bufo marinus,”
Science, 202 1083
–1085
(1978). 0036-8075 Google Scholar
D. R. Pepperberg,
M. Kahlert,
A. Krause, and
K. P. Hofmann,
“Photonic modulation of a highly sensitive, near-infrared light-scattering signal recorded from intact retinal photoreceptors,”
Proc. Natl. Acad. Sci. U.S.A., 85 5531
–5535
(1988). 0027-8424 Google Scholar
M. Kahlert,
D. R. Pepperberg, and
K. P. Hofmann,
“Effect of bleached rhodopsin on signal amplification in rod visual receptors,”
Nature (London), 345 537
–539
(1990). 0028-0836 Google Scholar
K. Tsunoda,
Y. Oguchi,
G. Hanazono, and
M. Tanifuji,
“Mapping cone- and rod-induced retinal responsiveness in macaque retina by optical imaging,”
Invest. Ophthalmol. Visual Sci., 45 3820
–3826
(2004). https://doi.org/10.1167/iovs.04-0394 0146-0404 Google Scholar
E. S. Barriga,
D. T’so,
M. Pattichis,
Y. Kwon,
R. Kardon,
M. Abramoff, and
P. Soliz,
“Detection of low-amplitude in vivo intrinsic signals from an optical imager of retinal function,”
Proc. SPIE, 6138 66
–77
(2006). 0277-786X Google Scholar
K. Bizheva,
R. Pflug,
B. Hermann,
B. Povazay,
H. Sattmann,
P. Qiu,
E. Anger,
H. Reitsamer,
S. Popov,
J. R. Taylor,
A. Unterhuber,
P. Ahnelt, and
W. Drexler,
“Optophysiology: depth-resolved probing of retinal physiology with functional ultrahigh-resolution optical coherence tomography,”
Proc. Natl. Acad. Sci. U.S.A., 103 5066
–5071
(2006). https://doi.org/10.1073/pnas.0506997103 0027-8424 Google Scholar
V. J. Srinivasan,
M. Wojtkowski,
T. H. Ko,
J. S. Duker,
A. Clermont,
S. Bursell, and
J. G. Fujimoto,
“Noninvasive in vivo measurement of retinal physiology with high-speed ultrahigh resolution OCT,”
Proc. SPIE, 6138 82
–90
(2006). 0277-786X Google Scholar
X. C. Yao and
J. S. George,
“Fast optical recording of light-flash evoked neural activation in amphibian retinas,”
Proc. SPIE, 5920 229
–236
(2005). 0277-786X Google Scholar
X. C. Yao and
J. S. George,
“Dynamic neuroimaging of retinal light responses using fast intrinsic optical signals,”
Neuroimage, 1053-8119 Google Scholar
X. C. Yao,
D. M. Rector, and
J. S. George,
“Optical lever recording of displacements from activated lobster nerve bundles and Nitella internodes,”
Appl. Opt., 42 2972
–2978
(2003). 0003-6935 Google Scholar
T. Akkin,
D. P. Dave,
T. T. Milner, and
H. G. Rylanser,
“Detection of neural activation using phase-sensitive optical low-coherence reflectometry,”
Opt. Express, 12 2377
–2386
(2004). https://doi.org/10.1364/OPEX.12.002377 1094-4087 Google Scholar
M. Meister,
J. Pine, and
D. A. Baylor,
“Multi-neuronal signals from the retina: acquisition and analysis,”
J. Neurosci. Methods, 51 95
–106
(1994). https://doi.org/10.1016/0165-0270(94)90030-2 0165-0270 Google Scholar
|


