|
|
1.IntroductionExcimer laser systems designed to ablate the corneal surface for the purpose of changing the refractive power of the eye were being tested as early as 1986.1 At the time, it was assumed that the energy distribution in the laser beam determined the profile of the ablation on the cornea,2 and therefore, a uniform laser beam would produce uniform ablation depth.3 This assumption appeared to be true for some plastic materials and for eyes dehydrated from dry nitrogen blown over their surfaces during surgery. The blowing of dry nitrogen was discontinued during early clinical studies because it increased corneal haze. Thereafter, surgeons operated on normally hydrated eyes. Although corneal haze was reduced, many early patients reported visual disturbances such as glare and halos.4, 5 These symptoms correlated with topographic patterns of central undercorrection termed “central islands.”6 Consequently, the laser ablation algorithms were modified to lessen or eliminate the problem of central undercorrection.7 The algorithm adjustments solved the problem in practice, but the physical cause of central underablation has not been explained satisfactorily. Although the problem of central islands is no longer a matter of clinical concern, a more thorough understanding of all factors affecting interaction of laser with corneal tissue is important for the continuing improvement of laser refractive surgery. To date, four principal hypotheses have been advanced to explain the phenomenon of nonuniform ablation: (1) pooling of water in the center of the corneal ablation,4, 8, 9 (2) redeposition of ablated material on the cornea,9, 10, 11 (3) partial blockage of the laser beam by the residue from the plume of the previous pulse,4 and (4) an ablation model that depends upon the distance from the edge of the ablation.7, 12 The exact contribution of each to nonuniform ablation is not completely understood. The most extensive research into the cause of central underablation was conducted by Noack, 10 who concluded that central particle redeposition from the mushroom-shaped cloud that formed over the ablated area was a major cause of central underablation. Large beam sizes (up to in diameter) were used in their experiments. Although this hypothesis accounted for a higher density of material over the center of the ablated area, there was no evidence that material redeposited more thickly in the central area. Nor does the theory account for the uniform ablation of dehydrated corneas. For the study described here, specific experiments were designed to test the redeposition theory, and the results reinforced the concept that within the area of ablation, there is a relationship between rate of ablation and distance from the edge of the ablation. Additional experiments were conducted to determine the relationship of ablation profile to fluence. Additionally, dehydrated corneas were ablated and the craters measured to assess the impact of hydration independent of using the method of blowing dry nitrogen across the surface concurrent with ablation. The response of living rabbit eyes and living human eyes to ablation by excimer laser is similar enough to the response of enucleated porcine eyes to justify using enucleated porcine eyes as a model of ablation characteristics in vivo. The variations in ablation depths are similar in shape in all three, but, due to greater hydration, the enucleated eyes ablate deeper at the edges than the living eyes. The amplitude of the underablation in the enucleated eyes is about twice as much as in the living eyes.7, 13 2.Materials and Methods2.1.Laser Ablation ProfilesTo model ablation dynamics in corneas, measurements were taken of porcine eyes, which were enucleated approximately prior to experimental use, having been stored on ice during delivery. Each eye was prepared by cleaning excess connective tissue and by mechanically debriding the epithelial surface layer. Globes were stored together in a humid environment until they reached equilibrium with room temperature. Although the ablation response at room temperature may differ slightly from that at physiological temperatures, the rate of energy deposited into the tissue has been clinically designed to keep the temperature rise during ablation well below the point of thermal denaturing of collagen. The eyes produced by this process are stable, but overly hydrated compared to living rabbit or human eyes. For each measurement, eyes were quickly transferred from the holding container to a fixture, which supported the globe under the laser. Intraocular pressure was controlled by injecting saline solution. Ablation craters ranging from 1.0 to in diameter were made using a VISX Excimer Laser System (Santa Clara, California) with the standard fluence of and pulse-to-pulse variations that are within 2%. The ablations were performed with the corneas at the treatment plane of the laser, which is slightly below the focal point of the laser beam. At this plane, the beam profile is shaped like a top hat with rounded edges and is uniform to within 5% over the central 90%. One hundred pulses were fired at . The ablation depth profile was normalized by the number of pulses and averaged for 10 eyes ablated with the same diameter ablation. Five dehydrated corneas were included in the study for comparison. Globes that had been prepared for experimental use as described above were set aside for desiccation. The corneal stroma was excised from the globe, rinsed with saline solution, and placed on a curved surface to which to adhere while drying. Each cornea was placed in an enclosed container with crystals (Hammond Drierite) for approximately . Although there still may have been some residual water, these corneas were considered dehydrated because it was significantly different from the hydrated samples, which had endured slight water uptake placing them above the approximate 70% normal physiological water content level. No gas was blown across the cornea during the ablation. Additional ablation profiles were taken of hydrated corneas in which the beam diameter was fixed at while the fluence level varied from 60 to . With the laser operating in its standard clinical mode, 132 pulses were fired for each fluence level. Fluence was measured and calibrated according to standard calibration techniques. A logarithmic fit of the depth-per-pulse data as a function of fluence was used to determine the ablation threshold . A linear regression of the data in the format of Beer’s law was used to calculate the absorption coefficient of the cornea Finally, measurements at the laser focal plane were taken with and without an opaque mask placed across the laser aperture. Two mask sizes were used—0.5- and 1.0-mm wide—on a 6.5-mm ablation. The ablations were performed at the focal plane of the laser to ensure that the mask was imaged sharply. In all cases, the beam profile is uniform to within 5% across the entire area that is not masked within the circular aperture while the pulse-to-pulse variation in delivered energy remained within 2%. The plume evacuator and the temporal integrator were inactivated to maximize the potential for plume redeposition and to minimize image motion. The ablation sequences consisted of 100 pulses fired at . An optical profilometer7 was used to measure the profile of each ablation crater made on hydrated tissue. Surface profilometry using a stylus-based device does not capture as accurate of a measurement because of the much lengthier acquisition time and the noise associated with tracing a pliant, hydrate cornea with a rigid tip. The optical profilometer uses collimated light passing across the surface of the cornea for capture by a high-resolution digital camera (Kodak MegaPlus 10/4i, Eastman Kodak). The images taken before and after the ablation were aligned beyond the unablated edges, and the differences were calculated to obtain a profile of the ablation shape. The profilometer utilizes image processing techniques to provide submicron accuracy when good data are acquired, which has been validated by independent metrology devices and standardized reference surfaces. Due to increased surface irregularities, a stylus profilometer (Taylor Hobson PGI 820) was used to directly trace the surface of the dehydrated corneal ablation. The dynamics of dry ablation does not allow for a clean optical measurement across the surface. To obtain the effective crater shape, the preablation surface was matched to the postablation surface with registration software. The Taylor Hobson device specifies a depth resolution that is on the order of . 2.2.Plume DynamicsEnucleated porcine eyes were ablated under different lighting conditions with a 6.5-mm zone, both with and without a 0.5-mm opaque mask across the center of the ablation zone. High-speed digital images of the ablation plume were captured with a Dalsa CA-D6 at a frame rate of approximately . Although this detection system is unable to record the initial shockwave and events within the limits of the camera speed, it is the dynamics that occur on the order of several microseconds that are of interest in this study. Sixty frames were captured in between laser pulses fired at . White-light fiber optic illuminators were positioned laterally and above the eye so that light would scatter off the plume particles into the camera. Spherical surfaces of polymethyl methacrylate (PMMA) were ablated with and without the opaque mask for comparison with the results of Noack 10 3.Results3.1.Laser Ablation ProfilesCharacteristic patterns of central underablation were present in the ablation craters made on the porcine eyes. Figure 1 shows a series of ablation profiles from enucleated porcine eyes made with a uniform 193-nm laser beam with the fluence fixed at . The crater diameters ranged from 1.0 to . The depths of these profiles vary significantly between the edge and center of the circular ablation with the largest crater having only 40% of the ablation depth in the center compared to the edge. Fig. 1Average depth-per-pulse ablation profiles performed on porcine corneal tissue at . The series of lines represents aperture sizes of 1, 1.4, 2, 3, 4, 5, 6, and , proceeding outward from the center. 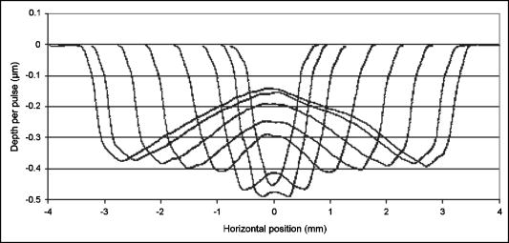 Ablation profiles of different diameters exhibited the following characteristics:
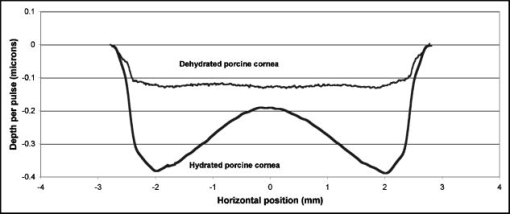
Figure 2 shows that the ablation of the dehydrated cornea was uniform to within less than 10% over the 5-mm area with no central underablation compared with a central underablation of 50% in the hydrated cornea. The absolute ablation of the dehydrated cornea was only 37% as deep as the ablation at the edge of the hydrated cornea. However, as reported by Dougherty, 14 if the cornea is rehydrated, the tissue expands, and the ablation upon expansion is deeper than the ablation in the hydrated cornea. 3.2.Variable FluenceThe ablation profiles of the corneas ablated with fixed diameters and varying fluence showed that the shapes varied as a function of fluence levels. Figure 3 is a plot of the profiles of ablation craters made by a 5-mm beam with fluence levels of 62 to . At the highest fluence levels, the depth of the pattern at the edge is and at the center is . As the fluence level decreased, both the edge and the center ablation decreased until, at a fluence less than , the center ablation reached a constant level of about (here, the central ablation is less than 30% of the ablation at the edge). As the fluence decreased below this critical level, the central area of uniform ablation widened while the rate of change in ablation depth just outside this area and extending to the outer edges was nearly constant for the different fluence levels. Fig. 3Ablation profiles for a 5-mm diameter spot as a function of applied fluence. The top profile corresponds to the lowest energy and progresses downward with increasing energy. 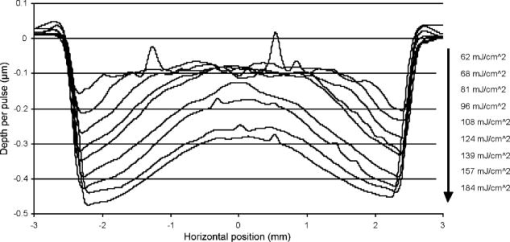 The ablation depths at the edges of the craters, as defined by the points of maximum depth in Fig. 3, were plotted as a function of fluence in Fig. 4 . Using this curve and applying Beer’s law, the threshold fluence was and the absorption coefficient was calculated to be . The value of the absorption coefficient is in close agreement with the values published by Pettit and Ediger.15 The threshold fluence should correspond to values obtained using very small beam sizes . Fig. 4Ablation rates of porcine cornea as a function of fluence based on two different metrics: ablation depth at the edges and ablation depth at the center. 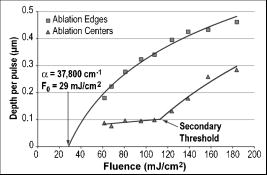 Figure 4 also shows a plot of the central ablation depths as a function of fluence. As the fluence increased from 60 to there was no significant increase in ablation in the center. As the fluence increased above , the depth of the ablation increased at both the edge and at the center. This pattern represented a secondary ablation threshold for the center of the ablation zone. For any point between the edge and the center, there is a corresponding secondary threshold with a corresponding fluence between 60 and . From Fig. 3, the distance from the edge of the ablation to the intersection between the average of the line sloping up from the edge and the line (the depth of uniform central ablation) was determined for different fluence levels. Figure 5 , which plots the six lowest fluence levels, shows that this distance has a linear relationship with the fluence. Using the velocity of sound in water as a factor, the right hand coordinate converts the distance from the intersection to the edge into time. For the given fluence range, the time ranges from 0.5 to . Fig. 5The six lowest fluence levels in Fig. 3 are shown in this graph, which plots the distance from the edge of the ablation to the point where the average depth of the sloping portion of the ablation intersects with the horizontal portion of the ablation. This plot shows the distance to be a linear function of fluence. Using the speed of sound in water , the distances correspond to the propagation time shown on the right coordinate for energy to propagate from the edge to the point of intersection. 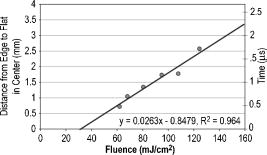 3.3.Ablation Profiles with Opaque MasksThe ablation profiles for the 6.5-mm ablation zone with opaque masks 0.5- and 1.0-mm wide projected across the center are shown in Fig. 6 . For comparison, the ablation profile for the same diameter zone without an opaque mask is shown as a dotted line. The profiles were taken from single eyes. The ablation depths at the edge of the zone were not changed by the presence of the opaque masks. However, the ablation depths adjacent to the images of the opaque masks were more than twice as deep as the profile with no mask. The point of minimum ablation in both masked cases was located approximately halfway between the edge of the ablation zone and the edge of the image of the opaque masks. The slope of the ablation profile from the outer edge is similar in all three cases. The ablation made with the 0.5-mm mask shows an upward shift of the central , which could be due to the effect of the collagen fibrils splaying apart, acoustic energy transmitting through the thin, unablated area, or some debris being deposited in the central area. Fig. 6Comparing average depth-per-pulse profiles of a 6.5-mm diameter ablation on porcine cornea with and without a central opaque mask. The solid bold line represents results from the 0.5-mm masking; the thin gray line represents results from the 1.0-mm masking; and the dotted line shows the standard 6.5-mm ablation profile with no mask. 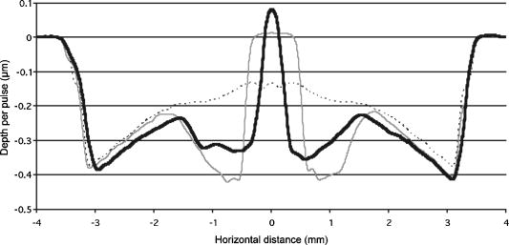 3.4.Video Images of Ablation Plumes (PMMA)Video images with and without an opaque mask were made of the ablation plume from PMMA spherical surfaces with a radius of curvature similar to that of the eye. The images without the mask were very similar to the images published by Noack 10 Figure 7 (upper panel) shows a series of three images taken at 1.5-ms intervals. There was no synchronization between the laser pulse and the first image. The first image was selected based on the lowest plume height. It is estimated that this image was taken less than after the laser pulse. The plume rapidly collapses into a narrow column by . A series of images from the PMMA ablation with the opaque mask in place are shown in the lower panel of Fig. 7. The velocity of the plume was slower and the column of the plume was larger. The plume shows a split between the two halves in the upper part, but the column is concentrated over the center of the entire ablation area. Fig. 7Dynamics of ejected material from a 6.5-mm ablation on curved PMMA surface. The upper panel shows results with no mask. The lower panel shows results with a 0.5-mm opaque mask. Each frame represents an interval of . The bar in the first frames is the width of the laser beam. The images are negative. 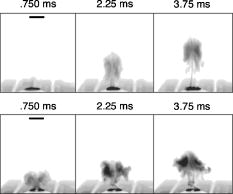 3.5.Video Images of Ablation Plume (Porcine Eyes)The images of the ablation plume, which consists mostly of water droplets,16 from the porcine eye are shown in the upper panel of Fig. 8 and are similar to the images published by Noack 10 The ablation plume generated from the porcine eye travels at higher velocity than the plume generated from PMMA. Fig. 8Dynamics of material ejected from a 6.5-mm diameter ablation on porcine cornea. The upper panel shows results with no mask. The lower panel shows results with a 0.5-mm opaque mask. Each frame represents an interval of 1.5-ms. The bar shown in each of the first frames is the width of the laser beam. The images are negative. 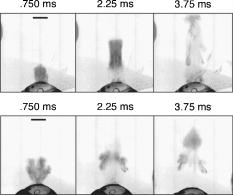 The vertical plume from the porcine eyes appeared to rise uniformly over the entire surface. It did not form as tight a column as the plume from the PMMA. As shown in the lower panel of Fig. 7, the velocity of the ablation plume decreased slightly in the presence of the opaque mask. There was no evidence of the plume splitting into two columns. The strongest plume column remained centered over the entire ablated area. 4.DiscussionWhile refinements to system calibration techniques continue to improve the consistency in delivered energy, the variability in the corneal substrate itself is likely to be the major cause of deviations in ablation performance. To address this issue, we have conducted experiments to elucidate which aspects or properties of tissue ablation relate most significantly to the magnitude of the central underablation. Two different experimental methods were employed to ablate porcine corneas: (1) constant fluence level with varying diameters, and (2) constant diameter with varying fluence levels. Under method 1, with ablation diameters ranging from 1.0 to , the central underablation increased with a nearly constant slope away from the edge. The ablation at the center of the largest diameter was only 40% of the deepest ablation at the edge. When the diameter was or less, the ablation at the edge was 20% greater than the ablation at the edge of the larger diameter. There was no sign of significant central underablation in the dehydrated corneas. Careful observation of the ablation patterns of different diameters reveals characteristics that are not easily explained by plume redeposition alone. The experiments reported in this paper were intended to have a minimum effect on plume dynamics while producing significant changes in the ablation characteristics. The video images of the plume showed that a central column forms whether or not the narrow opaque mask is in place, yet the ablation profiles of masked and unmasked ablations are radically different. With the mask, the ablation near the center of the 6.5-mm area is up to 120% deeper. The slope of the ablation profile near the central edge bounded by the mask is similar to the slope near the edge of the ablation, which further indicates that ablation characteristics are a function of the distance from the edge of the ablation as previously suggested.7, 12 A model that can account for these effects must be able to describe the full three-dimensional ablation crater, not just simply depth or volume removed per pulse. Vaporization processes and plume dynamics appear incapable of explaining the unique spatial features seen in ablating hydrated tissue. Models exist that address some of the necessary thermomechanical and spatial aspects17, 18 but none have successfully predicted the formation of central underablation in soft tissue such as cornea. Our hypothesis for this phenomenon is that transverse energy propagating within the ablated area creates increased pressure in the center. For this pressure to affect the ablation threshold in the center, it must last long enough to allow a greater rate of recombination. Studies using time-delay photographic techniques show that material begins to be ablated about after the pulse and that the ablation continues for more than .19 These, and other similar experiments20 used much smaller ablation areas and fluence levels 2 to 6 times higher than in the experiments reported in this paper. Experiments conducted by Noack using a 7-mm ablation zone, show the plume is attached at the base for up to .10 Other experiments using photoacoustic studies conclude that ablation caused by 193-nm laser pulses begins within of the start of the laser pulse and terminates in about .21 These differences in time may be related to a delay between the breaking of molecular bonds, which creates a shock wave, and the actual displacement of the ablated material. The significant difference between the ablation of the hydrated versus the dehydrated cornea and the change in clinical results between blowing and not blowing dry nitrogen6 shows that the water content of the cornea plays an important role in determining the ablation profile. Nikogosyan and Görner22 concluded that the main targets of 193-nm radiation are the peptide bonds in the collagen. Water fills the spaces between the collagen fibrils and tends to hold the broken molecules in place while the excess energy released as the bond breaks is transmitted as an impulse to other molecules. As fluence increases, the number of bond breaks per unit area increases, thereby increasing the number of impulses per unit time, which, in turn, causes an increase in pressure. Each photon that is absorbed produces a shock wave that travels with varying strength in all directions. Energy traveling perpendicular to the surface will travel outside the absorption depth within , a time much shorter than the laser pulse. However, it takes several microseconds for acoustic energy to be transmitted across a 6-mm ablation area. Therefore, transverse energy propagation is relevant to the time scale of the ablation process. Three conditions can exist at a point a small distance from the edge of the ablation: (1) Initially, point will receive a series of impulses from all sides. (2) After a time , where is the propagation velocity of the wave ( for water), point will no longer receive impulses propagating from the nearest edge. (3) After an additional time , where is the width of the ablation zone, point will no longer receive impulses from any side. The probability of recombination should be maximized in the first condition when impulses from opposite directions exert symmetrical pressure on the excited components. In condition 2, with impulses exerting asymmetrical pressure, the probability of recombination is low because the excited components of different mass are being displaced rather than being held in proximity. Condition 3 may further decrease the probability of recombination as there would be no external pressure on the excited components. Condition 3 occurs in ablation zones that are very small in diameter and may be the explanation for the increased ablation depth in areas less than as seen in Fig. 1. Srinivasan stated that ablation occurs when photofragments reach a critical density within the material. Below threshold photofragmentation is negligible. Above this threshold, relaxation back to a ground state reaches a steady state condition and photofragmentation may then successfully compete with relaxation. Additionally, according to Srinivasan, below the ablation interface, the bulk of the material is constantly changing its properties according to its photochemical history.23 The probability of simple molecules recombining is a function of proximity and time.24 If the same is true for complex molecules, higher pressure on the excited components will keep them in proximity longer, which increases the probability of recombination. However, recombination of complex molecules may result in modified molecular structures. Fluorescence, which is one by-product of recombination, has been reported to last for 10 to at fluence levels below threshold25 and to persist for several microseconds at high fluence levels.26 Increasing the fluence increases the number of excited components and, therefore, the time needed to complete the recombination-relaxation process. It follows that the threshold for ablation of large areas is not a constant for a material, as was previously suggested,27 but is a function of the recombination rate. The recombination rate is dependent upon the time in which symmetrical pressures are exerted, which is dependent on the distance from the edge of the ablation zone. Figure 5 gives the time for recombination to occur before asymmetrical forces dominate the ablation process. This time ranges from 0.5 to for the given fluence range, and the speed of energy propagation is equal to the speed of sound in water. If the curve in Fig. 5 is extrapolated to a fluence of , the ablation shape will have a flat central area for diameters . In a dehydrated cornea, excited molecules separate quickly because there is little or no water filling the space between them. Consequently the rate of recombination in the central area has the same low value as at the edge of the ablation, and the ablation profile is more uniform. The presence of a central mask effectively splits an ablation into two separate areas, each of which experiences the effect of the propagating transverse impulses independently. Energy propagation through the unablated area in the middle would arrive at a point in the other half after a period of asymmetrical forces and should have minimal effect on the recombination rate, depending on the width of the mask. In this experiment, the minimum ablation depth was located halfway between the outer edge of the ablation and the edge of the central mask. Some variation in profile shape was expected because the outer edge of the ablation is curved and the inner edge of the mask is straight. The plume dynamics are largely determined by the pressure exerted on the circumference of the rising column of ablated material. With a narrow mask, the pressure on the circumference changes only a little, and the column will not rise as two separate columns, but remains centered over the middle of the ablated area. Histological studies of ablated corneas with electron microscopy revealed a pseudomembrane of an electron-dense layer of unraveled collagen fibrils and another less compact layer thought to be redeposited material. The total thickness of the two layers was 100 to .10, 28 Marshall 29 reported that the thickness of the pseudomembranes ranged from 20 to . No correlation has been found between thickness and position for measurements that were closely spaced.10 Whether the formation of the pseudomembrane is caused by the recombination of broken bonds or redeposited material, either model would predict a thicker layer in the central region of minimum ablation. However, the two layers need to be measured separately, as the thickness of the unraveled collagen fibrils may be due to the change in ablation threshold. 5.ConclusionsThe theory that redeposition of ablated material is the primary cause of underablation in the center of large ablation zones does not fully explain the changes in ablation profiles that take place under selected conditions. A new hypothesis presented in this paper proposes that during ablation, propagating transverse energy interacts with the excited components, causing an increased ablation threshold in the center relative to the edge. This explanation is supported by the results of experiments in which ablation profiles were obtained by different methods and under different conditions: (1) by bisecting the ablation zone with an opaque mask, (2) by reducing the fluence to near threshold, and (3) by predicting the shape of larger ablations as a function of fluence. Additional studies employing time resolution photography, spatial fluorescence measurements, and electron microscopy to measure the thickness of the pseudomembrane are needed to further clarify the process and provide additional support for this theory. A more detailed model of the recombination-relaxation process of complex biological molecules is also needed. ReferencesS. Trokel,
“Laser surgery of the cornea,”
273
–297
(1987) Google Scholar
S. L. Trokel,
R. Srinivasan, and
B. Braren,
“Excimer laser surgery of the cornea,”
Am. J. Ophthalmol., 96 710
–715
(1983). 0002-9394 Google Scholar
C. R. Munnerlyn,
S. J. Koons, and
J. Marshall,
“Photorefractive keratectomy: A technique for laser refractive surgery,”
J. Cataract Refractive Surg., 14 46
–52
(1988). 0886-3350 Google Scholar
D. Lin,
H. Sutton, and
M. Berman,
“Corneal topography following excimer photorefractive keratectomy for myopia,”
J. Cataract Refractive Surg., 19 149
–154
(1993). 0886-3350 Google Scholar
R. Krueger,
N. Saedy, and
P. McDonnell,
“Clinical analysis of steep central islands following excimer laser photorefractive keratectomy (PRK),”
Arch. Ophthalmol. (Chicago), 114 377
–381
(1996). 0003-9950 Google Scholar
P. Parker,
“Central topographic islands following photorefractive keratectomy,”
Invest. Ophthalmol. Visual Sci., 803
(suppl), 34
(1993). 0146-0404 Google Scholar
J. K. Shimmick,
“Corneal ablation profilometry and steep central islands,”
J. Refract. Surg., 13 235
–245
(1997). 1081-597X Google Scholar
J. Salz,
“A two-year experience with excimer laser photorefractive keratectomy for myopia,”
Ophthalmology, 100 873
–882
(1993). 0161-6420 Google Scholar
L. Piebenga,
“Excimer photorefractive keratectomy for myopia,”
Ophthalmology, 100 1335
–1345
(1993). 0161-6420 Google Scholar
J. Noack,
“Influence of ablation plume dynamics on the formation of central islands in excimer laser photorefractive keratectomy,”
Ophthalmology, 104 823
–830
(1997). 0161-6420 Google Scholar
D. Sibold and
H. Urbassek,
“Effect of gas-phase collisions inpulsed-laser desorption: A three-dimensional Monte Carlo simulation study,”
J. Appl. Phys., 73 8544
–8551
(1993). https://doi.org/10.1063/1.353384 0021-8979 Google Scholar
C. R. Munnerlyn,
“Lasers in ophthalmology: Past, present, and future,”
J. Mod. Opt., 50 2351
–2360
(2003). 0950-0340 Google Scholar
VISX, Incorporated, unpublished data. Google Scholar
P. J. Dougherty,
K. L. Wellish, and
R. K. Maloney,
“Excimer laser ablation rate and corneal hydration,”
Am. J. Ophthalmol., 118 169
–176
(1994). 0002-9394 Google Scholar
G. H. Pettit and
M. N. Ediger,
“Corneal-tissue absorption coefficients for 193- and 213-nm ultraviolet radiation,”
Appl. Opt., 35 3386
–3391
(1996). 0003-6935 Google Scholar
D. W. Hahn,
M. N. Ediger, and
G. H. Pettit,
“Dynamics of ablation plume particles generated during excimer laser corneal ablation,”
Lasers Surg. Med., 16 384
(1995). 0196-8092 Google Scholar
B. Majaron,
P. Plestenjak, and
M. Lukac,
“Thermo-mechanical laser ablation of soft biological tissue: Modeling the micro-explosions,”
Appl. Phys. B, 69 71
–80
(1999). 0946-2171 Google Scholar
J. Meister,
C. Apel,
R. Franzen, and
N. Gutknecht,
“Influence of the spatial beam profile on hard tissue ablation. Part I: Multimode emitting lasers,”
Lasers Med. Sci., 18 112
–118
(2003). 0268-8921 Google Scholar
Z. Bor,
“Physical problems of excimer laser corneal ablation,”
J. Opt. Eng., 32 2481
–2486
(1993). Google Scholar
C. A. Puliafito,
“High-speed photography of excimer laser ablation of the cornea,”
Arch. Ophthalmol. (Chicago), 105 1255
–1259
(1987). 0003-9950 Google Scholar
S. Srinivasan,
P. E. Dyer, and
B. Braren,
“Far-ultraviolet laser ablation of the cornea: Photoacoustic studies,”
Lasers Surg. Med., 6 514
–519
(1987). 0196-8092 Google Scholar
D. N. Nikogosyan and
H. Görner,
“Laser induced photodecomposition of amino acids and peptides: Extrapolation to corneal collagen,”
IEEE J. Sel. Top. Quantum Electron., 5 1107
–1115
(1999). 1077-260X Google Scholar
R. Srinivasan and
E. Sutcliffe,
“Dynamics of the ultraviolet laser ablation of corneal tissue,”
Am. J. Ophthalmol., 103 470
–471
(1987). 0002-9394 Google Scholar
S. Brown, 188
–201
(1959) Google Scholar
S. Tuft,
“Characterization of the fluorescence spectra produced by excimer laser irradiation of the cornea,”
Invest. Ophthalmol. Visual Sci., 31 1512
–1518
(1990). 0146-0404 Google Scholar
T. R. Loree,
T. M. Johnson,
B. S. Birmingham, and
R. C. McCord,
“Fluorescence of corneal tissue under excimer laser irradiation,”
Proc. SPIE, 908 65
–71
(1988). 0277-786X Google Scholar
E. Sutcliffe and
R. Srinivasan,
“Dynamics of UV laser ablation of organic surfaces,”
J. Appl. Phys., 60 3315
–3322
(1986). https://doi.org/10.1063/1.337698 0021-8979 Google Scholar
D. Manstein,
“Damage mechanisms for excimer-laser corneal ablation,”
Invest. Ophthalmol. Visual Sci., 35 2012
(1994). 0146-0404 Google Scholar
J. Marshall,
S. Trokel,
S. Rothery, and
R. R. Krueger,
“Photoablative reprofiling of the cornea using an excimer laser: Photorefractive keratectomy,”
Lasers Ophthalmol., 1 21
–48
(1986). Google Scholar
|

