|
|
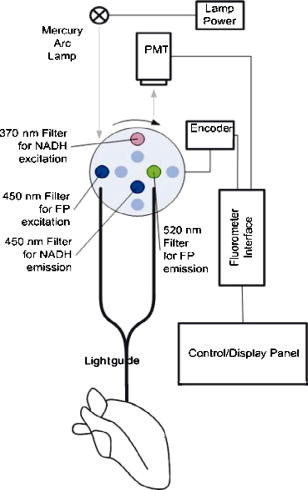
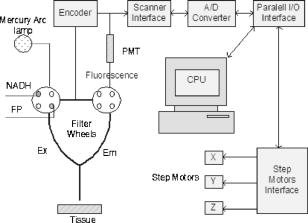
1.IntroductionOptical techniques in in vivo small-animal models have been shown to be useful in determining mitochondrial dysfunction.1, 2, 3, 4, 5 Myocyte apoptoisis has been shown to influence infarct size following reperfusion of ischemic myocardium.6 It has also been shown to play an important part in the progression of postinfarction ventricular remodeling leading to heart failure after a myocardial infarction.7 Currently the only way to quantitatively assess myocyte apoptosis is by molecular assays applied to biopsy tissue specimens. A catheter-based noninvasive technique to assess apoptosis in the beating heart would aid in the diagnosis and treatment of both diseases. Apoptosis is an orderly regulated process that results in mitochondrial dysfunction and disruption. To study the ability of optical techniques to assess apoptotic mitochondrial dysfunction we used a clinically relevant rabbit model of reperfusion injury. This model has been shown to be a strong stimulus for apoptosis as measured by standard molecular assays. In order to study this apoptosis progression in the cellular level, fluorescence spectroscopy and imaging of rabbit heart infarction is studied. We monitor myocardial fluorescence signals by a fiber optic coupling to a spectrofluorometer, which reads the mitochondrial redox state and the oxygenation state of hemoglobin/myoglobin in normoxia and ischemia. Spectroscopic measurements of flavoprotein (FP) and nicotinamide adenine dinucleotide (NADH) surface fluorometry as well as high-resolution imaging of the redox state of a frozen rabbit heart are obtained. The metabolic state of myocardium in this experiment is measured in vivo and in cryoimages. 2.Materials and MethodsFluorescence spectroscopy of rabbit myocardium is conducted with a fluorometer, which is a mobile optoelectronic apparatus that collects fluorescence signals of any type of tissue through a -tip lightguide. The incident light is a broadband mercury arc lamp that can be filtered at four different wavelengths by an air turbine filter wheel rotating at . Consequently, up to four signals could be multiplexed to a photodetector in order to make four-wavelength channel optical measurements of tissue metabolism as shown in Fig. 1 . In this experiment two channels are used for excitation and the other two for emission signals. The light intensity that is incident on tissue at the fiber tip is . In cardiac fluorometry experiments, the excitation wavelengths of FP and NADH are obtained by filtering the mercury arc lamp at and resonance lines (interference filters: 440DF20, 365HT25). The fluorescence signals are then detected by a photomultiplier tube (PMT, R928 Hamamatsu), converted to a digital signal with an A/D converter, and displayed. Hence, NADH and FP signals could be monitored using myocardial surface fluorometry in an open-chest rabbit heart under different perfusion experimental conditions such as normoxia, ischemia, and reperfusion. Male New Zealand white rabbits were anesthetized with ketamin , glycopyrrolate , and buprenorphine . The surgery was conducted in compliance with Institutional Animal Care and Usage Committee (IACUC) standards. Left thoracotomy was performed in the fourth intercostals space and the heart was exposed. The experimental protocol begins under normal conditions with the ventilator on and the optical fiber placed on the rabbit heart. During the experiment the fiber is positioned at two locations, the first on the basal anterolateral wall (noninfarct zone) and the second close to apex in the anteroapical apical myocardial wall distal to the largest branch of the circumflex coronary artery (later called infarct zone) as shown in Fig. 2 . A baseline for the absolute heart signal in normal conditions is obtained by recording the fluorescence signals of FP and NADH simultaneously for at each of the two positions. These sequential data from these two points are later time-averaged to provide control (baseline) signals. Myocardial ischemia is induced thereafter by tightening the coronary artery snare and confirmed by ECG and distinct color change. Right after occlusion, data are collected at the same positions. After of ischemia, another set of data is acquired. The ischemic area is then reperfused by loosening the coronary snare. To avoid arrhythmias, pretreatment with lidocaine and magnesium is conducted. Repeat fluorescence signals 1, 2, and after reperfusion are then collected. Following this, the heart is freeze-clamped while still in the chest cavity, utilizing Wollenberger tongs, and subsequently cooled with liquid , to preserve the instantaneous metabolic redox state of the tissue at the freezing moment. The low-temperature 3-D fluorescence scanner (Redox Scanner or Cryo-imager) provides high-resolution fluorescence images of the frozen heart. The scans of the surface of the frozen sample are provided via a microlightguide to obtain the fluorescence. The high-resolution scanner consists of a light source, synchronized optical filter wheels with bandpass filters, a bifurcated lightguide, two PMTs, a sample chamber, and stepper motors to drive the fibers in different directions. The scanner has a mercury arc lamp as the source to provide wavelengths from . To obtain maximum fluorescence, the excitation wavelength for NADH should be in the range of , and within for FP. The peak energy of the excitation spectrum of NADH is at and that of FP is at . These wavelengths can be selected using bandpass filters to exclude the excitation wavelength. Filter wheels rotate at and the emitted signals are detected by a PMT (R928, Hamamatsu). Figure 3 shows the instrumentation of the low-temperature fluorometer. Filtered light from a mercury arc lamp is coupled into one branch of a bifurcated fiber lightguide (one emission fiber in the middle and six excitation fibers around the emission fiber, each with a -diameter core and a numerical aperture of 0.34) and illuminated on the tissue surface. The fluorescence signals of the fluorophores are collected through the other branch of the fiber and detected by the PMT after passing through emission filters. The detected signals are converted to digital data with an A/D converter to enable the computer to obtain images of FP and NADH fluorescence signals via software programming. Two stepper motors drive the optical fiber bundles to scan the tissue surface in the and planes with a distance of in the direction from the surface of the sample. The planar resolution is approximately as small as . In the direction, tissue can be shaved with a resolution of via a miller head. The sample is fixed in a round sample holder cup inside the chamber filled with , the depth of which is monitored by a thermal sensor.8 The low-temperature scan provides a snapshot of the metabolism state of the myocardium and increases the fluorescence quantum yield, typically 10-fold, to give a better SNR of fluorescence signal compared to room temperature. To observe a deeper tissue metabolic state, the metal cutter shaves the sample surface with a desired depth (couple of hundred microns). The ischemic area and its surroundings myocardium is excised and embedded in the frozen buffer for redox scanning. The operations of the redox scanner such as milling, stepper motors movements in the , , and directions, and measurements are automatically controlled by computer. The number of pixels in each scan can be varied from to or , depending on sample size. The resolution of the step size at each and direction can also be specified for a desired resolution. This technique enables a high level of details and signal averaging as well as 3-D imaging by shaving the surface of the frozen sample and scanning at different depths. 3.Experimental ResultsCoronary arterial occlusion in in vivo heart experiments causes regional hypoperfusion and local tissue hypoxia. This is a model for a possible human heart myocardial ischemia. The shift from aerobic to anaerobic metabolism and local tissue hypoxia can be assessed by metabolic collection of mitochondrial intrinsic fluorescence of NADH and FP. The normalized ratio of these fluorophores , called the redox ratio, is an indicator of the metabolic state of tissue. Figure 4 displays the fluorescence intensity of the FP redox ratio in the infarct zone versus the noninfarct zone (two regions of interest observed from the beginning of the experiment) after of reperfusion. The data reveal that the redox ratio of the infract zone has become more oxidized with respect to the noninfarct zone. It is quite anomalous that a previously hypoxic region has become more oxidized. Previous data suggest this anomaly represents ongoing apoptosis.9 The noninfarct zone shows a drop in the FP redox ratio at ischemia due to reduction of fluorophores and a gradual increase during reperfusion due to oxidation. The variation of the redox ratio in the noninfarct region is smaller ( from reperfusion start to end) than in the infarct region during reperfusion ( variation). In the surface fluorometery data, each heart serves as its own control (infarct zone vs. noninfarct zone). Thus, in this experiment, the FP redox ratio for normal myocardium versus the ischemic/reperfused (I/R) zone shows a distinct rise due to oxidation in the I/R zone during the reperfusion period , suggesting that we are able to detect apoptosis during reperfusion. The mitochondrial redox state obtained by redox scanning is suitable for identifying heart metabolic states since the redox state is sensitive to apoptosis detection, workloads, oxygen, and substrate supplies. The in vivo fluorescence signals at of reperfusion were found to correlate with postmortem frozen heart signals obtained by cryogenic redox scanning. The frozen sample scans shown in Fig. 5 indicate an increased FP redox ratio after of reperfusion at the ligation I/R zone and a reduction of NADH redox ratio in that area. The histograms of the FP redox ratio as well as the NADH redox ratio show a bimodal distribution that can be due to a much higher intensity of oxidized fluorophores in the infarction zone. This is clear by a higher spectrum mean in the FP redox ratio and a smaller spectrum mean in the NADH redox ratio. Based upon previous studies,10, 11 this is indicative of ongoing apoptosis occurring in this region. This high-resolution scan suggests a clearly defined apoptotic zone surrounding the rather small infarct zone. Thus, we are able not only to identify apoptosis but also, and more importantly, to show the borders of the apoptotic region. 4.DiscussionNoninvasive optical techniques are useful in assessing tissue oxygenation on site during open-heart surgery. We demonstrate the technique of direct fluorometry of mitochondrial signals as nontissue destructive indicators of myocardial damage due to ischemia along with the identification of activation of apoptosis. Further studies are in progress to distinguish the apoptosis signal from necrosis by using infarcted but nonreperfused hearts. A noninvasive/nontissue destructive optical technique to assess tissue oxygenation, redox states, and apoptosis in human hearts would have tremendous clinical potential in a variety of clinical settings. This study suggests the feasibility of such an approach. It is hypothesized that the main reason for heart failure months after a heart attack is the initiation and progression of apoptosis. AcknowledgmentsThis research is supported in part by National Institutes of Health (Bethesda, Maryland) grants CA72895 (BC), CA096016 (BC), HL63954 (RCG), HL76560 (JHG), and HL71137 (RCG). The authors would like to thank C. Alter and L. Meng for helping with instrumentation and P. Daley for editing help. ReferencesB. Chance,
B. Schoener,
R. Oshino,
F. Itshak, and
Y. Nakase,
“Oxidation-reduction ratio studies of mitochondria in freeze-trapped samples,”
J. Biol. Chem., 254 4764
–4771
(1979). 0021-9258 Google Scholar
J. F. Ashruf,
C. Ince, and
H. A. Bruining,
“Regional ischemia in hypertrophic Langendorff-perfused rat hearts,”
Am. J. Physiol., 277 H1532
–H1539
(1999). 0002-9513 Google Scholar
F. W. Heineman and
R. S. Balaban,
“Control of mitochondrial respiration in the heart in vivo,”
Annu. Rev. Physiol., 52 523
–542
(1990). 0066-4278 Google Scholar
A. H. Harken,
C. H. Barlow,
W. R. Harden, and
B. Chance,
“Two and three dimensional display of myocardial ischemic border zone in dogs,”
Am. J. Cardiol., 42 954
–959
(1978). https://doi.org/10.1016/0002-9149(78)90681-1 0002-9149 Google Scholar
C. Steenbergen,
G. Deleeuw,
C. Barlow,
B. Chance, and
J. R. Williamson,
“Heterogeneity of the hypoxic state in perfused rat heart,”
Circ. Res., 41 606
–615
(1977). 0009-7330 Google Scholar
R. A. Gottlieb,
K. O. Burleson,
R. A. Kloner,
B. M. Babior, and
R. L. Engler,
“Reperfusion injury induces apoptosis in rabbit cardiomyocytes,”
J. Clin. Invest., 94
(4), 1621
–1628
(1994). 0021-9738 Google Scholar
J. Narula,
N. Haider,
R. Virmani,
T. G. DiSalvo,
F. D. Kolodgie,
R. J. Hajjar,
U. Schmidt,
M. J. Semigran,
G. W. Dec, and
B. A. Khaw,
“Apoptosis in myocytes in end-stage heart failure,”
N. Engl. J. Med., 335
(16), 1182
–1189
(1996). 0028-4793 Google Scholar
B. Quistorff,
J. Haselgrove, and
B. Chance,
“High spatial resolution readout of 3D metabolic organ structure: An automated, low-temperature redox ratio scanning instrument,”
Anal. Biochem., 148 389
–400
(1985). https://doi.org/10.1016/0003-2697(85)90244-1 0003-2697 Google Scholar
N. Narula,
J. Narula,
P. J. Zhang,
N. Haider,
P. N. Raghunath, J. H. Gorman III, R. C. Gorman, and
J. E. Tomaszewski,
“Is the myofibrillarlytic myocyte a forme fruste apoptotic myocyte?,”
Ann. Thorac. Surg., 79 1333
–1337
(2005). 0003-4975 Google Scholar
M. Ranji,
D. L. Jaggard, and
B. Chance,
“Observation of mitochondrial morphology and biochemistry changes undergoing apoptosis by angularly resolved light scattering and cryoimaging,”
Proc. SPIE, 6087 60780K
(2006). 0277-786X Google Scholar
M. Ranji,
D. L. Jaggard, and
B. Chance,
“Fluorescence spectroscopy of perfused rat heart: a fluorometer study,”
Proc. IEEE, 203
–204
(2006). 0018-9219 Google Scholar
|