
|
|
|
High selectivity and ultra-high sensitivity offered by surface-enhanced Raman scattering (SERS) have significant potential in biological research. Enhanced viability and minimal collection times, when combined with improved resolution of modern confocal Raman microscopes, makes SERS a unique platform for Raman studies of living human cells. Metallic nanoparticles (mainly gold and silver) have been used almost exclusively as SERS substrates to monitor cellular processes and events. Examples of such studies include: enzyme-drug interaction,1 probing intracellular pH,2 detecting intracellular constituents,3 and tracking exogenous molecules inside the cell.4 In these studies, “passive uptake” of these nanoparticles by cells has been the predominant approach to deliver nanoparticles inside the cells. However, this approach has major limitations: first, lack of control over aggregation and/or distribution of nanoparticles inside the cell, and second, very poor (almost none) translocation efficiency of nanoparticles to the cytoplasm or nucleus. It has been shown that nanoparticles as small as after incubation and passive uptake are entrapped inside vesicles or membrane-bound organelles (most likely the lysosomes or endosomes) inside cells and could not find their way into the cytoplasm or nucleus.5 To achieve suitable SERS signals, the size of nanoparticles should be in the range between 20 to .6, 7 Nanoparticles of such sizes cannot escape the inevitable endosomal/lysosomal pathway of the cell, and even if they did, they are too big to pass through the pores of the nuclear membrane . Growing nanoparticles inside cells might be an alternative and unique approach to provide the enhancing element (SERS) and access to the innermost confines of the cellular microcosm, which are otherwise not possible by passive uptake. It has been known for a long time that certain micro-organisms have the capacity to reduce metallic ions into elemental metals. Nanoparticles of different shapes, sizes, and compositions can be synthesized using different mico-organisms (bacteria, fungus, yeast, actinomycetes).8, 9 The exact mechanism of the reduction process has not been elucidated yet. This reducing capacity has been shown by Anshup for human cell lines.10 In this work, we provide a venue for using intracellularly grown Au nanoparticles as a SERS probe to obtain SERS spectra of the cytoplasm and/or the nucleus of a single cell. MCF10 epithelial cells were used as model mammalian cells to investigate the active approach. 1-mM solution in phosphate buffer saline (pH 7.4) was used for this purpose. To test for the formation of gold nanoparticles, cells were grown to confluency and the growth media was removed (to eliminate phenol red in the media, which is an interferent10) and replaced with phosphate-buffered saline (PBS) and incubated with 1-mM in culture wells. The appearance of a pink color after indicated the formation of gold nanoparticles. No color change was observed in the negative controls (cells incubated with PBS without ). Solutions of in PBS are stable for months and hence the possibility of autoreduction is ruled out. Formation of elemental gold in PBS was further confirmed by the plasmon resonance band in the visible region of the absorption spectrum. TEM images of thin cross sections of cells incubated with chloroaurate ion solution after clearly reveal the formation of gold nanoparticles of irregular shapes and varying sizes scattered throughout the cytoplasm [Figs. 1a and 1b ]. Some of these form aggregates that are dramatically large, approaching the micrometer size range in a way that is visible even under a regular light microscope. The presence of smaller size (less than ) within the nucleus and cytoplasm was suspected from the TEM images [Fig. 1c]. Since this size range is very close to the resolution limit of TEM, it is very difficult to distinguish from artifacts or ribosomes. Using reflectance laser scanning confocal microscopy (LSCM) combined with silver enhancement (also called autometallography), it is possible to visualize and track gold nanoparticles as small as . Gold nanoparticles can selectively nucleate the deposition of dense silver particles, which lead to their enlargement and enhanced visualization using appropriate confocal techniques.11, 12 LSCM imaging from three groups of samples including negative control, positive control (cells incubated with 50-nm gold nanoparticles), and test (cells with ) are presented in Fig. 2 . The LI Silver kit (Nanoprobes, Incorporated, Yaphank, New York) was used for silver enhancement. As opposed to positive control, which shows little or no sign of gold nanoparticles inside the nucleus, cells with show a large amount of gold nanoparticles deposited inside the nucleus as well as the cytoplasm. While the true mechanism of intranucleus formation of gold nanoprticles is not clearly understood, previous studies have implicated the role of membrane sugars and enzymes in the reduction process.13 Hence one can speculate that a portion of smaller produced in the nuclear membrane may have diffused or translocated to the nuclear matrix. A similar mechanism has been proposed in the study of cytoplasmic during fungus mediated synthesis of silver nanoparticles.14 Apart from these small size inside the nucleus, we have also noted the formation of relatively very large size spherical nanoparticles inside the nuclues [Figs. 1d, 1e, 1f]. To our knowledge, this is the first report on the formation of such large nanoparticles (up to ) inside the nucleus of a single cell. Fig. 1TEM images showing of varing size and shapes inside (a) and (b) the cytoplasm and nucleus (d), (e), and (f). of smaller size are spread throughout the nucleus, and (c) cytoplasm are not clearly visible in TEM images. In contrast to that are free within the cytoplasm, (g) 20-nm spherical gold nanoparticles are entrapped in the endosomal compartments after passive uptake. Magnifications: (a) , (b) , (c) , (d) , (e) , (f) , and (g) . Blue and green scale bars denote and respectively (color online only).  Fig. 2Silver-enhanced laser scanning confocal images of intracellular gold particles. Reflectance versus transmission images of (A) and negative control cells, (B) and positive control cells with no nuclear traslocation, and (C) and cells with inside nucleus and cytoplasm. All three groups, including the negative control, were subject to the same silver-enhancement protocol. Yellow ovals indicate the nucleus boundaries (color online only).  SERS spectra were collected using a confocal Raman microscope fitted with a water immersion objective and a 785-nm near-infrared (NIR) laser. Spatial and spectral resolutions were about and , respectively. Laser power was set to and the laser spot size was estimated to be lower than . Spectra were collected both in a random fashion and also specifically from the dark spots believed to be aggregates. The majority of Raman spectra collected from the aggregates show a non-SERS pattern depicted in Fig. 3a , which includes four distinct bands around 279, 395, 514, and . Careful observation reveals that these bands are equally spaced by almost the same value [Fig. 3a] which is indicative of the resonance effect arising from the lattice vibrations of crystals. Such characteristic vibrations could not be observed in the Raman measurements of samples incubated with spherical gold nanoparticles. SERS spectra collected from , on the other hand, look quite different and highly resolved. Figure 3b shows three sample Raman spectra in the fingerprint region, collected from single living cells with . Considering the physical location of , we hypothesize that could potentially sense the nuclear and/or cytoplasmic materials. Many of the bands in these spectra can be ascribed to DNA and/or proteins. For example: (guanine), (DNA), (adenine), (tryptophan), (DNA/RNA), (protein backbone), (phenylalanine), (protein), (DNA backbone), (amide III), (protein, DNA/RNA), (protein, DNA/RNA), (protein, DNA/RNA), (protein, DNA/RNA), and (DNA/RNA), and (DNA/RNA, in-plane ring vibration). 15, 16, 17, 18 Fig. 3(a) Low wavenumber lattice vibrations of depict their crystalline nature. (b) -induced SERS spectra. Raman bands are evidence of sensing cytoplasmic or nuclear matrix (protein, DNA/RNA). Exposure time was and laser power was . 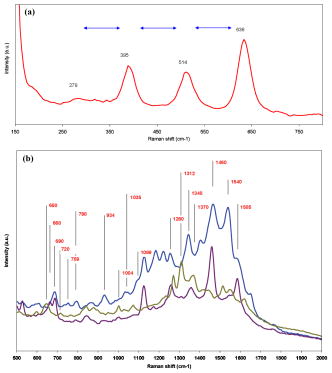 In a separate experiment, SERS spectra induced by incubated gold nanoparticles (10 and ) were collected and compared with the -induced SERS (Fig. 4 ). No SERS spectra could be collected from the controls (cells without or cells without ). A striking difference between the - and -induced SERS spectra is the sharp Raman band around , which was absent in the -induced SERS. This band is also present in almost all the reported SERS spectra from previous studies.3, 19 This can be related to the stretching vibration mode of disulfide bond ( S-S). This can be indicative of lysosomal proteins that have an abundance of disulfide bonds. Lysosomal proteins need to resist the hostile conditions of the environment in which they reside. The oxidizing environment of lysosomes as opposed to the reducing environment of the cytosol favors the formation of disulfide bond.20, 21, 22 This further evidence indicates that in contrast to is not translocated to the endosomes or lysosomes and hence could potentially serve as a SERS probe for sensing the cytoplasmic/nuclear environment. TEM imaging supports this observation [Fig. 1g]. Prevalence of protein fingerprints in both the - and -induced SERS spectra could be related to the fact that proteins have an affinity to bind to the surface of gold nanoparticles through chemisroption. Fig. 4Comparison between -induced and passively uptaken gold nanoparticle (10 and ) induced SERS. Exposure time was and laser power was . 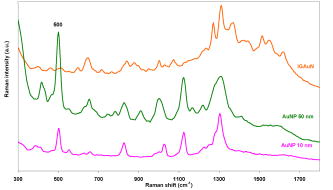 In summary, is introduced for the first time as a potential SERS substrate to probe the cytoplasm and nucleus of single cells. This capability can prove to be a promising SERS platform to study biochemical mechanisms or interactions, and in elucidating the enzymatic/molecular mechanism involved in the bioreduction of gold itself. Future studies will focus on optimizing this platform by testing different human cell lines, and controlling the shape and distribution of and refining the experimental designs for higher sensitivity and selectivity. Controlling the growth of gold nanoparticles inside the cell is a critical step toward generating SERS-favorable and obtaining more meaningful information. AcknowledgmentsWe thank Molecular Cytometry Lab and Electron Microscopy Facility personnel of Purdue University for their help.Mr. Patrick Dover from Olympus Incorporated is acknowledged for assistance in providing water immersion objectives. This research was conducted at the Physiological Sensing Facility. ReferencesI. Chourpa,
H. Morjani,
J. F. Riou, and
M. Manfait,
“Intracellular molecular interactions of antitumor drug amsacrine (m-AMSA) as revealed by surface-enhanced Raman spectroscopy,”
FEBS Lett., 397 61
–64
(1996). https://doi.org/10.1016/S0014-5793(96)01141-6 0014-5793 Google Scholar
C. E. Talley,
L. Jusinski,
C. W. Hollars,
S. M. Lane, and
T. Huser,
“Intracellular pH sensors based on surface-enhanced Raman scattering,”
Anal. Chem., 76 7064
–7068
(2004). https://doi.org/10.1021/ac049093j 0003-2700 Google Scholar
K. Kneipp,
A. S. Haka,
H. Kneipp,
K. Badizadegan,
N. Yoshizawa,
C. Boone,
K. E. Shafer-Peltier,
J. T. Motz,
R. R. Dasari, and
M. S. Feld,
“Surface-enhanced Raman Spectroscopy in single living cells using gold nanoparticles,”
Appl. Spectrosc., 56 150
–154
(2002). https://doi.org/10.1366/0003702021954557 0003-7028 Google Scholar
J. Kneipp,
H. Kneipp,
W. L. Rice, and
K. Kneipp,
“Optical probes for biological applications based on surface-enhanced Raman scattering from indocyanine green on gold nanoparticles,”
Anal. Chem., 77 2381
–2385
(2005). https://doi.org/10.1021/ac050109v 0003-2700 Google Scholar
B. D. Chithrani,
A. A. Ghazani, and
W. C. W. Chan,
“Determining the size and shape dependence of gold nanoparticle uptake into mammalian cells,”
Nano Lett., 6 662
–668
(2006). https://doi.org/10.1021/nl052396o 1530-6984 Google Scholar
K. Kneipp,
H. Kneipp, and
J. Kneipp,
“Surface-enhanced Raman scattering in local optical fields of silver and gold nanoaggregatess—from single-molecule Raman spectroscopy to ultrasensitive probing in live cells,”
Acc. Chem. Res., 39 443
–450
(2006). https://doi.org/10.1021/ar050107x 0001-4842 Google Scholar
A. Wei,
B. Kim,
B. Sadtler, and
S. L. Tripp,
“Tunable surface-enhanced Raman scattering from large gold nanoparticle arrays,”
ChemPhysChem, 2 743
(2001). https://doi.org/10.1002/1439-7641(20011217)2:12<743::AID-CPHC743>3.0.CO;2-1 1439-4235 Google Scholar
D. Mandal,
M. E. Bolander,
D. Mukhopadhyay,
G. Sarkar, and
P. Mukherjee,
“The use of microorganisms for the formation of metal nanoparticles and their application,”
Applied Microbio. Biotechnol., 69 485
–492
(2006). Google Scholar
J. R. Lloyd,
“Microbial reduction of metals and radionuclides,”
FEMS Microbiol. Rev., 50 411
–425
(2003). 0168-6445 Google Scholar
A. Anshup,
J. S. Venkataraman,
C. Subramaniam,
R. R. Kumar,
S. Priya,
T. R. S. Kumar,
R. V. Omkumar,
A. John, and
T. Pradeep,
“Growth of gold nanoparticles in human cells,”
Langmuir, 21 11562
–11567
(2005). https://doi.org/10.1021/la0519249 0743-7463 Google Scholar
J. F. Hainfeld and
R. D. Powell,
“New frontiers in gold labelling,”
J. Histochem. Cytochem., 48 471
–480
(2000). 0022-1554 Google Scholar
G. Danscher and
J. O. R. Norgaard,
“Light microscopic visualization of colloidal gold on resin-embedded tissue,”
J. Histochem. Cytochem., 31 1394
–1398
(1983). 0022-1554 Google Scholar
D. V. Goia and
E. Matijevic,
“Preparation of monodispersed metal particles,”
New J. Chem., 22 1203
–1215
(1998). https://doi.org/10.1039/a709236i 1144-0546 Google Scholar
S. Senapati,
D. Mandal,
A. Ahmad,
M. I. Khan,
M. Sastry, and
R. Kumar,
“Fungus mediated synthesis of silver nanoparticles: a novel biological approach,”
Indian J. Phys. Proc. Indian Assoc. Cultivation Sci. Part A, 78A 101
–105
(2004). Google Scholar
C. Krafft,
T. Knetschke,
R. H. W. Funk, and
R. Salzer,
“Identification of organelles and vesicles in single cells by Raman microspectroscopic mapping,”
Vib. Spectrosc., 38 85
–93
(2005). https://doi.org/10.1016/j.vibspec.2005.02.008 0924-2031 Google Scholar
D. Naumann,
“FT-infrared and FT-Raman spectroscopy in biomedical research,”
Appl. Spectrosc. Rev., 36 239
–298
(2001). https://doi.org/10.1081/ASR-100106157 0570-4928 Google Scholar
K. M. Omberg,
J. C. Osborn,
S. L. L. Zhang,
J. P. Freyer,
J. R. Mourant, and
J. R. Schoonover,
“Raman spectroscopy and factor analysis of tumorigenic and non-tumorigenic cells,”
Appl. Spectrosc., 56 813
–819
(2002). https://doi.org/10.1366/000370202760171464 0003-7028 Google Scholar
F. R. Dollish,
W. G. Fateley, and
F. F. Bentley, Characteristic Raman Frequencies of Organic Compounds, Wiley, New York (1974). Google Scholar
C. Eliasson,
A. Loren,
J. Engelbrektsson,
M. Josefson, J. Abrahamsson, K. Abrahamsson,
“Surface-enhanced Raman scattering imaging of single living lymphocytes with multivariate evaluation,”
Spectrochim. Acta, Part A, 61 755
–760
(2005). https://doi.org/10.1016/j.saa.2004.05.038 0584-8539 Google Scholar
J. Hu,
R. S. Sheng,
Z. S. Xu, and
Y. E. Zeng,
“Surface-enhanced Raman-spectroscopy of lysozyme,”
Spectrochim. Acta, Part A, 51 1087
–1096
(1995). https://doi.org/10.1016/0584-8539(94)00225-Z 0584-8539 Google Scholar
U. T. Phan,
R. L. Lackman, and
P. Cresswell,
“Role of the C-terminal propeptide in the activity and maturation of gamma-interferon-inducible lysosomal thiol reductase (GILT),”
Proc. Natl. Acad. Sci. U.S.A., 99 12298
–12303
(2002). https://doi.org/10.1073/pnas.182430499 0027-8424 Google Scholar
H. Ostergaard,
C. Tachibana, and
J. R. Winther,
“Monitoring disulfide bond formation in the eukaryotic cytosol,”
J. Cell Biol., 166 337
–345
(2004). https://doi.org/10.1083/jcb.200402120 0021-9525 Google Scholar
|


