|
|
|
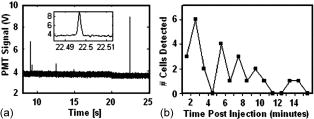
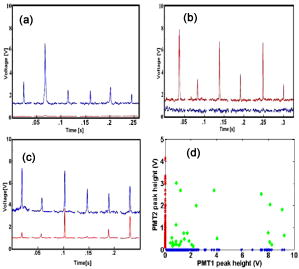
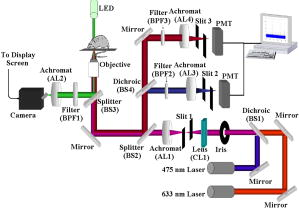
Standard flow cytometry is currently the method of choice for rapid quantification of cells, but it can only be performed in vitro.1 Analysis of circulating cells in the bloodstream by this method has generally been performed after withdrawal of blood samples, but this method is not effective for studies on rapidly changing cell populations, since blood samples cannot be drawn often enough. Confocal microscopy and two-photon imaging techniques have been able to detect fluorescently labeled cells in vivo, but the equipment required for these techniques is prohibitively expensive when used for video rate image capture, and the velocity of blood flow makes the quantification of cells extremely difficult.2 In 2004, Novak described the first in vivo flow cytometer (IVFC), which was capable of real-time confocal detection of fluorescently labeled cells in both the arterial and venous circulation of small animals.3 This instrument has been used to study the circulation kinetics of prostate cancer and leukemia cells labeled with a single chromophore either before or after intravenous injection into mice or rats.4, 5, 6 A lab-bench design for two-color in vivo flow cytometry has also been described.7 Here, we introduce a portable version of the two-color in vivo flow cytometer with additional hardware and software improvements that enable real-time cell counting and enhance the range of fluorophores that can be detected, as well as the specificity with which cell populations can be monitored. Specifically, in the portable, two-color IVFC system, excitation is provided by the 633-nm line of a laser and the 473-nm line of a diode-pumped solid state (DPSS) laser. Incorporation of the blue DPSS laser allows fluorescence detection of additional common chromophores such as fluorescein isothiocyanate (FITC) and phyco-erythrin (PE), as well as green fluorescent protein (GFP). Simultaneous detection of two chromophores is possible and relevant for enhancing the specificity of detection. Portability allows flexibility in the location of data acquisition. This is important, for instance, for measurements performed with immunocompromised mice, which are typically not allowed to move in and out of the highly controlled environment of the animal facility. Real-time counting eliminates laborious steps of data analysis and provides the option to eliminate storage of the IVFC experiment data trace. Thus, these new features expand significantly on the capabilities of IVFC. Reliable performance for a system that monitors circulating cells over long data acquisition times while maintaining portability required a relatively small, portable frame that is sophisticated enough to eliminate high-frequency vibration and dampen low-frequency shock. For these reasons, the system rests on a steel cart with spring-loaded Harmon shock absorbing casters on the legs and a granite slab six inches thick as the top shelf. A Newport scientific-grade optical breadboard with integrated shock absorption rests on polyurethane vibration damping pads above the granite slab. Custom-made brackets hold the breadboard in place, so that it can freely move up and down for cushioning on the polyurethane pads, but it cannot move from side to side. The entire device is stable and shock resistant but small enough (approximately wide, deep, and , tall) to be rolled through normal doorways. The optical layout of the system (Fig. 1 ) is very similar to that described for the single color IVFC instrument.3, 4 Blood vessels from which IVFC data are obtained are visualized by the camera using a simple 530 nm LED-based transillumination system. Fluorescence excitation is provided by two lasers, a 632.8-nm laser (as in the original IVFC system) and a blue 473-nm diode-pumped solid state laser (BW Tek). Addition of the second laser is accomplished simply by introducing the long pass dichroic (BS1) into the original optical path of the laser beam. Light from both lasers is shaped into a slit by the cylindrical lens (CL1). This slit is imaged across a blood vessel by achromat AL1 and the objective. The fluorescence emitted when a fluorescently labeled cell traverses the slit of excitation light is collected by the same objective, reflected by an 80/20 beamsplitter (BS2) and imaged onto confocal slit 2 (510-590 nm emission) or confocal slit 3 (650–690 nm emission) using a combination of appropriate dichroic and bandpass filters. The signal collected by the PMTs is sampled at by a data acquisition board (Data Translation DT9804) and analyzed in real time using DT Measure Foundry and Matlab based software. The real-time counting capability of the new in vivo flow cytometer is a key improvement. It allows the user to assess the progress of the experiment and identify potential problems. In addition, it saves a significant amount of postdata processing time. The data and results are stored in case there is a need for further review at a later time. The software analyzes acquired data in real time, updating the results once per second. Each second of data is digitally filtered using a second-order Butterworth lowpass filter, and the sampling rate of the data is reduced to to allow faster analysis. A peak intensity threshold is determined based on the mean and an increment of the standard deviation (usually 5 or 6 stds) of the background. Peaks that have an intensity that is higher than this threshold are counted, and the time they occur, their peak intensity, and their full width at half maximum are recorded and can be displayed at the end of a data trace. One of the advantages of IVFC compared to standard flow cytometry is that the sensitivity of the measurements, both in terms of the maximum and minimum number of cells that is detected, can be controlled to a significant extent. For example, the maximum number of cells that can be detected for a certain recording time period is determined directly by the frequency with which data is sampled. To achieve fast data processing, we analyze data that is sampled at a 5-KHz rate, which would allow detection of up to , a number that is significantly higher than the number of cells that we are typically interested in detecting. For example, only approximately 1100 white blood cells are expected to traverse an excitation slit focused on a blood vessel, when flowing at an average velocity of (typical for arterial mouse circulation). In principle, the maximum number of cells that can be detected will increase proportionately with the data sampling rate, and can exceed the total number of blood cells typically present within the sampled blood volume. Practically, some sensitivity limitations may arise when multiple cells traverse the excitation slit at exactly the same time. One of the main advantages of a noninvasive method such as IVFC for detecting such cells is that the monitoring time can be tailored to achieve the required sensitivity. In addition, as long as the cell population of interest is fluorescently labeled, either by fluorescent protein expression or antibody tagging, there is no risk of contaminating or eliminating any of the cells of interest due to processing or artifacts. So, for a 60-min data acquisition from a single blood vessel, IVFC samples of blood containing a total of approximately cells. If one of these cells is labeled, then it should be detectable by IVFC. If the cell population of interest is even scarcer, then we can increase the acquisition time or select a bigger blood vessel for data acquisition or modify the system to accommodate sampling from two or more blood vessels. Prior to data acquisition, animals are anesthetized with a 7:1 mixture of ketamine:xylazine and placed on the stage, which includes a heating pad which maintains the skin temperature of the mice at 30°C. The power at the sample from each laser is approximately . To assess the capabilities of the system to acquire data from GFP-labeled cells, we acquired IVFC data from an ear artery of a NOD/SCID mouse following tail-vein injection of SUM149 cells primary human breast cancer cells infected to intrinsically express GFP. The corresponding data demonstrate an excellent signal-to-noise ratio of up to 50:1 [Fig. 2a ]. Since cancer cells are not expected to be in the circulation, they become depleted rapidly for a number of reasons, including getting lodged in the lung microcirculation because of their size, homing to tissues where they are likely to form metastatic tumors, and undergoing apoptosis.8 The variation and gradual depletion of the number of circulating breast cancer cells that we detect per minute following tail vein injection is shown in Fig. 2b. Thus, in vivo flow cytometry could serve as a sensitive tool for detecting circulating, GFP-labeled cells in vivo, without the need to draw a blood sample. The specific example of GFP-labeled breast cancer cells highlights one of the areas where monitoring of circulating cells is of great interest. While investigators have been performing studies on circulating cancer cells for nearly 50 years, their role in cancer progression and metastasis is not well understood yet.8 Thus, noninvasive, highly sensitive and quantitative methods such as IVFC may serve as an ideal tool for dynamic, quantitative monitoring of circulating cells as tumors develop and in relation to their metastatic potential. Such understanding may lead to improved therapeutic interventions, whose efficacy could also be monitored by IVFC. Fig. 2(a) Signal from GFP-expressing SUM149 human breast cancer cells flowing through a mouse ear artery. Inset shows a closer view of the large signal peak on the right. (b) Changes in the number of detected circulating GFP cells as a function of time following tail-vein injection.  The ability to perform multicolor flow cytometric measurements is expected to enhance significantly the specificity with which we are able to detect the cell populations of interest. As an example, we show representative data traces acquired from NOD/SCID mice following tail vein injection of approximately of PE-labeled c-kit antibody (BD Biosciences) and of the APC-labeled sca-1 antibody (BD Biosciences) [Fig. 3c ]. The corresponding data traces from the two PMT detectors represent PE- and APC-labeled cells, with the PE trace artificially offset by so that both traces can be easily identified. Peaks from control experiments performed by injecting only either PE-labeled c-kit antibody [Fig. 3a] or APC-labeled sca-1 antibody [Fig. 3b] are also shown to demonstrate that the double-labeled peaks of Fig. 3c are not simply bleed-through fluorescence. When both antibodies are injected, most cells are labeled either with the c-kit or with the sca-1 antibody, while only a small fraction of the total number of peaks appear in both PMT channels. This is illustrated in Fig. 3d, which includes the heights of all the peaks detected by the two channels. Most of the scatter plot data points are found either along the or axis, representing peaks that are detected only by PMT1 (PE/c-kit+ cells) or by PMT2 (APC/sca1 cells), respectively. The data points that have detectable peaks by both channels (solid diamonds) represent the detected double-labeled hematopoietic stem cells. They are a fraction of all the labeled cells, since several types of cells, including maturing leukocytes, can be labeled with c-kit or sca-1 alone, but essentially only hematopoietic stem cells are expected to be labeled with both antibodies.9 While in vivo antibody labeling is certainly more challenging than in vitro, these initial two-color IVFC measurements demonstrate the potential specificity that can be achieved in vivo and thus, the utility of IVFC to monitor well-defined populations of cells, such as hematopoietic stem cells. The in vivo monitoring of stem cells in the peripheral blood may have a significant impact in the field of oncology as a noninvasive means to assess, for example, the mobilization of bone marrow stem cells during or after myeloablative chemotherapeutic regimens. Ultimately, similar experiments may also be tailored in the future to detect cancer stem cells and understand their role in the process of metastasis. Fig. 3Signal recorded by the two detectors when only (a) PE-labeled c-kit antibody or (b) APC-labeled sca-1 antibody is injected in the mouse circulation. Peaks are detected only by PMT1 (blue) in the first case and PMT2 (red) in the second case, with no peaks registering in both channels. (c) Examples of peaks from hematopoietic stem cells expressing both c-kit (PE-blue label) and sca-1 (APC-red label) antibodies. (d) Scatter plot of the fluorescence peak heights detected in the circulation of NOD/SCID mice following injection of PE-labeled c-kit and APC-labeled sca-1 antibodies. Peaks shown included those detected by: PMT1 only corresponding to c-kit expressing cells (blue * along axis), PMT2 only corresponding to sca-1 expressing cells (red along axis), and PMT1 and PMT2 corresponding to double-labeled cells (green solid diamonds). (Color online only.)  In summary, the in vivo flow cytometer we have developed is the first portable system of its type and has the ability to collect and analyze data in real time from two fluorophores simultaneously. Portability and real-time data analysis improve significantly the usability of the instrument, while the addition of excitation at to the 633-nm line and simultaneous collection of data at two fluorescence emission regimes enhance the range of applications that the method can be used for. We present monitoring of circulating GFP-labeled cells and double-labeled hematopoietic stem cells as specific examples. In general, multicolor in vivo flow cytometry allows real time detection and quantification of circulating cells with an excellent signal-to-noise ratio, and could serve as an ideal tool for understanding the role that specific cell populations play in disease processes or for monitoring the effects of treatments. AcknowledgementsThis work was supported by a Tufts University Faculty Research Award (Georgakoudi), a Claflin Distinguished Scholar Award (Georgakoudi), a Concept Award from the Center for the Integration of Medicine and Innovative Technologies (Lin and Georgakoudi), the Susan Komen Foundation (Kuperwasser), the RB Sackler Foundation (Kuperwasser), and NIH grants EY14106 and EB000664 (Lin). Kuperwasser is an RB Sackler Scholar. We thank John Novak and Costas Pitsillides from the Massachusetts General Hospital for helpful discussions on optical design and cell labeling considerations, respectively. ReferencesH. M. Shapiro, Practical Flow Cytometry, 3rd ed.Wiley-Liss, New York (1995). Google Scholar
J. P. Pawley, Handbook of Biological and Confocal Microscopy, 2nd ed.Plenum, New York (1995). Google Scholar
J. Novak,
I. Georgakoudi,
X. Wei,
A. Prossin, and
C. P. Lin,
“In vivo flow cytometer for real-time detection and quantification of circulating cells,”
Opt. Lett., 29 77
–79
(2004). https://doi.org/10.1364/OL.29.000077 0146-9592 Google Scholar
I. Georgakoudi,
N. Solban,
J. Novak,
W. Rice,
X. Wei,
T. Hasan, and
C. P. Lin,
“In vivo flow cytometry: A new method for enumerating circulating cancer cells,”
Cancer Res., 64 5044
–5047
(2004). https://doi.org/10.1158/0008-5472.CAN-04-1058 0008-5472 Google Scholar
D. A. Sipkins,
X. Wei,
J. W. Wu,
J. M. Runnels,
D. Côté,
T. K. Means,
A. D. Luster,
D. T. Scadden, and
C. P. Lin,
“In vivo imaging of specialized bone marrow endothelial microdomains for tumour engraftment,”
Nature (London), 435 969
–973
(2005). https://doi.org/10.1038/nature03703 0028-0836 Google Scholar
X. Wei,
D. A. Sipkins,
C. M. Pitsillides,
J. Novak,
I. Georgakoudi, and
C. P. Lin,
“Real-time detection of circulating apoptotic cells by in vivo flow cytometry,”
Mol. Imaging, 4 415
–416
(2005). 1535-3508 Google Scholar
J. Novak,
“Development of the in vivo flow cytometer,”
Massachusetts Institute of Technology,
(2004). Google Scholar
A. F. Chambers,
A. C. Groom, and
I. C. MacDonald,
“Dissemination and growth of cancer cells in metastatic sites,”
Nat. Rev. Cancer, 2 563
–572
(2002). 1474-175X Google Scholar
K. Ikuta and
I. L. Weissman,
“Evidence that hematopoietic stem cells express mouse c-kit but do not depend on steel factor for their generation,”
Proc. Natl. Acad. Sci. U.S.A., 89 1502
–1506
(1992). 0027-8424 Google Scholar
|


