
|
|
1.IntroductionThe transmembrane protein prestin, found in mammalian outer hair cells (OHCs), is directly involved in the generation of a unique type of cellular motility. Electromotile OHCs exhibit axial length changes in response to alterations in transmembrane potential.1, 2, 3 The mechanism by which prestin and other components of the OHC detect voltage changes and convert them into cellular elongation or contraction remains unknown. However, these deformations are believed to enhance vibrations of the basilar membrane, and the sensitivity and frequency selectivity of the mammalian cochlea require the presence of prestin.4 Damage to OHCs results in a elevation in hearing thresholds,5 and age-related hearing loss is associated with the gradual death of OHCs. OHCs are cylindrical, neuroepithelial cells with a unique trilaminate lateral wall structure consisting of the plasma membrane, a cortical cytoskeleton or cortical lattice, and a network of internal membranes called the subsurface cisterna.6 The cortical lattice is composed of circumferential actin filaments cross-linked by spectrin and lies below the inner leaflet of the plasma membrane.7, 8, 9 In addition, the actin filaments are associated with a “pillar” protein of unknown composition, structure, and function that has been hypothesized to tether the cortical cytoskeleton to the plasma membrane.10, 11 It is conceivable that prestin molecules in the plasma membrane have a direct or indirect connection to the cortical lattice, such that the cumulative electromotile response of prestin molecules in the membrane also affects the cytoskeleton and results in whole cell axial length changes. This interaction is feasible within the context of the currently hypothesized mechanisms of OHC electromotility, which have been recently reviewed.12 The first, the “area motor” model, describes prestin as having two states, each of which encompasses a different amount of membrane area. A shift in transmembrane potential results in a conformational change between states, and the concerted action of prestin molecules in the lateral wall alters cell surface area and thus produces whole cell deformation.11, 13, 14, 15 The alternative, “membrane bending” model, is based on the idea that the OHC contains excess membrane area. When prestin senses alterations in transmembrane voltage, it undergoes a conformational change resulting in out-of-plane membrane deformations.16 This causes changes in membrane curvature, which may result in the unfolding of excess plasma membrane as the OHC elongates. Despite their differences, both models are consistent with a network of prestin molecules that sense transmembrane voltage and transmit forces to the cytoskeleton,17 leading to observable axial length changes. Prestin is a transmembrane protein with a predicted molecular weight of , 10 to 12 transmembrane domains, and both N- and C- termini located intracellularly.18, 19, 20, 21 Immunofluorescent labeling shows prestin is localized in the OHC lateral wall plasma membrane with proximity to the cortical cytoskeleton.19, 22, 23, 24 Examining the mobility of prestin in the plasma membrane has been previously recognized as an important area of study, and the diffusion of the motor molecule, now recognized as prestin, in the OHC has been indirectly measured via electrophysiological techniques.25, 26 Ideally, dynamic, fluorescence-based studies of prestin would be conducted in the native environment of the OHC. However, OHCs are extremely challenging cells to work with, as they cannot be maintained in cell culture, and they undergo a decline in health leading to cell death within hours after excision from the cochlea. Consequently, prestin studies are routinely conducted in model systems. Human embryonic kidney (HEK) cells transfected with prestin display the hallmarks of electromotility, cellular deformation and nonlinear capacitance (NLC), and are thus an acceptable system in which to study prestin function and behavior as confirmed by several recent studies.27, 28, 29 Since prestin was first cloned in 2000, studies have focused on providing a complete explanation of the electromotile mechanism. However, to achieve this ambitious goal, two major objectives must be addressed. The first is to characterize the function of prestin at the molecular level, and the second is to determine the concerted role of prestin and associated molecules in the axial deformations of electromotility. Addressing these questions is by no means trivial, and initial work has been limited by the tools and techniques applicable to the auditory system. Our studies focus on the utilization of advanced optical techniques to study both prestin and OHCs, including fluorescence resonance energy transfer (FRET)30 and fluorescence recovery after photobleaching (FRAP). Recent work has highlighted the power of optical imaging techniques to address fundamental questions in membrane biophysics,31, 32 and here we describe our implementation of FRAP, a classical technique, to examine the lateral mobility of prestin in the HEK cell plasma membrane. FRAP theory was initially developed by Axelrod 33 and is an established and broadly employed fluorescent technique31, 34, 35, 36, 37, 38 used to describe the diffusion of biological molecules of interest. Important FRAP parameters providing information on the lateral mobility include: the immobile fraction which is the fraction of molecules that are unable to freely diffuse during the time course of experimentation; the effective diffusion coefficient of the fluorescent molecule ( ); and a time constant ( ) yielding information on the recovery rate postbleaching. In addition to supplying individual quantitative values for these parameters, when looking at several factors in combination, FRAP studies help characterize the mobility behaviors of proteins. For example, FRAP can be used to evaluate the in-vivo effects of membrane microdomains or lipid rafts on the mobility of various proteins.38 FRAP has also been previously applied to gather information about lipid diffusion and interactions in OHCs,10, 39, 40, 41 as well as to study protein diffusion in the OHC stereocilia.42 In this work, we qualitatively and quantitatively describe the lateral mobility of prestin-GFP in HEK cell plasma membranes and also provide comparisons to a different transmembrane protein, human somatostatin receptor subtype 5 (SSTR5). Our FRAP results show obvious differences in the diffusion behavior of prestin-GFP as compared to SSTR5-GFP. The work presented here is the first report directly describing, characterizing, and quantifying the lateral mobility of prestin, and is consistent with new evidence describing the presence of oligomeric populations of prestin, which may play a functional role in OHC electromotility.23, 30, 43 Furthermore, details about the mobility of prestin help describe the temporal organization of prestin in the plasma membrane, and may provide information on the magnitude and extent of speculated interactions between prestin and the underlying cortical cytoskeleton. All these questions have bearing on the larger issue of elucidating the role of prestin in electromotile axial deformations.12 Moreover, this study illustrates the power and potential of utilizing optical techniques to obtain molecular information beneficial to auditory research. 2.Materials and Methods2.1.Cell CultureHEK cells are cultured in Dulbeccos’s modified Eagle medium (DMEM) with HEPES 4-(2-hydroxyethyl)-1-piperazineethanesulfonic acid, , 10% bovine calf serum (BCS), and 1% Pen-Strep under standard conditions of , 95% humidity, and 5% . Cells are fed on alternate days and passaged at confluency, usually . For experimentation, cells are plated in glass bottom dishes (MatTek Corporation, Ashland, Massachusetts) coated with a second layer of poly-d-lysine by placing of poly-d-lysine (BD Biosciences, Bedford, MA) in in the dish for . Then dishes are rinsed in phosphate-buffered saline (PBS), dried, and stored in a sterile, dark container. 2.2.Plasmids and TransfectionPrestin-GFP constructs, a gift from Pereira, Baylor College of Medicine, were created using the vector pEGFP-N3 (Clontech, Palo Alto, California) as previously described.30 Human SSTR5-GFP constructs were generously donated by Smith of Baylor College of Medicine and used the vector (Perkin Elmer, Boston, Massachusetts). Cells are plated prior to transfection at a density of 500,000 cells/well in tissue culture treated six-well plates. In a polypropylene tube, a commercially available liposomal reagent, FuGENE 6 (Roche Applied Science, Indianapolis, Indiana), is complexed with DNA in a ratio of , and transfection follows product literature. Briefly, appropriate amounts of FuGENE 6, plasmid, and serum/Pen-Strep-free media are combined to a total volume of for each transfection well and allowed to incubate for . The transfection complex is then added dropwise to cell cultures, and post-transfection, cells are trypsinized and plated in MatTek dishes at a density of . All FRAP experiments are performed post-transfection to allow for sufficient prestin trafficking to the plasma membrane.44 2.3.Data AcquisitionImaging is performed on a Zeiss LSM 510 laser scanning confocal microscope (LSM) utilizing a Plan-Apochromat, NA 1.4 objective. Prestin-GFP is excited with light from a argon/two laser set at 50% output, corresponding to a tube current of . images, corresponding to , are obtained with 5% laser transmission, at a digital zoom of 2, and with a pixel dwell time of . The emission signal is passed through a main dichroic to eliminate the excitation light and a secondary beamsplitter, which passes light above . The emission signal is then directed through a bandpass filter. The detector gain is set between 700 to 900 with an amplifier offset of and an amplifier gain of 1. These settings were empirically determined to optimize saturated and zero-valued pixels. For FRAP experiments, cells are bathed in sterile PBS at , and five regions of interest (ROIs) are monitored (Fig. 1 ). The large region is and is the area continually scanned during the bleach experiment. The four circular ROIs are in diameter and represent the bleaching region, a background region, and two control regions to monitor undesired photobleaching that may occur due to repeated scanning. Each experiment consists of a time series of 410 scans of the large region, each taking , with a delay between scans. Irreversible photobleaching of the bleach region is performed with 40 iterations for prestin-GFP and 60 iterations for SSTR5-GFP using 100% laser transmission, which require 1.46 and , respectively. The first bleach occurs after ten scans of the large ROI and is repeated to create the second bleach after 210 scans of the large ROI. Bleach parameters are empirically determined and correspond to a bleaching efficiency ( ) (decrease in intensity) of 60 to 75%. Whenever possible, each experiment is performed on a different cell. However, if the same cell is used multiple times, the selected ROIs are always positioned far away from those used in previous experiments. Fig. 1Images and experimental FRAP curves for HEK cells transfected with either prestin-GFP or SSTR5-GFP. (a) through (d) Images of transfected cells shown as a bright field overlay followed by GFP fluorescence. Example ROIs are shown, with 1 being the large rectangular region scanned during experimentation ; 2 being the bleach ROI; 3 and 4 the control ROIs; and 5 the background ROI (all with diameter ). (a) and (b) Prestin-GFP. (c) and (d) SSTR5-GFP. (e) and (f) Normalized, averaged experimental recovery curves for the two proteins are shown bounded by curves representing the standard deviation (SD) in intensity at each time point. (e) Prestin-GFP . (f) SSTR5-GFP . 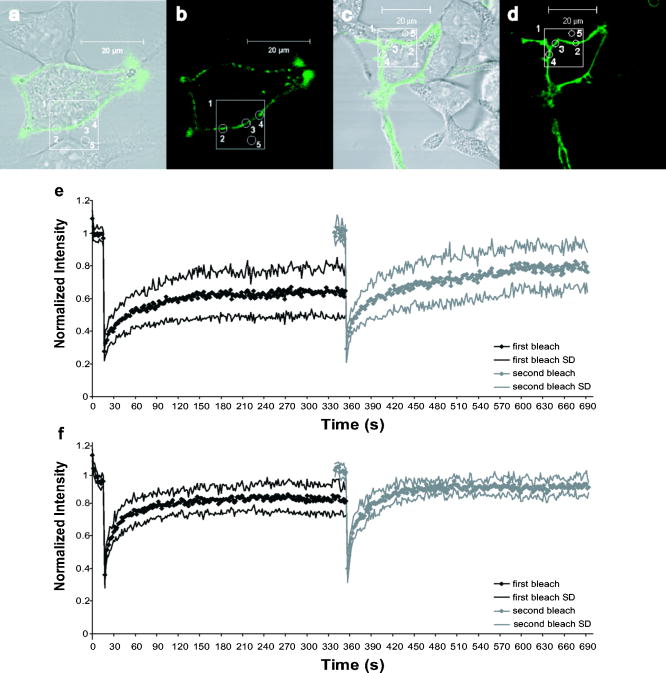 2.4.Data AnalysisFluorescent intensity is quantified using the Zeiss AIM physiology software package designed for the LSM 510. The raw data output is a single time point corresponding to the beginning of each scan and the average intensity of a selected ROI during that scan. For comparative FRAP experiments, it is important to characterize two experimental factors: bleaching efficiency ( ) and photobleaching due to repeated scanning ( ). Undesired photobleaching during scanning is calculated from the control ROIs using Eq. 1, where and are averages of the first and last ten data points, respectively. Some is inherent to imaging studies, but a large drop in intensity throughout the experiment will clearly confound results. Data were not corrected for this undesired bleaching, since doing so decreased the signal-to-noise ratio in most cells and as may be an overestimate due to the diffusion of bleached molecules into the control ROI following the first bleach. For all individual cells, was less than 25%. To produce a recovery curve, the bleach ROI intensity is first background subtracted at each time point using values from the background ROI. Data are then normalized by dividing each intensity point by the average value of the ten prebleach scans. This is repeated for the second bleach by averaging scans 200 to 210 as the prebleach scans (Fig. 2 ). Bleaching efficiency is reported from the normalized intensities following Eq. 2, where is the first postbleach intensity value, from scan 11, and is also shown in Fig. 2.The immobile fraction is also calculated from normalized bleach ROI intensities as shown in Eq. 3.The parameters , , and are evaluated from the raw data of each individual cell and then reported as an average of cells.Fig. 2Sample recovery curve for a double bleaching FRAP protocol. The data were recorded from HEK cells labeled with a fluorescent lipid analog probe, di-8-ANEPPS (Molecular Probes, D-3167), which typically yields simple, characteristic curves. Intensity values used to calculate FRAP parameters are notated. The first subscript describes the time period, and the second designates the bleach number. is the initial, prebleach intensity of the first bleach. Representative depictions of FRAP parameters are also shown, where is the bleaching efficiency, is the immobile fraction, is the time to reach to 50% of the first recovery plateau value, and is the time to recover 50% of the intensity lost during the first bleach period.  In this study, we aim to determine values for the effective diffusion coefficient ( ) that we feel are accurate estimations of prestin lateral mobility as opposed to a more empirical parameter used to compare proteins or treatment groups. To this end, is determined by fitting normalized recovery data to the 1-D solution of the diffusion equation averaged over a line coincident with the membrane. The analytical solution requires two main assumptions. First, the bleaching efficiency should be complete (100%), instantaneous, and occur solely along the line of membrane enclosed in the bleach ROI. That is, there should be no bleaching outside of the distinct borders of the ROI. Second, the line with length corresponding to the diameter of the bleach ROI, , has negligible width. The general form of the diffusion equation in 1-D is: This equation is solved on an infinite line, , with the bleached segment of length centered at . Following Soumpasis,45 we consider the diffusion of bleached molecules out of the bleach ROI and along the line of the membrane subject to the initial conditions: for , and outside this region, where is immediately postbleach.The solution can be written as:46 As the ROI function determines the average intensity in a region at each time point, the average value of Eq. 5 is then calculated by taking the integral over a line corresponding to the diameter of the bleach ROI, . This is then subtracted from unity to form an equation for the diffusion of unbleached molecules into the ROI. where is the average intensity value.We validate this model with our experimental design, in which all images are taken with confocal optical slices by setting the pinhole to 1.31 Airy units, corresponding to an image depth of . However, the actual bleaching takes place in a larger cone projecting above and below this strip. For a cell geometry approximating a flattened sphere, we assume this bleach cone drastically reduces diffusion in the direction, from the substrate up through the cell. The second, in-plane, dimension is removed by assuming that bilayer flip-flop is not a possible recovery direction. Thus we are left with 1-D diffusion along a thin line of membrane. However, prestin-GFP diffusion into the bleach ROI is actually a complex 3-D process, and our simplification likely induces some deviation from the true diffusion coefficient. Nonlinear least-squares fits are performed in Matlab (The MathWorks, Incorporated, Natick, Massachusetts) using Eq. 6 with three free parameters: the effective diffusion coefficient ( ), a scaling coefficient to account for immobile fractions, and an offset to account for less than 100%. We also report values for characteristic recovery times. Traditionally, the recovery time constant is defined as the time point at which the intensity of the bleach ROI reaches 50% of the plateau or asymptote level.34 We have also calculated a slightly different recovery time designated , which is the time to recover half the intensity lost during the bleach period. We empirically determine these time constants by solving the fit equation produced in Matlab for specific time points. is the time at which the intensity has recovered to 50% of the plateau value, and is the point at which recovery reaches 50% of the intensity lost during the bleach period. Both time constants are reported with reference to the time immediately postbleach as . It is important to note and are not directly calculated from Eq. 6, as this equation is not described by a single, simple time constant. Cell pools are constructed from single transfections, such that each cell included originated from the same population and passage number. Thus, the data presented are a single representative pool consisting of 9 and 7 experiments for prestin-GFP and SSTR5-GFP, respectively. For both constructs, comparisons between cell pools and across transfections showed similar results and parameter values (data not shown). Statistical significance is determined using a Student’s -test or analysis of variance (ANOVA) analyses as appropriate. 3.ResultsDuring FRAP experiments, HEK cells expressing prestin-GFP in the plasma membrane are exposed to laser light to record a baseline fluorescent intensity. The transmission of the laser is then drastically increased, resulting in irreversible photobleaching of GFP within a defined region of interest (ROI). The laser power is then returned to the initial level, and the recovery of GFP fluorescence is monitored over time as prestin molecules diffuse into and out of the selected ROI. Data are examined both qualitatively and quantitatively to describe the lateral mobility of prestin-GFP in HEK cell plasma membranes. As a control comparison to prestin lateral mobility and behavior, we also transfected HEK cells with an SSTR5-GFP fusion construct. The SSTR (somatostatin receptor) family has five members, all of which are G-protein coupled receptors with seven transmembrane domains.47, 48 In vivo, the receptors couple to a wide variety of secondary cascades in neuronal, endocrine, and immune cells and tissues.47, 48 Studies of the SSTR subtypes, including SSTR5, have been previously conducted using transfected HEK cells as a model system,47, 48, 49 supporting our choice of SSTR5 as a comparison protein for prestin lateral mobility in the HEK cell model. Confocal fluorescence imaging [Figs. 1a, 1b, 1c, 1d] shows qualitative differences between prestin-GFP and SSTR5-GFP localization. In Figs. 1a and 1b, the prestin-GFP signal, while mainly expressed in the plasma membrane, does not appear homogeneous. This punctate labeling is typical of HEK cells transfected with prestin. In the SSTR5 images [Figs. 1c and 1d], however, the membrane appears cleanly and evenly labeled. The recovery curves [Figs. 1e and 1f] also show distinct qualitative differences even though the postbleach recovery, as monitored visually during experimentation, is similar for both protein constructs with a relatively uniform increase in fluorescence reappearing over time in the membrane segment spanning the bleach ROI. The time course of prestin-GFP diffusion appears slower and reaches lower recovery levels than SSTR5-GFP for both bleaches. In control experiments, transfected HEK cells fixed for in 4% paraformaldehyde in PBS show the expected lack of recovery (data not shown). When performing FRAP, the bleaching efficiency ( ) should be as uniform as possible, allowing for interexperiment comparisons and to maintain consistent signal-to-noise ratios in the regions of very low intensity that occur immediately following the bleach period. is shown in Fig. 3 , and was similar throughout experiments. The only significant difference was found when comparing the decrease in prestin-GFP and SSTR5-GFP intensity created by the second bleaching period. Interestingly, the SSTR5-GFP construct required more iterations of high laser transmission over the bleach ROI to reach a bleaching efficiency commensurate with that recorded for prestin-GFP. The difference in between the two constructs was also observed in fixed cells (data not shown). The variation could be due to higher expression level of SSTR5-GFP in HEKs, which is possible, as the codons have been humanized. Regardless, the average values of for both proteins and both bleach periods are closely clustered at 60 to 75%. Fig. 3Bleaching efficiency and immobile fraction. The bleaching efficiency was found to be different only between proteins for the second bleach period, but all values are 60 to 75%. The immobile fraction is different for the first and second bleaches of prestin, and also between prestin and SSTR5 during the first bleach. Values are calculated as averages of nine and seven experiments for prestin-GFP and SSTR5-GFP, respectively, with error bars representing standard deviation ( , § , 2 factor ANOVA, with designating comparison between constructs and § designating comparison between bleaches).  In our FRAP protocol, we perform two consecutive bleaches on the same ROI.35, 36 The recovery curves, each of 210 total scans, are then independently normalized for comparison (Fig. 2). This type of double bleaching protocol can provide additional insight into the . If the protein of interest is truly immobile, molecules permanently bleached during the first bleach will not add to the fluorescent signal monitored during the second bleach. Thus the second bleach should approach complete, or 100%, recovery. In this study, the for prestin was larger than SSTR5 for both bleaches and showed statistical significance between the two proteins during the first bleach ( , 2-factor ANOVA). Prestin values were 49 and 29% for the first and second bleaches, respectively, while the SSTR5 were 28% and 17%. Moreover, the for prestin-GFP were significantly different between bleaches ( , 2-factor ANOVA). Both the qualitative nature of the recovery curves and the parameters and were highly consistent across pools of prestin-GFP transfected HEK cells and also for different rates of image collection (data not shown). Values for , the effective diffusion coefficient, and the characteristic recovery times and , are determined from theoretical fits to the 1-D diffusion equation and are listed along with all parameters in Table 1 . The values for all fits are at or greater than 0.94, and the raw data and fits are presented in Fig. 4 , along with the 95% confidence bounds. Similar to Fig. 1, qualitative differences in shape and recovery between the prestin and SSTR5 fits are readily apparent. Values for were 0.063 and for the first and second bleaches of prestin-GFP, and 0.182 and for SSTR5-GFP. Fig. 4Prestin-GFP and SSTR5-GFP averaged data curves with 1-D fits. Experimental data curves are shown as points and correspond to those in Fig. 1. The 1-D diffusion equation fits are represented as solid lines, and the 95% confidence bounds to those fits as dashed lines. (a) Prestin-GFP. and 0.96 for the first and second bleaches, respectively, and (b) SSTR5-GFP. and 0.94.  Table 1FRAP parameters. Experimental and fitted FRAP parameters for HEK cells transfected with either prestin-GFP or SSTR5-GFP. Top section: the bleaching efficiency (B) , photobleaching during scanning (PB) , and the immobile fraction (IF) are calculated directly from the data and shown as mean±standard deviation. PB is determined for a complete experiment comprising both a first and second bleach period. n=9 for prestin-GFP and n=7 for SSTR5-GFP. Bottom section: characteristic recovery times ( τ1∕2 and τB ) and effective diffusion coefficients (D) are derived from the curve-fitting process and shown as the calculated value centered above the 95% confidence bounds in parentheses. τ1∕2 is the time point at which the intensity of the bleach ROI reaches 50% of the plateau or asymptote level, and τB is the time to recover half the intensity lost during the bleach period.
The recovery time constant ( ) represents the time point when the recovery curve reaches 50% of the asymptote or plateau value.34 For the prestin-GFP construct increased between the first and second bleaches and was calculated to be and , respectively. The first and second bleach values for SSTR5-GFP are 7.5 and , and the time constants can be visually verified from the curves presented in Figs. 1 and 4. Because the calculation of is dependent on the recovery curve plateau region, we are also reporting a characteristic time, termed , based on the extent of bleaching. is defined as the time point at which the bleach ROI recovers 50% of the intensity lost during the bleach period. For both constructs, decreases from first to second bleach. SSTR5-GFP characteristic recovery times went from , while for prestin-GFP dropped from , a significant decrease. A decrease in from first to second bleach is typical for our experimental results and data analysis. Although the trends from first to second bleach are different for and with respect to the accompanying changes in , it is both qualitatively and quantitatively clear that prestin lateral diffusion is consistently slower than that of SSTR5 (Figs. 1 and 4 and Table 1). When taken as a whole, the results presented here characterize the lateral mobility of prestin in the plasma membrane of HEK cells. The important findings of this study include the discrepancy in prestin-GFP recovery behavior seen during the first and second bleach, and the observation that prestin mobility is markedly different when compared to SSTR5. 4.DiscussionOur initial investigation of the lateral mobility of prestin in HEK cell plasma membranes yields intriguing results. To provide a benchmark for prestin-GFP diffusion, we performed comparisons to another transmembrane protein, SSTR5. Qualitatively, the speed and extent of prestin-GFP recovery increases with a second bleaching experiment, but still recovers to a lesser extent and on a slower time scale than SSTR5. SSTR5 is a 363 amino acid protein with a molecular weight of and an intracellular C-terminus,48 and it has been shown that SSTR5 can form homo- and heterodimers under various physiologic conditions.50, 51 For transmembrane proteins, the hydrodynamic Saffman-Delbrück model suggests a weak logarithmic dependence on protein radius , which is effectively the radius of the membrane spanning regions, since the viscosity of the membrane is much higher than the surrounding solutions.52, 53 Thus, although SSTR5 has seven transmembrane domains while prestin is purported to consist of 10 to 12, we do not feel the differences we report for the effective diffusion coefficients of the two proteins are a direct result of differences in . Confocal microscopy reveals distinct qualitative differences in labeling between the two constructs. Prestin-GFP shows punctate fluorescence, while SSTR5 appears homogeneous along the membrane, as in Fig 1. The puncta in prestin-GFP-expressing HEK cells vary in size and location. For FRAP experimentation, ROIs are stationed primarily on segments of the plasma membrane, which are continuously labeled along the diameter of the ROI. Since the ROI diameter is small, less than , it is not exceedingly challenging to locate a continuous strip of membrane fulfilling this requirement. The visualized postbleach recovery of prestin-GFP is qualitatively similar to that of SSTR5-GFP. The line of plasma membrane in the bleach ROI increases in intensity postbleach uniformly for both constructs. This behavior shows puncta do not form diffusional barriers and suggests a minimal influence of punctate prestin-GFP labeling on FRAP experiments. In this study, the quantitative values of are to 6 times larger for SSTR5-GFP than for prestin-GFP. also varies significantly between the first and second bleach experiments of prestin-GFP but not of SSTR5 (see Table 1). For prestin-GFP, drops between bleaches from , suggesting a decrease in mobility. This initially appears at odds with the qualitative observations and with the significant decrease in . However, reflects both the slope of the initial rise and the time to reach the plateau. From Fig. 1e it is apparent that the recovery curve for the second bleach of prestin-GFP requires a longer time period to reach a plateau. Additionally, the calculated values of reported for prestin-GFP bleaches, 0.063 and , are within reasonable estimates for protein-GFP diffusion in cellular plasma membranes.31, 34, 38 Methods for calculating vary greatly based on the imaging system and experimental design, so is not universally comparable across publications and is hence usually referred to as the effective diffusion coefficient. Since affects the entire shape of the recovery curve, attempts to give reported values physical significance in biological systems should be supplemented with other observations or parameters.34 Thus, it is common to complement calculations of with an empirical time constant such as and the . In some cases, determining the effective diffusion coefficient may be of less functional relevance than the calculation of the .37 The traditional values provided here show an increase in the recovery time constant for prestin-GFP between first and second bleaches, which logically follows from the two-fold decrease in seen between bleaches. The presented calculations for SSTR5-GFP remain similar between bleaches, 7.5 and , as do the values of . However, is defined as the time point where the recovery curve reaches 50% of the plateau value, so if a definitive plateau is not reached, this will lead to underestimates of the recovery time constant. It should then be noted that the second bleach of prestin-GFP may not reach a steady-state recovery plateau during the time course of the experiment. Preliminary work with longer durations, as opposed to , does not conclusively show more distinct plateau regions in the raw data (data not shown). Monitoring recovery for longer time periods is also hampered by sample drift, which is difficult to correct with the fast acquisition time we employ. To adjust for this possible source of error, we have also chosen to report a characteristic time , which describes the time required for the GFP to recover 50% of the intensity lost during the bleach period. As shown in Table 1, the for prestin-GFP is greatly decreased from first to second bleach, , but is still lagging that of SSTR5-GFP, . Almost all proteins have some diffusional limitations in a cellular plasma membrane, and an average of 10 to 15% was reported from a mobility study of various proteins.38 Based on this estimate, our data show quite notable results, demonstrating that the extent of prestin-GFP recovery during the time course of these experiments is much less than that of SSTR5-GFP. The of prestin for the second bleach remains substantial at 29%, suggesting that prestin-GFP molecules may be transiently constrained within the HEK cell plasma membrane. In other words, the molecules comprising the may not be truly immobile. Instead, molecules may become constrained in a membrane region for a time period on the order of a few minutes, possibly corresponding to less than the time for each bleach experiment. Then these molecules could be released during or between experiments, supplementing a true immobile fraction in the measured decrease in reported for the second bleach. Thus, the is not a constant value. However, the can be an overestimate of the population of molecules that cannot diffuse during an experiment due to the continual bleaching caused by imaging, . We have kept this bleaching low for prestin and SSTR5, averaging 12 and 13%, respectively, which is commensurate with values from fixed cells. values may also be overestimated if the recovery curve fails to completely reach steady state during the experimental time course, as may be the case for the second bleach of prestin. There are two previous reports describing the lateral mobility of prestin in the native OHC based on electrophysiological recordings.25, 26 In 2001, Takahashi and Santos-Sacchi detected and mapped stress-induced displacement currents in the OHC, which provided additional evidence that prestin, as the motor protein, endows these cells with piezoelectric properties.25 Their results show a nonuniformity of evoked currents, suggesting limited lateral mobility of motors in the OHC, as freely diffusing motors would likely produce spatially independent currents. They also provide an alternate hypothesis, where variations in evoked currents along the length of the OHC could be due to the nature of the membrane itself along the lateral wall. In a later study, Santos-Sacchi and Zhao conducted experiments involving the irreversible photoinactivation of prestin, and through indirect measurements concluded that prestin diffuses within the lateral plasma membrane of OHCs.26 These two reports are not mutually exclusive, and may support our results in transfected HEK cells, as they established prestin mobility in the OHC. While prestin is unable to migrate to the basal pole of the cell, even on cytoskeletal degradation, it is capable of lateral mobility in the membrane, although diffusion may be limited when compared to an untethered membrane protein.25, 26 This is consistent with our hypothesized transient confinement of prestin-GFP in the HEK cell. From the photoinactivation experiments, a value for the diffusion coefficient of prestin was roughly estimated based on an infinite sink model.26 The application of this model required calculating the surface area for the lateral membrane, which varies significantly along the cochlea as OHC length changes. An estimation for the motor density was also needed, and the authors chose , which is on the high end of a range they cited in their previous work.25 In addition, they found the data were not fit by a single diffusion coefficient, and instead reported two values of that bracket the data, one fitting to the initial stage of the experimental curve and one fitting the later portion. Thus, the range of diffusion coefficients, , is larger than those we measure in HEK cells. It is important to note these effective diffusion coefficients are highly model-dependent, so making comparisons between reports is not always straightforward. Nevertheless, this study concluded that the lack of a complete fit implies phenomena other than simple, fixed-course diffusion are taking place, which is in accordance with the prestin-GFP data we present here. The reported photoactivation of prestin26 was induced by either whole cell light exposure or confined exposure of a region of the OHC lateral wall for periods of . Our large ROI measures only , and a single scan of this region lasts , after which there is a delay before the next scan initiates. We do not believe this limited exposure, although repeated many times during an experiment, will induce the magnitude of photoinactivation reported by Santos-Sacchi and Zhao. Additionally, while the nonlinear capacitance, the electrophysiological measurement utilized in that study, is a clear electrical signature of prestin, it does not necessarily completely correlate to prestin function. Although the reported photoinactivation results merit further investigation, there is not sufficient evidence to suggest inactivation would alter the lateral mobility of prestin. In our current observations, there are several possible mechanisms to explain the observed restrained, albeit transiently, lateral diffusion of prestin-GFP as described by an initial approaching 50% and values of or less. Additionally, prestin-GFP recovery time constants were 2.5 to 3 times longer than those for SSTR5-GFP, while the characteristic recovery times were 5 to 12 times longer. The lateral mobility of proteins in the plasma membrane may be affected by the environmental viscosity; protein aggregation, complexing, or binding; compartmental confinement by either lipid domains or the cytoskeleton; and the induction of convective flow.31 For these experiments and results, both flow and changes in viscosity are unlikely. Moreover, a recent study showed that the association of proteins with lipid rafts is not a major determinant of their mobility in the plasma membrane,38 suggesting that distinct lipid microdomains may not be sufficient to induce the lateral mobility characteristics of prestin-GFP. New FRAP studies of lipids in the native OHC propose interactions between the cortical lattice and the plasma membrane that would likely also affect prestin diffusion.41 This could be supplemental to a suggested connection between prestin in the plasma membrane and the OHC cortical lattice as a mechanism of force transmission. However, previous work examining prestin diffusion in OHCs after cytoskeletal digestion with Pronase suggested the removal of the cytoskeleton did not increase prestin diffusion, since the basal region of the cell remained devoid of motor molecules as measured electrophysiologically.25 In terms of protein aggregation or binding, FRET studies indicate that prestin-fluorescent protein chimeras form oligomers or complexes when expressed in the membrane of HEK cells.23, 30 These observations are supported by biochemical data showing the presence of multimeric forms of prestin in both model systems and OHCs.43, 44 The largest of these reported in-vivo oligomers, tetramers,43 may represent enough of an increase in molecular weight or hydrodynamic radius for FRAP to detect changes in diffusion behavior. It is also possible that such oligomeric forms of prestin are more likely to encounter other barriers to diffusion. This could include interactions with other transmembrane or membrane-associated proteins via direct binding or molecular crowding, as well as fencing by the cortical cytoskeleton.31, 38 Finally, in the model HEK cells, the overexpression of prestin may hinder its own diffusion. However, indirect measurements of prestin diffusion in the native OHC also suggest there is some inherent restraint on prestin mobility, as it does not have diffusional properties matching that of a theoretical untethered protein.25, 26 The hypothesis of transient prestin confinement introduced previously can be additionally supported by the curious and unexpected decrease in from first to second bleach while the decreases as anticipated. The drop in between bleaches is somewhat counterintuitive when compared to the qualitative increase in lateral mobility seen in the recovery curves (Figs. 1 and 4). However, in a recent publication37 Houtsmuller presented simulated FRAP recovery curves that are remarkably similar to those we report for the second bleach of prestin-GFP (Figs. 1 and 4). Of particular interest, the simulations illustrate that the recovery curves for a molecule with a low are identical to those calculated for a molecule with a larger if 30% of the molecules are transiently immobilized. Thus, when using the model we employ here, the presence of a transiently confined population of molecules can result in a significantly lowered calculation of . Although a transiently confined prestin-GFP molecule can explain our data, other complex diffusion behaviors could account for the recovery behavior of prestin-GFP following the second bleach. This curve may, in fact, represent two populations with differing effective diffusion coefficients. One population may dominate the initial recovery period after the first bleach, slightly masking complex diffusion, which then becomes apparent after the second bleach. These populations could be segregated based on molecular weight, consistent with data on the oligomerization state of prestin. However, various populations described by differing values of could also be unrelated to size, especially as FRAP is not particularly sensitive to small increases in molecular weight. Instead, the functional state of prestin may have an affect on diffusion, specifically if local voltages or stresses can induce conformational changes in the protein. Future work will focus first on alterations of the model that may show the existence of two populations with different recovery behaviors, hopefully providing clarification between the possible mechanisms affecting and controlling prestin-GFP lateral mobility in the HEK cell. Although one limitation of single FRAP control experiments is the inability to specifically distinguish between the various cellular mechanisms affecting diffusion, by analyzing the various FRAP parameters in parallel, we have gathered both qualitative and quantitative information about the lateral mobility of prestin-GFP in the HEK cell plasma membrane. Future FRAP experiments involving perturbations of the system will likely help elucidate which mechanism(s) affect prestin diffusion. In conclusion, this study characterizes the unique lateral mobility of prestin-GFP as compared to that of SSTR5-GFP. Prestin clearly diffuses differently than SSTR5 and may be transiently confined within the HEK plasma membrane through the formation of aggregates of oligomers and/or via interactions of the cortical cytoskeleton with either the plasma membrane or with prestin itself. Alternatively, prestin-GFP may exist in several forms or populations, each with a characteristic diffusion behavior. Importantly, both of these hypotheses have potential implications for prestin behavior in the native OHC. This work lays a solid foundation for studying the lateral mobility of prestin, and also demonstrates the application of an advanced optical technique to address current issues in the auditory field. AcknowledgmentsThis work was supported by a NSF-IGERT Training Grant DGE-0114264 and a NIH NRSA predoctoral fellowship F31 DC-008058-01 (L.E.O.). Additional funding was provided by NIDCD (DC008134), NSF CAREER (BES 044379), and NSF MRI (BES 0321275) grants (R.M.R.). Special thanks to Jenni Greeson for technical help and general support, to Imran Quraishi for assistance with data analysis, to Ryan McGuire for molecular biology work, and to Fred A. Pereira of Baylor College of Medicine for developing plasmids and his expertise. ReferencesW. E. Brownell,
C R. Bertrand, and
Y. de Ribaupierre,
“Evoked mechanical responses of isolated cochlear outer hair cells,”
Science, 227
(4683), 194
–196
(1985). https://doi.org/10.1126/science.3966153 0036-8075 Google Scholar
B. Kachar,
W. E. Brownell,
R. Altschuler, and
J. Fex,
“Electrokinetic shape changes of cochlear outer hair cells,”
Nature (London), 322
(6077), 365
–368
(1986). https://doi.org/10.1038/322365a0 0028-0836 Google Scholar
J. F. Ashmore,
“A fast motile response in guinea-pig outer hair cells: the cellular basis of the cochlear amplifier,”
J. Physiol. (London), 388 323
–347
(1987). 0022-3751 Google Scholar
M. C. Liberman,
J. Gao,
Z. He,
X. Wu,
S. Jia, and
J. Zuo,
“Prestin is required for electromotility of the outer hair cell and for the cochlear amplifier,”
Nature (London), 419
(6904), 300
–304
(2002). https://doi.org/10.1038/nature01059 0028-0836 Google Scholar
B. C. J. Moore, Cochlear Hearing Loss, Whurr Publishers Ltd., London
(2002). Google Scholar
W. E. Brownell,
A. A. Spector,
R. M. Raphael, and
A. S. Popel,
“Micro- and nanomechanics of the cochlear outer hair cell,”
Annu. Rev. Biomed. Eng., 3 169
–194
(2001). https://doi.org/10.1146/annurev.bioeng.3.1.169 1523-9829 Google Scholar
M. C. Holley and
J. F. Ashmore,
“Spectrin, actin and the structure of the cortical lattice in mammalian cochlear outer hair cells,”
J. Cell. Sci., 96 283
–291
(1990). 0021-9533 Google Scholar
M. C. Holley,
F. Kalinec, and
B. Kachar,
“Structure of the cortical cytoskeleton in mammalian outer hair cells,”
J. Cell. Sci., 102 569
–580
(1992). 0021-9533 Google Scholar
M. C. Holley and
J. F. Ashmore,
“A cytoskeletal spring in cochlear outer hair cells,”
Nature (London), 335
(6191), 635
–637
(1988). https://doi.org/10.1038/335635a0 0028-0836 Google Scholar
M. Zhang and
F. Kalinec,
“Structural microdomains in the lateral plasma membrane of cochlear outer hair cells,”
J. Assoc. Res. Otolaryngol., 3
(3), 289
–301
(2002). 1525-3961 Google Scholar
F. Kalinec,
M. C. Holley,
K. H. Iwasa,
D. J. Lim, and
B. Kachar,
“A membrane-based force generation mechanism in auditory sensory cells,”
Proc. Natl. Acad. Sci. U.S.A., 89
(18), 8671
–8675
(1992). 0027-8424 Google Scholar
A. A. Spector,
N. Deo,
K. Grosh,
J. T. Rathnanther, and
R. M. Raphael,
“Electromechanical models of the outer hair cell composite membrane,”
J. Membr. Biol., 209
(2–3), 135
–152
(2006). 0022-2631 Google Scholar
K. H. Iwasa,
“A membrane motor model for the fast motility of the outer hair cell,”
J. Acoust. Soc. Am., 96
(4), 2216
–2224
(1994). https://doi.org/10.1121/1.410094 0001-4966 Google Scholar
P. Dallos,
R. Hallworth, and
B. N. Evans,
“Theory of electrically driven shape changes of cochlear outer hair cells,”
J. Neurophysiol., 70
(1), 299
–323
(1993). 0022-3077 Google Scholar
J. Santos-Sacchi,
“Harmonics of outer hair cell motility,”
Biophys. J., 65
(5), 2217
–2227
(1993). 0006-3495 Google Scholar
R. M. Raphael,
A. S. Popel, and
W. E. Brownell,
“A membrane bending model of outer hair cell electromotility,”
Biophys. J., 78
(6), 2844
–2862
(2000). 0006-3495 Google Scholar
J. Santos-Sacchi,
“New tunes from Corti’s organ: the outer hair cell boogie rules,”
Curr. Opin. Neurobiol., 13
(4), 459
–468
(2003). https://doi.org/10.1016/S0959-4388(03)00100-4 0959-4388 Google Scholar
J. Ludwig,
D. Oliver,
G. Frank,
N. Klèocker,
A. W. Gummer, and
B. Fakler,
“Reciprocal electromechanical properties of rat prestin: the motor molecule from rat outer hair cells,”
Proc. Natl. Acad. Sci. U.S.A., 98
(7), 4178
–4183
(2001). https://doi.org/10.1073/pnas.071613498 0027-8424 Google Scholar
J. Zheng,
K. B. Long,
W. Shen,
L. D. Madison, and
P. Dallos,
“Prestin topology: localization of protein epitopes in relation to the plasma membrane,”
NeuroReport, 12
(9), 1929
–1935
(2001). 0959-4965 Google Scholar
P. Dallos and
B. Fakler,
“Prestin, a new type of motor protein,”
Nat. Rev. Mol. Cell Biol., 3
(2), 104
–111
(2002). 1471-0072 Google Scholar
P. Dallos,
J. Zheng, and
M. A. Cheatham,
“Prestin and the cochlear amplifier,”
J. Physiol. (London), 576
(1), 37
–42
(2006). 0022-3751 Google Scholar
H. J. Adler,
I. A. Belyantesva, R. C. Merritt Jr., G. I. Frolenkov,
G. W. Dougherty, and
B. Kachar,
“Expression of prestin, a membrane motor protein, in the mammalian auditory and vestibular periphery,”
Hear. Res., 184
(1–2), 27
–40
(2003). 0378-5955 Google Scholar
D. Navaratnam,
J. P. Bai,
H. Samaranayake, and
J. Santos-Sacchi,
“N-terminal-mediated homomultimerization of prestin, the outer hair cell motor protein,”
Biophys. J., 89
(5), 3345
–3352
(2005). 0006-3495 Google Scholar
N. Yu,
M. L. Zhu, and
H. B. Zhao,
“Prestin is expressed on the whole outer hair cell basolateral surface,”
Brain Res., 1095
(1), 51
–58
(2006). 0006-8993 Google Scholar
S. Takahashi and
J. Santos-Sacchi,
“Non-uniform mapping of stress-induced, motility-related charge movement in the outer hair cell plasma membrane,”
Pfluegers Arch. Gesamte Physiol. Menschen Tiere, 441
(4), 506
–513
(2001). 0365-267X Google Scholar
J. Santos-Sacchi and
H. B. Zhao,
“Excitation of fluorescent dyes inactivates the outer hair cell integral membrane motor protein prestin and betrays its lateral mobility,”
Pfluegers Arch. Gesamte Physiol. Menschen Tiere, 446
(5), 617
–622
(2003). 0365-267X Google Scholar
J. Zheng,
W. Shen,
D. Z. He,
K. B. Long,
L. D. Madison, and
P. Dallos,
“Prestin is the motor protein of cochlear outer hair cells,”
Nature (London), 405
(6783), 149
–155
(2000). https://doi.org/10.1038/35012009 0028-0836 Google Scholar
J. Santos-Sacchi,
W. Shen,
J. Zheng, and
P. Dallos,
“Effects of membrane potential and tension on prestin, the outer hair cell lateral membrane motor protein,”
J. Physiol. (London), 531
(3), 661
–666
(2001). https://doi.org/10.1111/j.1469-7793.2001.0661h.x 0022-3751 Google Scholar
D. Oliver,
“Intracellular anions as the voltage sensor of prestin, the outer hair cell motor protein,”
Science, 292
(5525), 2340
–2343
(2001). https://doi.org/10.1126/science.1060939 0036-8075 Google Scholar
J. N. Greeson,
L. E. Organ,
F. A. Pereira, and
R. M. Raphael,
“Assessment of prestin self-association using fluorescence resonance energy transfer,”
Brain Res., 1091
(1), 140
–150
(2006). 0006-8993 Google Scholar
J. Lippincott-Schwartz,
E. Snapp, and
A. Kenworthy,
“Studying protein dynamics in living cells,”
Nat. Rev. Mol. Cell Biol., 2
(6), 444
–456
(2001). 1471-0072 Google Scholar
K. Jacobson,
E. D. Sheets, and
R. Simson,
“Revisiting the fluid mosaic model of membranes,”
Science, 268
(5216), 1441
–1442
(1995). https://doi.org/10.1126/science.7770769 0036-8075 Google Scholar
D. Axelrod,
D. E. Koppel,
J. Schlessinger,
E. Elson, and
W. W. Webb,
“Mobility measurement by analysis of fluorescence photobleaching recovery kinetics,”
Biophys. J., 16
(9), 1055
–1069
(1976). 0006-3495 Google Scholar
E. Snapp,
N. Altan, and
J. Lippincott-Schwartz,
“Measuring protein mobility by photobleaching GFP chimeras in living cells,”
Current Protocols in Cell Biology, 21.1
–21.1.24 John Wiley and Sons, New York
(2003). Google Scholar
J. Lippincott-Schwartz,
N. Altan-Bonnet, and
G. H. Patterson,
“Photobleaching and photoactivation: following protein dynamics in living cells,”
Nat. Cell Biol., S7
–14
(2003). 1465-7392 Google Scholar
D. A. Stavreva and
J. G. McNally,
“Fluorescence recovery after photobleaching (FRAP) methods for visualizing protein dynamics in living mammalian cell nuclei,”
Methods Enzymol., 375 443
–455
(2004). 0076-6879 Google Scholar
A. B. Houtsmuller,
“Fluorescence recovery after photobleaching: application to nuclear proteins,”
Adv. Biochem. Eng./Biotechnol., 95 177
–199
(2005). 0724-6145 Google Scholar
A. K. Kenworthy,
B. J. Nichols,
C. L. Remmert,
G. M. Hendrix,
M. Kumar,
J. Zimmerberg, and
J. Lippincott-Schwartz,
“Dynamics of putative raft-associated proteins at the cell surface,”
J. Cell Biol., 165
(5), 735
–746
(2004). 0021-9525 Google Scholar
J. S. Oghalai,
T. D. Tran,
R. M. Raphael,
T. Nakagawa, and
W. E. Brownell,
“Transverse and lateral mobility in outer hair cell lateral wall membranes,”
Hear. Res., 135
(1–2), 19
–28
(1999). 0378-5955 Google Scholar
J. S. Oghalai,
H. B. Zhao,
J. W. Kutz, and
W. E. Brownell,
“Voltage- and tension-dependent lipid mobility in the outer hair cell plasma membrane,”
Science, 287
(5453), 658
–661
(2000). https://doi.org/10.1126/science.287.5453.658 0036-8075 Google Scholar
J. H. Boutet de Monvel,
W. E. Brownell, and
M. Ulfendahl,
“Lateral diffusion anisotropy and membrane lipid/skeleton interaction in outer hair cells,”
Biophys. J., 91
(1), 634
–381
(2006). 0006-3495 Google Scholar
M. Grati,
M. E. Schneider,
K. Lipkow,
E. E. Strehler,
R. J. Wenthold, and
B. Kachar,
“Rapid turnover of stereocilia membrane proteins: evidence from the trafficking and mobility of plasma membrane -ATPase 2,”
J. Neurosci., 26
(23), 6386
–6395
(2006). 0270-6474 Google Scholar
J. Zheng,
G. G. Du,
C. T. Anderson,
J. P. Keller,
A. Orem,
P. Dallos, and
M. Cheatham,
“Analysis of the oligomeric structure of the motor protein prestin,”
J. Biol. Chem., 281
(29), 19916
–19924
(2006). 0021-9258 Google Scholar
A. K. Sturm,
L. Rajagopalan,
D. Yoo,
W. E. Brownell, and
F. A. Pereira,
“Functional expression and microdomain localization of prestin in cultured cells,”
Otolaryngol.-Head Neck Surg., 136
(3), 434
–439
(2007). 0194-5998 Google Scholar
D. M. Soumpasis,
“Theoretical analysis of fluorescence photobleaching recovery experiments,”
Biophys. J., 41
(1), 95
–97
(1983). 0006-3495 Google Scholar
M. Ozisik, Boundary Value Problems of Heat Conduction, Dover Publications, New York
(1968). Google Scholar
Y. C. Patel,
G. Bell,
D. H. Coy, and
F. C. Brunicardi,
“Activation of human somatostatin receptor type 2 causes inhibition of cell growth in transfected HEK293 but not in transfected CHO cells,”
J. Surg. Res., 71
(1), 13
–18
(1997). 0022-4804 Google Scholar
Y. C. Patel,
M. T. Greenwood,
R. Panetta,
L. Demchyshyn,
H. Niznik, and
C. B. Srikant,
“The somatostatin receptor family,”
Life Sci., 57
(13), 1249
–1265
(1995). 0024-3205 Google Scholar
A. Roth,
H. J. Kreienkamp,
R. B. Nehring,
D. Roosterman, W. Meyerhof, D. Richter,
“Endocytosis of the rat somatostatin receptors: subtype discrimination, ligand specificity, and delineation of carboxy-terminal positive and negative sequence motifs,”
DNA Cell Biol., 16
(1), 111
–119
(1997). 1044-5498 Google Scholar
M. Rocheville,
D. C. Lange,
U. Kumar,
R. Sasi,
R. C. Patel, and
Y. C. Patel,
“Subtypes of the somatostatin receptor assemble as functional homo- and heterodimers,”
J. Biol. Chem., 275
(11), 7862
–7869
(2000). 0021-9258 Google Scholar
M. Rocheville,
D. C. Lange,
U. Kumar,
S. C. Patel,
R. C. Patel, and
Y. C. Patel,
“Receptors for dopamine and somatostatin: formation of hetero-oligomers with enhanced functional activity,”
Science, 288
(5463), 154
–157
(2000). 0036-8075 Google Scholar
P. G. Saffman and
M. Delbrèuck,
“Brownian motion in biological membranes,”
Proc. Natl. Acad. Sci. U.S.A., 72
(8), 3111
–3113
(1975). https://doi.org/10.1073/pnas.72.8.3111 0027-8424 Google Scholar
Y. Gambin,
R. Lopez-Esparza,
M. Reffay,
E. Sierecki,
N. S. Gov,
M. Genest,
R. S. Hodges, and
W. Urbach,
“Lateral mobility of proteins in liquid membranes revisited,”
Proc. Natl. Acad. Sci. U.S.A., 103
(7), 2098
–2102
(2006). https://doi.org/10.1073/pnas.0511026103 0027-8424 Google Scholar
A. Kusumi and
Y. Sako,
“Cell surface organization by the membrane skeleton,”
Curr. Opin. Cell Biol., 8
(4), 566
–574
(1996). https://doi.org/10.1016/S0955-0674(96)80036-6 0955-0674 Google Scholar
|
|||||||||||||||||||||||||||||||||||||||||||||||||||


