
|
|
1.IntroductionFourier transform infrared (FTIR) microspectroscopy (MSP) has emerged as a powerful tool for chemical analysis because of its ability to provide detailed information on the spatial distribution of chemical composition at the molecular level.1 In applications requiring qualitative and quantitative analysis, the potential of IR spectroscopy to identify chemical components via fingerprinting analysis of their vibrational spectrum is unsurpassed. When this capability is coupled to an IR microscope, microspectroscopy of size samples and high contrast microscopy of 2-D samples based on chemical mapping become possible. Its applications cover a range of disciplines including material science, forensics, biochemistry, biomedical science, and geochemistry, comprising both basic and applied research goals.2, 3, 4, 5, 6 Apart from the conventional methods of cancer diagnosis, there is a need to develop new approaches that are safe, noninvasive, and effectively detect malignancy at earliest stages. Early detection of cancer is a guarantee in most cases of an effective treatment and in some cases for a complete cure. FTIR-MSP has shown encouraging trends in the field of cancer diagnosis in the last decade.7 The differences in the absorbance spectra in the mid-IR region between normal and abnormal tissues have been shown to be a possible criterion for detection and characterization of various types of cancers such as: colon,8, 9, 10 breast,11 leukemia,12, 13 cervical, 14, 15, 16, 17, 18, 19, 20 colorectal,21 skin,22, 23 brain,24 prostate,25, 26 and also neck and head tumors.27 Cell cultures are advantageous and more convenient for basic research,28, 29, 30, 31, 32, 33 compared to “real” tissues due to their homogeneity and the ability to control important culture parameters such as growth and malignant transformation rate. Moreover, malignant metamorphose can be monitored by light microscope, in parallel to the spectral measurements. Thus, cell cultures provide an ideal model for detecting early cellular changes during cell transformation. In the present work, we used two different cell cultures: murine fibroblast cell line (NIH/3T3) and mouse embryonic fibroblast (MEF, primary cells) as a model system to study early spectral changes induced by cancerous transformation. For this purpose, we first validated consistent spectral biomarkers that were found in previous studies as good biomarkers for detection of malignancy34, 35, 36, 37 using completely transformed fibroblast cell lines. These biomarkers were then utilized for the follow up of malignant cell transformation progression as a function of postinfection time. 2.Materials and Methods2.1.Cells and VirusesMurine fibroblast cell lines (NIH/3T3, long-term in vitro) and mouse embryonic fibroblast cells (MEF, primary cells) were grown at in Roswell Park Memorial Institute (RPMI) medium supplemented with 10% newborn calf serum (NBCS) and the antibiotics penicillin, streptomycin, and neomycin. Clone 124 of TB cells chronically releasing the Moloney murine sarcoma virus (MuSV-124) was used to prepare a virus stock that contained an approximately 30-fold excess of MuSV particles over Moloney murine leukemia virus (MuLV) particles.38 MuLV and MuSV used in this research were grown on NIH/3T3 cells. The virus concentration was determined by counting the number of foci (ffu-focus-forming units). 2.2.Cell Infection and Determination of Malignant TransformationMonolayers of NIH/3T3 and MEF cells were grown in tissue culture plates and treated with of polybrene (a cationic polymer required for neutralizing the negative charge of the cell membrane) for before infection with the virus. Free polybrene was then removed, and both types of cells were incubated at for with the infecting virus (MuSV-124) at various concentrations in RPMI medium containing 2% of NBCS. The unabsorbed virus particles were removed, fresh medium containing 2% NBCS was added, and the monolayers were incubated at . After various time intervals, the cell cultures were carefully examined for the appearance of malignant transformed cells by the following methods in parallel:
2.3.Sample Preparation for Fourier Transform Infrared Microscopy MeasurementsSince ordinary glass slides exhibit strong absorption in the wavelength range of interest, zinc sellenide crystals, which are highly transparent to IR radiation, were used. Cell cultures were washed with a physiological saline solution and picked up from the tissue culture plates after treatment with trypsin (0.25%) for . The cells were pelleted by centrifugation at for . Each pellet was washed twice with saline and resuspended in of saline. The number of cells was counted with a hematocytometer, and all tested samples were pelleted again and resuspended in an appropriate volume of saline to give a concentration of . A drop of of each sample was placed on a certain area on the zinc sellenide crystal, air dried for , and measured by FTIR microscopy. The radius of such drop was about , producing a monolayer of cells with about . Figure 1 displays characteristic sites for measurements as observed by a light microscope for normal [Fig. 1a] and completely transformed [Fig. 1b] murine fibroblast cell line (NIH/3T3). 2.4.Fourier Transform Infrared Microspectroscopy and Data AcquisitionMeasurements on cell cultures were performed using the FTIR microscope IR scope 2 with a liquid-nitrogen-cooled mercury-cadmium-telluride (MCT) detector, coupled to the FTIR spectrometer (Bruker Equinox model 55/S, OPUS software). To achieve high signal-to-noise ratio (SNR), 128 co-added scans were collected in each measurement in the wavenumber region . The measurement site was circular with a diameter of and spectral resolution of was used. To reduce cell amount variation and guarantee proper comparison between different samples, the following procedures were adopted.
3.Results3.1.Spectral Differences between Normal and Malignant Cell LinesThe main objective of this research is to identify and study early changes during malignant transformation using FTIR-MSP. As a first step, it was important to find spectral biomarkers that can discriminate between normal and completely malignant cells. We analyzed FTIR spectra of 50 different samples of both normal (NIH/3T3) and completely transformed murine fibroblast cell lines (NIH/3T3/MuSV). Two regions with significant and consistent differences were identified at and . For an effective comparison, these regions were cut from the entire spectra, baseline corrected and normalized. The results in the region , presented in Fig. 2a , show four prominent absorbance bands: near (due to the symmetric stretching of the methylene chains in membrane lipids); at (due to the antisymmetric stretch); at (due to antisymmetric stretching of the methyl groups of both lipids and proteins); and at (arising from the symmetric stretching mode).1 The average absorption intensities of normal and transformed fibroblast cell lines are distinctive at and bands [Fig. 2a]. It was found that the best discriminating values were obtained by deriving the intensity ratio of these two vibrational modes (i.e., or ). Fig. 2FTIR spectra in the regions: (a) , (b) , and (c) the second derivative at of the normal murine fibroblast cell line (NIH/3T3) and of the completly transformed murine fibroblast cell line (NIH3T3/MuSV). Spectra are the average of 50 samples and five measurements of each sample after baseline correction and normalization. 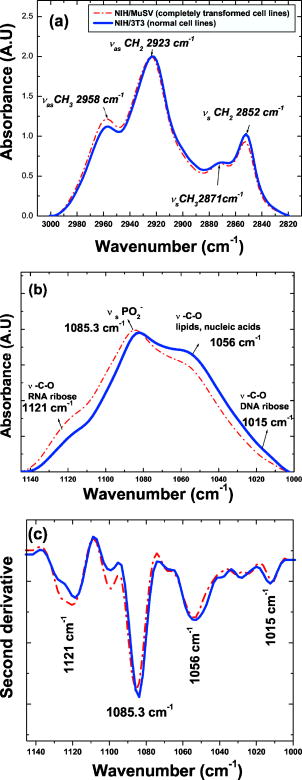 The dimensionless ratio eliminates artifact, which may arise due to the baseline contribution underneath each band. Table 1 summarizes the statistical values of the previous ratio for the normal and malignant cell line. The -value of the two groups is 11.25 (Table 1). Therefore, this ratio may be considered as a satisfactory biomarker to follow the progress of malignant transformation. Table 1Statistical analysis of the biomarkers derived from FTIR spectra of normal and transformed murine fibroblast cell lines.
In the second region at [Fig. 2b], there are plenty of overlapping vibrational modes associated with absorbance of macromolecules such as proteins, nucleic acids, carbohydrates, and phospholipids. The bands at 1082 and correspond to absorbance of the of phosphodiesters of nucleic acids1 and the O–H stretching coupled with C–O bending of C–OH groups of carbohydrates, respectively.39 Other bands at 1121 and can be clearly seen in the second derivative spectra [Fig. 2c]. Previous works have shown that arises from RNA absorbance, whereas the shoulder is due to DNA.43, 44, 45 From this region it is possible to derive two additional spectral biomarkers with outstanding statistical characteristics: ratio (assigned as RNA/DNA ratio) and the wavenumber shift due to (relative to ). Even though the variability of these biomarkers is high due to overlapping absorbance, the average values of normal are still significantly different compared to malignant cells (Table 1). 3.2.Early Stages of Malignant Cell TransformationBoth primary cells (MEF) and murine fibroblast cell lines (NIH/3T3) were infected with MuSV and examined at various postinfection times for morphological and spectral changes. Figure 3 shows the expanded spectra of both cell cultures in the two wavenumber regions. This figure clearly demonstrates the gradual spectral variations following cell infection. Dramatic changes are observable in the case of MEF transformation, where the band at decreases gradually and the band at is shifted systematically to higher wavenumbers versus infection time [Fig. 3d]. Thus, it is possible to determine the first spectral signs of malignancy according to the alterations in the calculated values of the previously discussed biomarkers. The observed spectral changes in malignant cells compared to control cells are summarized in Table 2 . As can be seen in Table 2, the first morphological changes confirmed by microscopical observations and growth on soft agar appear considerably later than the first spectral signs. For example, the first spectral identification is possible on the first day ( biomarker), while morphologically it can be discerned on the third day in the case of NIH/3T3 cell transformations (Table 2). In the case of MEF primary cells, the spectral changes induced by cell transformation were even more significant compared to those induced in the NIH/3T3 transformation [Fig. 3b]. Also in MEF primary cells, the first spectral signs appeared significantly earlier than the morphological changes (on the third day compared to the seventh day). Fig. 3FTIR spectra of (a) NIH/3T3 and (b) MEF cells at various intervals of postinfection time in the region . FTIR spectra of (c) NIH/3T3 and (d) MEF cells in various intervals of postinfection time in the region . Spectra are the average of (a) and (c) 20 transformations of NIH/3T3 cell lines and (b) and (d) 12 transformations of MEF cells. 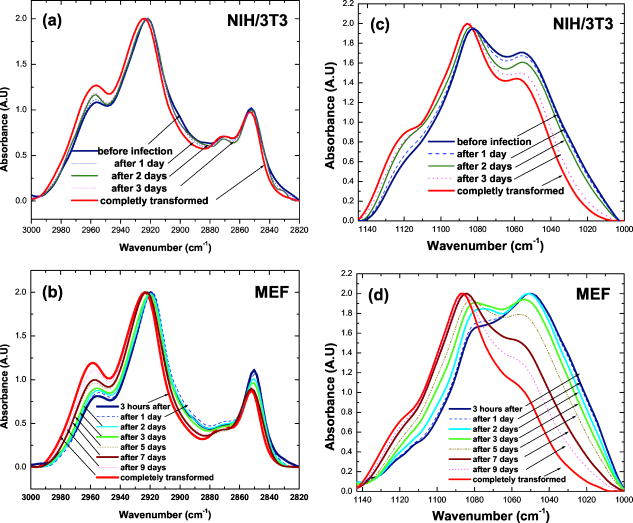 4.Statistical Analysis4.1.Cluster AnalysisCluster analysis was used to classify the infected cells at each postinfection day into cancerous or normal groups. For this classification we utilized a vector array of spectral biomarkers, which were set as follows: The postinfection days of transformations were characterized using the average values of previously derived spectral biomarkers.The results presented in Fig. 4 show that cluster analysis can indeed classify the infected cells into the cancerous group already at the first postinfection day in case of NIH/3T3 cells and at the fifth postinfection day in case of MEF transformation. We note that in both cases, the classifications were significantly earlier than the morphological identification of the malignant cells. 4.2.Discriminant Classification FunctionDiscriminant classification function (DCF) is a statistical tool that enables us to improve discrimination between malignant stages by representing an adequate quantitative follow up of transformations versus time. DCF generates a classification score for each postinfection day, which is a linear combination of previously derived array of biomarkers with weight coefficients,37, 38 as can be seen in the following equation: where is the weight coefficient, is biomarker value, and denotes the resultant classification score.The weight coefficients were determined empirically in such a way that they nullify the average classification score of NIH/3T3 array (normal cell score) and yield 100 score (cancerous score) for the average NIH/MuSV array. The same weights were applied also to the MEF transformation. From the DCF analysis, we obtained a classification of the transformations that correspond to a sigmoid fit (Fig. 5 ). The abnormality can be distinguished as early as the first day in the case of the NIH/3T3 transformation [while first morphological identification is possible on the third day, Fig. 5a]. Similarly, Fig. 5b shows that the abnormality in the case of MEF transformation is apparent on the third postinfection day (while the first morphological identification is possible on the seventh day). In both cases, the infected cells reach an upper level plateau after full transformation (score of 100 for NIH/3T3 and score of 137 for cancerous MEF, Fig. 5). Fig. 5Discriminant classification function of (a) NIH/3T3 and (b) MEF cells at various intervals of postinfection. Each postinfection day of transformation is represented using an array of average values of three biomarkers: ( , , and the shift of ).  Table 2First signs of malignant transformation.
5.DiscussionIn the present work, we implemented FTIR-MSP to study the spectral changes of cancerous transformation in vitro and focused mainly on early detection of malignancy. For this purpose we utilized an array of spectral biomarkers ( , , and the wavenumber shift due to ). The obtained results revealed that three FTIR spectral indicators consistently altered during the malignant transformation and can discern malignancy before morphological changes can be observed. Such spectral alterations were considerably higher and significant in the transformations of primary MEF cells compared to NIH/3T3 cell line transformations. Most of the biological characteristics of primary cells are completely different from those of cell lines; they replicate slowly in culture and are very sensitive to the environmental conditions compared to the cell lines. In fact, primary cells are very similar to the normal organism cells in most of their characteristics, while cell lines have some similarity to malignant cells. The gradual changes in these biomarkers during the transformation processes can arise from several cellular activities. 5.1.( )The phospholipids/lipids/triglycerides and proteins absorb in the wavenumber regions from .1, 43 Previous studies46, 47 with rat fibroblast cell lines showed that lipids have more predominant absorbance relative to other biomolecules, including proteins, at the 2800- to 3000- region. Also, changes in the absorbance due to and vibrational modes of lipids during carcinogenesis were found.48, 49 Our results showed remarkable increment in this ratio in malignant cells compared to normal cell cultures. Similar behavior of this biomarker was observed in leukemia,50 cervical, colon, and colorectal cancer,51 as well as in murine fibroblast cell lines and rabbit bone marrow primary cells transformed by MuSV or H-Ras.50 In addition, the ratio was found to increase as a function of the progress in malignant lymphoma grade.52 Lipids are considered as important components of the cellular membrane, which significantly affect its permeability and metabolites transportation during carcinogenesis,53 and they also form an influential source of energy that might be essential for malignant metabolism. Moreover, the evidence that transformed cells differ in their average cellular volume compared to the normal cells54 (Fig. 1) may also contribute to the observed changes seen in the previous ratio. 5.2.(RNA/DNA) and Wavenumber Shift due toThe region between has many overlapping bands that correspond to the nucleic acid absorbance.43, 44, 45 Differences in DNA isolated from cancer and normal cells/tissues using FTIR spectroscopy have been the basis of a number of studies for diagnosis of cancer.55, 56 A statistical comparison of the FTIR spectra of DNA obtained from prostate cancer and from normal prostate tissues of healthy younger men revealed a broad array of differences in base structures (e.g., N–H and C–O) as well as in vertical base-stacking interactions and in the phosphodiester-deoxyribose backbone.55 Also, structural disorders in the pancreatic tumor DNA were detected in the phosphodiester-deoxyribose spectral region.56 Our results showed significant increment in the ratio and peak shift to higher wavenumbers in malignant cells compared to normal cell cultures. The utilization of these spectral indicators was widely reported in previous studies. 7, 8, 9, 10, 12, 13, 19, 20, 34, 35, 36, 37, 57 The same tendency was observed for ratio in melanoma,58 leukemia,12, 13 cervical,19, 20 and colon,7, 8, 9, 10, 57 cancers as well as murine fibroblast cell lines transformed by MuSV or H-Ras34, 35, 36 and lymphoma.51, 59 In the case of , it was found that the phosphodiester group shifted to higher wavenumbers in various malignant cell cultures such as human primary fibroblast, mouse primary fibroblast, murine fibroblast cell line (NIH/3T3), etc.37 This shift has been also seen in breast cancer,60 cancerous stomach tissues,61 and neoplastic human gastric cells.62 It was suggested that the pivotal role of these biomarkers stems from nucleic acid absorbance. The change in the absorbance and conformation of nucleic acids (which can cause a shift in the absorbance of the phosphodiesters group) during carcinogenesis arises from a sharp increment of the proliferation and metabolic activity in the transformed cells and from the high levels of retrovirus DNA and RNA production in the infected or transformed cells. Also, these changes could arise from a variation in the nuclear volume of the transformed cells as previously reported.63, 64 Cell transformation progression in time can be well described by a sigmoid function that was obtained using a discriminant classification function. In a short interval of postinfection time (meaningfully shorter than the cell cycle), there are no detectable spectral differences between infected and control cell cultures. Then the spectral values of the infected cell cultures gradually approach the spectral values of the fully transformed cells (as can be seen in Fig. 5). After obtaining first signs of morphological transformation (as confirmed by microscope and growth on soft agar), all spectral indicators showed identical values to those of the fully transformed cells. The results presented in this study prove the superiority of FTIR spectroscopy over the conventional technique used for detection of malignant cells in culture. Thus, FTIR-MSP in tandem with proper statistical tools may offer a promising technique for the detection of early stages of malignancy and for monitoring their progression. AcknowledgmentsThis research work was supported by the Israel Science Foundation (ISF grant number 788/01) and the Israel Cancer Association (ICA). ReferencesH. Mantsch and
D. Chapman, Infrared Spectroscopy of Biomolecules, John Wiley, New York
(1996). Google Scholar
M. Diem,
S. Boyston-White, and
L. Chiriboga,
“Infrared spectroscopy of cells and tissues: Shining light on to a novel subject,”
Appl. Spectrosc., 53 148A
–161A
(1999). https://doi.org/10.1366/0003702991946712 0003-7028 Google Scholar
D. Naumann,
D. Helm, and
H. Labischinski,
“Microbiological characterizations by FT-IR spectroscopy,”
Nature (London), 351 81
–82.
(1991). https://doi.org/10.1038/351081a0 0028-0836 Google Scholar
H. Gremlich and
B. Yang, Infrared and Raman Spectroscopy of Biological Materials, Marcel Dekker, New York
(2001). Google Scholar
P. Lasch,
M. Boese,
A. Pacifico, and
M. Diem,
“FT-IR spectroscopic investigations of single cells on the subcellular level,”
Vib. Spectrosc., 28
(1), 147
–157
(2002). 0924-2031 Google Scholar
S. Argov,
R. K. Sahu,
E. Bernshtain,
A. Salman,
G. Shohat1,
U. Zelig, and
S. Mordechai,
“Inflammatory bowel diseases as an intermediate stage between normal and cancer: a FTIR-microspectroscopy approach,”
Biopolymers, 75
(5), 384
–392
(2004). 0006-3525 Google Scholar
R. K. Sahu and
S. Mordechai,
“Fourier transform infrared spectroscopy in cancer detection,”
Future Oncol., 1
(5), 635
–647
(2005). Google Scholar
S. Argov,
J. Ramesh,
A. Salman,
I. Silenikov,
J. Goldstein,
H. Guterman, and
S. Mordechai,
“Diagnostic potential of fourier transformed infrared microspectroscopy and advanced computational methods in colon cancer patients,”
J. Biomed. Opt., 7
(2), 248
–254
(2002). https://doi.org/10.1117/1.1463051 1083-3668 Google Scholar
A. Salman,
S. Argov,
J. Ramesh,
J. Goldstein,
I. Silenikov,
H. Guterman, and
S. Mordechai,
“FTIR microscopic characterization of normal and malignant human colonic tissues,”
Cell Mol. Biol. (Paris), 47
(22), 159
–166
(2001). 0145-5680 Google Scholar
R. K. Sahu,
S. Argov,
E. Bernshtain,
A. Salman,
S. Walfisch,
J. Goldstein, and
S. Mordechai,
“Detection of abnormal proliferation in histologically ‘normal’ colonic biopsies using FTIR-microspectroscopy,”
Scand. J. Gastroenterol., 39
(6), 557
–566
(2004). 0036-5521 Google Scholar
T. Gao,
J. Feng, and
Y. Ci,
“Human breast carcinomal tissues display distinctive FTIR spectra: implication for the histological characterization of carcinomas,”
Anal. Cell. Pathol., 18 87
–93
(1999). 0921-8912 Google Scholar
R. K. Sahu,
U. Zelig,
M. Huleihel,
N. Brosh,
M. Talyshinsky,
M. Harosh,
S. Mordechai, and
J. Kapelushnik,
“Continuous monitoring of WBC (biochemistry) in an adult leukemia patient using advanced FTIR-spectroscopy,”
Leuk. Res., 30
(6), 687
–693
(2006). https://doi.org/10.1016/j.leukres.2005.10.011 0145-2126 Google Scholar
J. Ramesh,
J. Kapelushnik,
J. Mordechai,
A. Moser,
M. Huleihel,
V. Erukhimovitch,
C. Levi, and
S. Mordechai,
“Novel methodology for the follow-up of acute lymphoblastic leukemia using FTIR Microspectroscopy,”
J. Biochem. Biophys. Methods, 51
(3), 251
–261
(2002). 0165-022X Google Scholar
L. Chiriboga,
P. Xie,
H. Yee,
D. Zarou,
D. Zakim, and
M. Diem,
“Infrared spectroscopy of human tissue. IV. Detection of human cervical tissue via infrared microscopy,”
Cell Mol. Biol. (Paris), 44
(1), 219
–229
(1998). 0145-5680 Google Scholar
P. Podshyvalov,
R. K. Sahu,
S. Mark,
K. Kantarovich,
H. Guterman,
J. Goldstein,
J. Ramesh,
S. Argov, and
S. Mordechai,
“Distinction of cervical cancer biopsies by use of infrared microspectroscopy and probabilistic neural networks,”
Appl. Opt., 44
(18), 3725
–3734
(2005). https://doi.org/10.1364/AO.44.003725 0003-6935 Google Scholar
W. Steller,
J. Einenkel,
L. C. Horn,
U. D. Braumann,
H. Binder,
R. Salzer, and
C. Kraft,
“Delimitation of squamous cell cervical carcinoma using infrared microspectroscopic imaging,”
Anal. Bioanal. Chem., 384
(1), 145
–154
(2006). 1618-2642 Google Scholar
B. R. Wood,
L. Chiriboga,
D. McNaughton, and
M. Diem,
“Fourier transform infrared (FTIR) spectral mapping of the cervical transformation zone, and dysplastic squamous epithelium,”
Gynecol. Oncol., 93
(1), 59
–68
(2004). 0090-8258 Google Scholar
J. I. Chang,
Y. B. Huang,
P. C. Wu,
C. C. Chen,
S. C. Huang, and
Y. H. Tsai,
“Characterization of human cervical precancerous tissue through the fourier transform infrared microscopy with mapping method,”
Gynecol. Oncol., 91
(3), 577
–583
(2003). 0090-8258 Google Scholar
S. Mordechai,
R. K. Sahu,
Z. Hammody,
S. Mark,
K. Kantarovich,
H. Guterman,
P. Podshyvalov,
J. Goldstein, and
S. Argov,
“Possible common biomarkers from FTIR microspectroscopy of cervical cancer and melanoma,”
J. Microsc., 215 86
–91
(2004). 0022-2720 Google Scholar
S. Mark,
R. K. Sahu,
K. Kantarovich,
P. Podshyvalov,
H. Guterman,
J. Goldstein,
S. Argov, and
S. Mordechai,
“Fourier transform infrared microspectroscopy as a quantitative diagnostic tool for assignment of premalignancy grading in cervical neoplasia,”
J. Biomed. Opt., 9
(3), 558
–567
(2004). https://doi.org/10.1117/1.1699041 1083-3668 Google Scholar
P. Lasch,
W. Haensch,
D. Naumann, and
Max Diem,
“Imaging of colorectal adenocarcinoma using FT-IR microspectroscopy and cluster analysis,”
Biochim. Biophys. Acta, 1668
(2), 176
–186
(2004). 0006-3002 Google Scholar
A. Tfayli,
O. Piot,
A. Durlach,
A. Bernard, and
M. Manfait,
“Discriminating nevus and melanoma on paraffin-embedded skin biopsies using FTIR microspectroscopy,”
Biochim. Biophys. Acta, 1724
(3), 262
–269
(2005). 0006-3002 Google Scholar
N. Eikje,
K. Aizawa, and
Y. Ozaki,
“Vibrational spectroscopy for molecular characterization and diagnosis of benign, premalignant and malignant skin tumours,”
Biotechnol. Annu. Rev., 11 191
–225
(2005). Google Scholar
C. Krafft,
L. Shapoval,
S. B. Sobottka,
K. D. Geiger,
G. Schackert, and
R. Salzer,
“Identification of primary tumors of brain metastases by SIMCA classification of IR spectroscopic images,”
Biochim. Biophys. Acta, 1758
(7), 883
–891
(2006). 0006-3002 Google Scholar
E. Gazi,
M. Baker,
J. Dwyer,
N. P. Lockyer,
P. Gardner,
J. H. Shanks,
R. S. Reeve,
C. A. Hart,
N. W. Clarke, and
M. D. Brown,
“A correlation of FTIR spectra derived from prostate cancer biopsies with gleason grade and tumour stage,”
Eur. Urol., 50
(4), 750
–760
(2006). 0302-2838 Google Scholar
D. Fernandez,
R. Bhargava,
S. M. Hewitt, and
I. W. Levin,
“Infrared spectroscopic imaging for histopathologic recognition,”
Nat. Biotechnol., 23
(4), 469
–474
(2005). 1087-0156 Google Scholar
P. Bruni,
C. Conti,
E. Giorgini,
M. Pisani,
C. Rubini, and
G. Tosi,
“Histological and microscopy FT-IR imaging study on the proliferative activity and angiogenesis in head and neck tumours,”
Faraday Discuss., 126 19
–26
(2004). 0301-7249 Google Scholar
M. German,
A. Hammiche,
N. Ragavan,
M. J. Tobin,
J. L. Cooper,
S. S. Matanhelia,
A. C. Hindley,
C. M. Nicholson,
N. J. Fullwood,
H. M. Pollock, and
F. L. Martin,
“Infrared spectroscopy with multivariate analysis potentially facilitates the segregation of different types of prostate cell,”
Biophys. J., 90
(10), 3783
–3795
(2006). 0006-3495 Google Scholar
Y. Yang,
J. Sule-Suso,
G. D. Sockalingum,
G. Kegelaer,
M. Manfait, and
A. El Haj,
“Study of tumor cell invasion by Fourier transform infrared Microspectroscopy,”
Biopolymers, 78
(6), 311
–317
(2005). 0006-3525 Google Scholar
L. Zhang,
G. W. Small,
A. S. Haka,
L. H. Kidder, and
E. N. Lewis,
“Classification of Fourier transform infrared microscopic imaging data of human breast cells by cluster analysis and artificial neural networks,”
Appl. Spectrosc., 57
(1), 14
–22
(2003). https://doi.org/10.1366/000370203321165151 0003-7028 Google Scholar
J. Sule-Suso,
A. Forster,
V. Zholobenko,
N. Stone, and
A. El Haj,
“Effects of CaCl2 and MgCl2 on Fourier transform infrared spectra of lung cancer cells,”
Appl. Spectrosc., 58
(1), 61
–67
(2004). https://doi.org/10.1366/000370204322729487 0003-7028 Google Scholar
C. M. Krishna,
G. Kegelaer,
I. Adt,
S. Rubin,
V. B. Kartha,
M. Manfait, and
G. D. Sockalingum,
“Combined Fourier transform infrared and Raman spectroscopic approach for identification of multidrug resistance phenotype in cancer cell lines,”
Biopolymers, 82
(5), 462
–470
(2006). 0006-3525 Google Scholar
C. M. Krishna,
G. D. Sockalingum,
R. A. Bhat,
L. Venteo,
P. Kushtagi,
M. Pluot, and
M. Manfait,
“FTIR and Raman microspectroscopy of normal, benign, and malignant formalin-fixed ovarian tissues,”
Anal. Bioanal. Chem., 387
(5), 1649
–1656
(2007). 1618-2642 Google Scholar
M. Huleihel,
A. Salman,
V. Erukhimovitch,
J. Ramesh,
Z. Hammody, and
S. Mordechai,
“Novel spectral method for the study of viral carcinogenesis in vitro,”
J. Biochem. Biophys. Methods, 50
(2–3), 111
–121
(2002). https://doi.org/10.1016/S0165-022X(01)00177-4 0165-022X Google Scholar
J. Ramesh,
A. Salman,
Z. Hammody,
B. Cohen,
J. Gopas,
N. Grossman, and
S. Mordechai,
“Application of FTIR microscopy for the characterization of malignancy: H-ras transfected murine fibroblasts as an example,”
J. Biochem. Biophys. Methods, 50
(1), 33
–42
(2001). 0165-022X Google Scholar
A. Salman,
J. Ramesh,
V. Erukhimovitch,
M. Talyshinsky,
S. Mordechai, and
M. Huleihel,
“FTIR microspectroscopy of malignant fibroblasts transformed by mouse sarcoma virus,”
J. Biochem. Biophys. Methods, 55
(2), 141
–153
(2003). 0165-022X Google Scholar
V. Erukhimovitch,
M. Talyshinsky,
Y. Souprun, and
M. Huleihel,
“Spectroscopic characterization of human and mouse primary cells, cell lines and malignant cells,”
Photochem. Photobiol., 76 446
–451
(2002). https://doi.org/10.1562/0031-8655(2002)076<0446:SCOHAM>2.0.CO;2 0031-8655 Google Scholar
J. Ball,
J. McCarter, and
S. Sunderland,
“Evidence for helper independent murine sarcoma virus. I. Segregation of replication defective and transformation defective viruses,”
Virology, 56 268
–284
(1973). 0042-6822 Google Scholar
S. Wartewig, IR and Raman Spectroscopy, 75
–122 John Wiley and Sons, New York
(2003). Google Scholar
B. Everitt, Cluster Analysis, John Wiley and Sons, New York
(1980). Google Scholar
C. Huberty, Applied Discriminant Analysis, John Wiley and Sons, New York
(1994). Google Scholar
R. A. Fisher,
“The use of multiple measures in taxonomic problems,”
Ann. Eugenics, 7 179
–188
(1936). Google Scholar
F. S. Parker, Application of Infrared Spectroscopy in Biochemistry, Biology and Medicine, Plenum, New York
(1971). Google Scholar
D. Naumann,
“FT-infrared and FT-Raman spectroscopy in bio-medical research,”
Appl. Spectrosc. Rev., 36 239
–298
(2001). 0570-4928 Google Scholar
E. Benedetti,
E. Bramanti,
F. Papineschi,
I. Rossi, and
E. Benedetti,
“Determination of the relative amount of nucleic acids and proteins in leukemic and normal lymphocytes by means of Fourier transform infrared microspectroscopy,”
Appl. Spectrosc., 51 792
–797
(1997). https://doi.org/10.1366/0003702971941304 0003-7028 Google Scholar
J. Mourant,
K. W. Short,
S. Carpenter,
N. Kunapareddy,
L. Coburn,
T. M. Powers, and
J. P. Freyer,
“Biochemical differences in tumorigenic and nontumorigenic cells measured by Raman and infrared spectroscopy,”
J. Biomed. Opt., 10
(3), 031106
(2005). https://doi.org/10.1117/1.1928050 1083-3668 Google Scholar
K. W. Short,
S. Carpenter,
J. P. Freyer, and
J. Mourant,
“Raman spectroscopy detects biochemical changes due to proliferation in mammalian cell cultures,”
Biophys. J., 88 4274
–4288
(2005). https://doi.org/10.1529/biophysj.103.038604 0006-3495 Google Scholar
L. M. McIntosh,
M. Jackson,
H. H. Mantsch,
M. F. Stranc,
D. Pilavdzic, and
A. N. Crowson,
“Infrared spectra of basal cell carcinomas are distinct from non-tumor-bearing skin components,”
J. Invest. Dermatol., 112 951
–956
(1999). https://doi.org/10.1046/j.1523-1747.1999.00612.x 0022-202X Google Scholar
T. Gao and
Y. Ci,
“Fourier transform infrared spectroscopic features of human breast benign and malignant tissues,”
Internet J. Vibrational Spectrosc., 3
(5),
(1999). Google Scholar
R. K. Sahu,
S. Argov,
A. Salman,
U. Zelig,
M. Huleihel,
N. Grossman,
J. Gopas,
J. Kapelushnik, and
S. Mordechai,
“Can vibrational spectroscopy at higher wavenumbers (midIR) shed light on universal biomarkers for carcinogenesis in tissues?,”
J. Biomed. Opt., 10
(5), 054017
(2005). https://doi.org/10.1117/1.2080368 1083-3668 Google Scholar
B. Rigas,
S. Morgello,
I. S. Goldman, and
P. T. Wong,
“Human colorectal cancers display abnormal Fourier-transform infrared spectra,”
Proc. Natl. Acad. Sci. U.S.A., 87 8140
–8144
(1990). 0027-8424 Google Scholar
P. G. Andrus,
“Cancer monitoring by FTIR spectroscopy,”
Technol. Cancer Res. Treat., 5
(2), 157
–167
(2006). 1533-0346 Google Scholar
C. Dombi,
J. Banoczy,
M. Kramer,
W. P. Wertz, and
A. C. Squier,
“Study of the permeability of oral leukoplakia,”
Fogorv. Sz., 92
(5), 137
–142
(1999). 0015-5314 Google Scholar
F. Lang,
M. Ritter,
E. Woll,
H. Weiss,
D. Haussinger,
J. Hoflacher,
K. Maly, and
H. Grunicke,
“Altered cell volume regulation in ras oncogene expressing NIH fibroblasts,”
Pfluegers Arch., 420
(5–6), 424
–427
(1992). 0031-6768 Google Scholar
D. C. Malins,
P. M. Johnson,
E. A. Barker,
N. L. Polissar,
T. M. Wheeler, and
K. M. Anderson,
“Cancer-related changes in prostate DNA as men age and early identification of metastasis in primary prostate tumors,”
Proc. Natl. Acad. Sci. U.S.A., 100
(9), 5401
–5406
(2003). https://doi.org/10.1073/pnas.0931396100 0027-8424 Google Scholar
V. R. Kondepati,
M. Keese,
H. M. Heise, and
J. Backhaus,
“Detection of structural disorders in pancreatic tumour DNA with Fourier-transform infrared spectroscopy,”
Vib. Spectrosc., 40 33
–39
(2006). 0924-2031 Google Scholar
R. K. Sahu,
S. Argov,
A. Salman,
M. Huleihel,
N. Grossman,
Z. Hammody,
J. Kapelushnik, and
S. Mordechai,
“Characteristic absorbance of nucleic acids in the mid-IR region as possible common biomarkers for diagnosis of malignancy,”
Technol. Cancer Res. Treat., 3
(6), 629
–638
(2004). 1533-0346 Google Scholar
Z. Hammody,
R. K. Sahu,
S. Mordechai,
E. Cagnano, and
S. Argov,
“Characterization of malignant melanoma using vibrational spectroscopy,”
Scientific World J., 5 173
–182
(2005). Google Scholar
P. G. Andrus and
R. D. Strickland,
“Cancer grading by Fourier transform infrared spectroscopy,”
Biospectroscopy, 4
(1), 37
–46
(1998). https://doi.org/10.1002/(SICI)1520-6343(1998)4:1<37::AID-BSPY4>3.0.CO;2-P 1075-4261 Google Scholar
C. Liu,
Y. Zhang,
X. Yan,
X. Zhang,
C. Li,
W. Yang, and
D. Shi,
“Infrared absorption of human breast tissues in vitro,”
J. Lumin., 119–120 132
–136
(2006). 0022-2313 Google Scholar
Y. Tong and
Y. Lin,
“FTIR study on the normal and cancerous stomach tissues,”
Guangpuxue Yu Guangpu Fenxi, 21
(3), 324
–327
(2001). 1000-0593 Google Scholar
N. Fujioka,
Y. Morimoto,
T. Arai,
K. Takeuchi,
M. Yoshioka, and
M. Kikuchi,
“Differences between infrared spectra of normal and neoplastic human gastric cells,”
Spectroscopy (Amsterdam), 18 59
–66
(2004). 0712-4813 Google Scholar
D. Mihailovic,
B. Dordevic, and
V. Mihailovic,
“Nuclear volume in type I gastric intestinal metaplasia,”
Anal Quant Cytol. Histol., 21
(2), 143
–144
(1999). 0884-6812 Google Scholar
R. Drezek,
M. Guillaud,
T. Collier,
I. Boiko,
A. Malpica,
C. Macaulay,
M. Follen, and
R. Richards-Kortum,
“Light scattering from cervical cells throughout neoplastic progression: influence of nuclear morphology, DNA content, and chromatin texture,”
J. Biomed. Opt., 8
(1), 7
–16
(2003). https://doi.org/10.1117/1.1528950 1083-3668 Google Scholar
|
|||||||||||||||||||||||||||||||||||||||||||||||||||||||||||||||||||||||||


