
|
|
1.IntroductionIR spectroscopy is a powerful method for the in vitro analysis of various biomedical samples in the laboratory and noninvasive diagnostics.1 The spectroscopic analysis of biofluids such as whole blood, plasma, or serum takes advantage of the fact that a multitude of analytes can be simultaneously quantified without requiring reagents. The main focus is on glucose as the most interesting analyte, since the monosaccharide plays an important role in the body metabolism for energy supply. Recent trends show that dry-film measurements by mid-IR spectroscopy using nanoliter fluid volumes could revolutionize the analytical assays in the clinical chemistry laboratory.2 For clinical research, in vivo blood glucose monitoring is an ongoing important topic to improve glycemic control in patients with inadequate blood glucose regulation. In particular for diabetic patients with the requirement of frequent blood glucose measurements, continuous monitoring is desirable to improve therapy. Recently, critically ill and hospitalized patients also received much interest, since it was shown that intensive insulin therapy to normalize the blood glucose concentration can significantly improve clinical outcome measures such as mortality and morbidity and, in addition, will substantially reduce health care costs. 3, 4, 5, 6 Therefore, continuous glucose monitoring for critically ill patients is another application, for which, despite the existence of commercially available, mainly amperometric biosensors, improved portable sensor systems and bedside devices are under development. Minimally invasive techniques with discrete sampling using point-of-care devices, continuous sampling via a venous port or a subcutaneously implanted microdialysis probe with ex vivo detection or noninvasive transcutaneous sensors are different options available for glucose measurements (see Fig. 1 ). Among these different alternatives, discrete sampling with subsequent sample preparation has been most frequently applied for glucose determination, although continuous monitoring techniques received much attention in recent years. For mid-IR spectroscopic analysis of body fluids, the attenuated total reflection technique or transmission measurements have been used. Transmission measurements were carried out when near-IR or even short-wave near-IR spectroscopy were exploited for glucose assays. The first applications of mid-IR spectroscopy for substrate analysis in whole blood and blood plasma were reported by us about 15 years ago,7, 8 and advances in the measurement technologies were recently reviewed.9 Since then, further investigations were carried out for glucose determination in whole blood, serum, and dialysates by means of transmission or attenuated total reflection (ATR) techniques. 10, 11, 12, 13, 14, 15 The simultaneous determination of additional components in dialysates has also been reported.15 With the intention of miniaturizing the measurement device to the point where personal use of a wearable instrument can be considered, Martin applied mid-IR quantum cascade lasers for monitoring glucose in serum.16 They used absorption spectroscopy at with correction for water absorption in combination with measurements at for background compensation. Average predictive standard errors of the mean (SEMs) were 32.5 and ( and ), respectively, for each method, insufficient for monitoring. The feasibility of the simultaneous quantification of two different compounds measured at two different wavelengths using dual quantum cascade laser (QCL) absorption spectroscopy was also reported very recently.17 A lately published comparison of QCL and mid-IR lead salt lasers for glucose measurements is also noteworthy.18 However, miniaturized spectroscopic devices have yet not been advanced to a portable size that can be worn close to the patient body, despite the promises made for QCL technology or near-IR tunable lasers.19 A promising option for continuous monitoring using IR spectrometry can exploit the opportunities existing with the available microfluidic technology. A fluidic system can be used to load the sample, e.g., from a body interface, into a flow-through cell, which can be arranged within the conventional spectrometer’s sample compartment. With implementation of such technology, a semiautomatic setup with transmission IR spectroscopy for serum and other biofluids was recently described by Fabian 20 Furthermore, the application of microdialysis technology for continuous reagent free blood glucose monitoring was reported by us.21 The usage of dialysates is advantageous, since the biofluid composition is simplified compared to the original interstitial body fluid, because microdialysis excludes molecules above a certain size threshold, such as proteins, depending on the membrane characteristics. However, low perfusion rates around a few microliters per minute are required to ensure high recovery rates for small molecules from the interstitial compartment to be monitored. In this paper, we describe the quantitative determination of glucose in microliter volumes of dialysates obtained from in vivo experiments with healthy test persons using transmission spectroscopy. Furthermore, the implementation of a microfluidic system for automated sample transfer to the measurement microcell housed within the spectrometer sample compartment is presented, by which repeat spectral background measurements for reliable continuous long-term application are made possible. The bedside monitoring system also has the potential for determining analytes of interest for the clinician besides glucose. An innovative aspect is the possibility to access the microdialysis recovery rate simultaneously, if perfusates of appropriate composition are applied. 2.Materials and MethodsThe monitoring of the patient’s subcutaneous interstitial body fluid is realized by an ex vivo arrangement. The schematics of the experimental setup are shown in Fig. 2 . The body interface between subject and glucose-sensing device is an implantable microdialysis catheter. We developed a fluidic system to transport the biofluid sample from the catheter outlet to the cuvette of the spectrometric sensor. It consists of a six-port valve with a sample loop and a syringe pump for pumping an aqueous solution for transporting the sample to a microcell, as well as cleansing the cell for the purpose of background measurements. Once the microdialysis probe is implanted into the subcutaneous tissue of the human subject, the perfusate is transported to the subcutis at a constant flow rate, realized by push-pull operation of a peristaltic pump. Due to the osmotic exchange of biocompounds between the interstitial fluid and the perfusate, low molecular mass components of the interstitial compartment are harvested. By means of our programmable fluidic approach, as explained in detail in the following, the dialysate can be intermittently sampled and analyzed. Fig. 2Schematics of the computer-controlled bedside instrumentation for continuous glucose monitoring including a Fourier transform IR minispectrometer, a microdialysis probe, and programmable microfluidics. 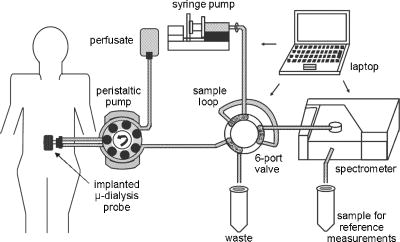 2.1.Microfluidic Interface to Human SubjectsA CMA60 microdialysis probe from CMA Microdialysis AB (Solna, Sweden) was used as microfluidic body interface. Different commercially available perfusates, either Ringer’s solution (electrolyte composition in mmol/L: Na, 147.2; K, 4.0; Ca, 2.25; Cl, 155.7) or ELO-MEL isoton (Fresenius Kabi, Graz, Austria) were used at a flow rate of . The latter perfusate contains acetate at a concentration of (further electrolytes in mmol/L: Na, 140; K, 5; Ca, 2.5, Mg, 1.5; and Cl, 108). The acetate was used for the simultaneous determination of the dialysis recovery rate, utilizing the fact that physiological concentrations of acetate found in human body fluids are much lower. The loss of this marker substance by diffusion into the interstitial tissue space can be used to quantify the transport processes across the microdialysis membrane. Experiments were carried out at the Center for Medical Research, Medical University Graz, Austria, on four healthy individuals, with each experiment lasting either for the first three subjects or for the fourth one. The first three volunteers started under fasting conditions and later received an oral glucose load containing glucose in water. The fourth test person also started under fasting condition, but later received his normal diet. Prior to the glucose monitoring, the microdialysis probe was inserted subcutaneously into the abdomen of each subject after each received local anesthesia. All measurement procedures were approved by the local Ethics Committee of the Medical University Graz. 2.2.Programmable FluidicsFor stable long-term operation, a programmable microfluidic system was coupled to the microdialysis probe used as body interface and the spectrometer for quasicontinuous glucose monitoring (see Fig. 2). The fluidics include two pumps, i.e., one for the constant perfusate flow through the dialysis probe (peristaltic pump Minipuls 3 from Gilson International, Bad Camberg, Germany) operated in push-pull mode and a second for the transport of the sample to the spectrometer (syringe pump model 540100 from TSE Systems, Bad Homburg, Germany). For miniaturization and operation close to the test person, a custom-made peristaltic minipump (Joanneum Research Forschungsgesellschaft GmbH, Graz, Austria) was fabricated to give a constant flow rate of or larger with negligible fluctuations. This was implemented into the setup for the 28-h continuous measurement. A computer-controlled six-port three-way injection valve from Knauer (Berlin, Germany) equipped with an exchangeable microliter-sample loop, was used for dialysate sampling. The syringe pump and the injection valve were controlled using standard RS232 interfaces, whereas the peristaltic pump ran independently. The fluidic setup was controlled by a standard Windows -based laptop using in-house software coded in the “C” language. A special protocol for automation was established for the measurements. The sample loop was filled with the sample fluid using the peristaltic pump running at a flow rate of over a time period of . After recording a background spectrum using the cell filled with Ringer’s solution, the sample was injected. The syringe pump advanced the content of the sample loop to the transmission cell using a defined volume of Ringer’s solution via a polymer PEEK capillary of suitable length. The transport volume was around , depending on the tubing length between sample valve and spectrometer cell; the volume must be determined before system utilization (see also the following). The measurement is optimized when the middle part of the transported sample reaches the transmission cell, providing a maximum concentration reading. For such application, the flow rate was slowly increased up to within to avoid abrupt pressure changes within the fluidics. Due to the slight back pressure generated within the fluidic system, a minimal displacement of the sample volume within the cuvette after sample resting was taken into account. After sample flow stop, the IR measurements were started—a repeat measurement followed immediately, confirming the reproducibility of the cell filling at maximal concentration. The measured concentration reached values around 90% of the cell filling under a laminar flow condition. After the second sample measurement, a volume of was pumped at a flow rate of to remove any residues of the injected sample from the cell. After this, a second background spectrum was recorded, to check also for sample residues and to acknowledge proper cell flushing. Following this scheme, a quasicontinuous monitoring of in vivo changing temporal glucose concentration profiles is possible. Initially, a time interval of was chosen to follow in vivo changes in glucose concentrations, which was reduced later to . 2.3.IR Spectroscopic MeasurementsA custom-made flowthrough transmission microcell of internal volume and an optical path length of was used. The windows had a thickness of each. Cone-shaped PDMS sealings were used for the insertion of the in- and outlet PEEK capillary tubing (of outer and inner diameter, respectively). The IR spectra of the dialysates were recorded at constant temperature maintained at 30°C and using Ringer’s solution for background measurements. To reduce the occurrence of air micro-bubbles, a Peltier cooled cuvette holder was later implemented, providing a stable cell temperature at 17°C during the 28-h experiment. The spectra were measured with a spectral resolution of using an IR200 minispectrometer (Thermo Electron Corporation, Madison, Wisconsin) equipped with a room-temperature deuterated triglycine sulfate (DTGS) detector. A measurement time of for accumulating 240 interferograms was chosen. For interferogram apodization, a Happ-Genzel function was applied. For improving spectral reproducibility, an optical low-pass filter was employed to monitor experiments lasting for , limiting the accessible spectral range up to about [see also Fig. 3A and later discussion]. Fig. 3(A) Spectral intensities with the water-filled microcell (upper trace) and including an optical low-pass filter (lower trace); (B) spectral dialysate components illustrating possible cross-sensitivities.  Regular background measurements were made possible by the fluidic system before and after each sample injection, providing excellent drift-free measurements over extended operation periods. After filling the cell with the dialysate sample, two spectra were recorded consecutively. For on-line measurements, the spectra were directly forwarded to a (The Mathworks Inc., South Natick, Massachusetts, USA) script, which used a precalculated calibration model for the determination of the glucose concentration values (see later). For trouble-free continuous operation, an air bubble detection scheme was also implemented, evaluating the opaque spectral intervals of the transmission spectrum of the aqueous sample loaded cell [see also Fig. 3A]. The programmable fluidics enables air bubble removal to ensure automatic operation under a minimal sensor down time. The measured dialysate samples, which were diluted by a constant factor of 3.5 due to the sample transport to the cell and rinsing, were collected for reference measurements. The determination of reference concentrations was carried out using a hexokinase assay programmed on a Roche Cobas Mira analyzer. In parallel, venous blood samples were also collected under arterialized conditions with the arm resting in a hot box (50°C) and furnished with a venous port. Glucose concentrations of these samples were analyzed on-site using a Beckman glucose analyzer. To evaluate the spectra that were recorded by the minispectrometer, further high-quality IR spectra of the dialysate components were recorded using a Vector 22 Fourier transform IR (FTIR) spectrometer (Bruker Optics GmbH, Ettlingen, Germany) equipped with a liquid-nitrogen-cooled MCT (mercury cadmium telluride) detector. Spectral resolution was , and 426 interferogram scans (measurement time of ) were averaged. A Blackman-Harris three-term apodization and a zero-filling factor of 2 were originally applied. The spectra were used after resolution matching by means of truncated interferograms and appropriate apodisation [see Fig. 3B]. In addition, a slight shift in the wave number scale and spectral variable matching using spline interpolation was required for successful calibration transfer, when using least-squares fitting within the classical calibration approach. 2.4.Glucose Quantification MethodsIn general, the spectral region from 1600 to was investigated for quantitative analysis. The spectra were directly forwarded to an in-house programmed script for evaluation using a partial least-squares (PLS) calibration model or a classical least-squares (CLS) approach. For optimal quantification of glucose using PLS, the spectral data from 1180 to were used either without or with spectral processing (offset correction at for absorbance spectra, and logarithmization of single-beam spectra). A spectral variable selection based on the pairwise selection of extreme values of the optimum PLS regression vector was carried out for robust calibration modeling.22 Such calibration models [equivalent to a multiple linear regression (MLR) approach] often yield smaller standard error of prediction (SEP) values than full interval based models. The calibration robustness was tested by also enlarging the sample packets taken into account for cross-validation. The CLS approach was made possible by applying the spectral data from the interval of 1560 to in combination with a limited number of component reference spectra and applying a baseline correction for the dialysate spectra using a mean spectrum of the 100% lines from background measurements using the water-filled cell. It is known that the IR spectra of several components of the body fluids are pH dependent due to the dissociation equilibrium between the different protonated species. Therefore, the CLS evaluation also required the pH value of the dialysate with the accordingly chosen pH-dependent spectra for accurate glucose quantification (such spectra were available at pH value steps of 0.5 around the normal physiological level). The spectra used for CLS calibration included those of Ringer’s solution, aqueous solutions of urea, bicarbonate, lactate, phosphate, glucose, ELO-MEL, and carbonate, all measured versus distilled water by means of a transmission cell constructed in the same way as used for patient monitoring. In addition, a constant spectral offset was taken into account. 3.Results and DiscussionThe developed bedside glucose-monitoring device is a complex online system, and a systematic study of several parameters involved in the sample measurement is necessary. Besides glucose, the interstitial fluid also contains several other components such as urea, bicarbonate, phosphate, and lactate, which might also have influence on the spectrometric glucose quantification. Therefore, a spectral characterization of the interstitial fluid dialysate including the major sources of variability is important. Furthermore, with regard to the programmable fluidics and optimal dialysate measurement, it is essential to know sample flow dynamics and volumes required for cell filling and sample transport. The success of any glucose online sensor depends on its system conduct. For clinical applicability, a satisfactory performance concerning linearity, accuracy, precision, and drift during long-term operation must be ensured. Another important aspect to be addressed is the constancy in analyte recovery rate after implantation of the microdialysis probe. A determination of the recovery rate, simultaneously to the analytes of interest, will help in achieving the accurate quantification of the true interstitial component levels. We begin our interpretation by the spectral characterization of the body fluid dialysate, supporting our chemometric strategies for quantitative sample analysis. We then look more closely at the transport of the dialysate from the subject to the spectrometer, following a description of the sensor performance; the methodology for simultaneous determination of microdialysis recovery rates is discussed, and finally the successful short-term and long-term continuous application of the sensor system for the ex vivo monitoring of the interstitial glucose is presented. 3.1.Spectral CharacterizationIn Fig. 3A, the spectral intensities of a single beam background spectrum obtained with a water-filled cell is shown, which also elucidates the opaque spectral region of the fundamental vibrations of water above , as found for the cell thickness chosen. Using such a cuvette, optimal information on the fingerprint region can be provided. The spectra of the major dialysate components are presented in Fig. 3B, which provide a basis for a multicomponent analysis by CLS fitting. The spectral resolution of was previously found sufficient for quantitative analysis based on a population of spectra from dialysates of EDTA blood plasma samples.21 Mean spectra of the continuously measured dialysate samples from different probands are also shown in Fig. 4A , including the enlarged random absorbance noise level that was calculated by taking the ratio of two representative pure background spectra, as collected for all the paired spectra of each injected sample. To calculate the variance distribution in such absorbance spectra, considered to be constant due to the same repetitive cell filling with Ringer’s solution, a principal component analysis (PCA) of the spectra obtained within the 3-day-long measurement campaign with the first three subjects was calculated. The first principal component (PC), explaining 93% of the full spectral variance, is similar to a water absorbance spectrum, with its origin mainly from noise-dependent fluctuations of the interferogram maximum. The two further components, explaining 5.0 and 1.3% of the total variance, reflect minor spectral traces, assignable, e.g., to bicarbonate and formation of a film trace of PDMS on the windows. Another source for trace spectral variations was from uncompensated atmospheric water vapor absorption bands above [see also Fig. 4B]. Fig. 4(A) Mean dialysate spectra of two test persons including the absorbance noise level; for clarity, the dialysate spectra are presented with an offset; (B) PCA loading spectra obtained from a PCA of absorbance baseline spectra calculated from neighboring single-beam spectra of the water-filled cell during the measurement campaign with the first three subjects (lower traces); difference spectrum between single-beam spectra of the water-filled cell at the end and the beginning of the campaign and absorbance spectrum of a dry window after the campaign and cell disassembly (upper traces). 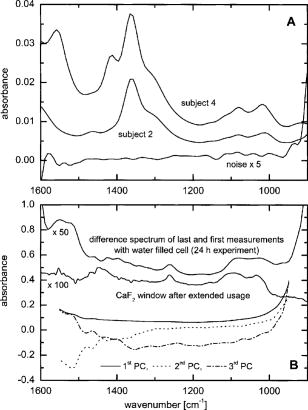 With the PCA results on the spectral variance components available, we studied the origin of the significant baseline fluctuations more carefully [see also Fig. 5A ]. Previous experiences with effects from detector nonlinearity on the interferogram maxima led us to simulate such fluctuations in the Fourier domain and their effect on the single-beam spectra.23 The results exactly matched the absorbance baseline dependency, which was experienced when recording spectra of a water filled cell and calculating so-called 100% lines, i.e. the ratio of two single-beam spectra under same experimental conditions, and taking the logarithm for the determination of the absorbance baseline. The application of the optical filter had the effect that the interferogram maximum was broader and the analog-to-digital (A/D) dynamic range required was significantly reduced for the interferogram side modulations compared with the maximum. The effect on the resulting baseline stability is illustrated in Fig. 5B. Our efforts, as already described, show that high-quality absorbance measurements can be carried out and systematic errors can be minimized while also achieving reliable long-term operation of the system. 3.2.Fluidics Optimization and TestingFor optimal spectroscopic dialysate sample measurements, the complete sample loop fill and the appropriate volume required for sample transport from the injection valve into the measurement cell must be ensured. In Fig. 6A , the effect of different sample loop fillings and the continuous transport of the sample plug through the microcuvette are shown. It was observed that a minimum sample volume of (see also figure inset) was required for an optimal cell filling; concentration estimates were calculated using a least-squares fit of a spectrum of an aqueous glucose solution of known concentration, recorded with complete cell filling. The maximum glucose concentration was obtained at after sample injection with a continuous constant flow rate of (spectra were recorded at intervals, following the concentration profile while the sample passed through the micro-cell). Figure 6B illustrate the flow dynamics, monitored again for the glucose concentration observed in the cuvette at 20-s intervals, for different transport volumes that were applied at a high flow rate of . After stopping the syringe pump, there was a minor sample plug movement through the transmission microcell, but stabilization was achieved at least after half a minute of waiting time. Implementing this strategy, a coefficient of variation of less than 1% for glucose solution measurements was achieved. Fig. 6(A) Experiments illustrating sample transport through the IR cuvette with variation of the sample loop filling volumes using an aqueous glucose sample and Ringer’s solution for transport (IR measurement time each), and (B) transport of the dialysate sample by different Ringer’s solution volumes and fluid dynamics in the IR cuvette after the pump stops (spectra were recorded for every ; sample transport pump rate of and sample loop fill by of glucose solution).  3.3.Reliability of the Sensor DeviceTo assess the sensor system performance, a protocol was established for testing sensor linearity, accuracy, precision, and characterizing drift effects over extended operation times of at least . Such aspects are also important for the characterization of enzymatic sensors that are based on amperometry, fluorometry, or other principles of operation. The protocol and the results of the in vitro sensor device performance are discussed in detail elsewhere.24 The sensor linearity was tested using aqueous solutions of different concentrations between 2.5 and , prepared gravimetrically in Ringer’s solution. The correlation coefficient was . For an in vitro experiment with serum ultrafiltrates of different glucose concentrations between 5.2 and , lasting for more than , the relative bias to the reference values varied between 2.0 and 3.8%, while the coefficient of variation was found between 2.1 and 6.0%. Sensor drift over such period of time was less than 1%. These results suggest the reliability of the device for its continuous application in the clinical environment. 3.4.Dialysis Recovery Rate EstimationUsing the multicomponent assay capability and an appropriately chosen perfusate composition, a simultaneous determination of the recovery rate is possible, by which the dialysis performance of the implanted microdialysis catheter in the in vivo environment can be assessed. With the option of reliably determining the recovery rates, an estimate of accurate interstitial concentrations is possible. A method was developed for estimating the recovery rate during microdialysis using ELO-MEL isoton as a clinically accepted perfusate. The relatively large concentration of acetate in such solutions can be used as a marker for the recovery rate (physiological acetate levels are found around in blood).25 Experiments using ELO-MEL as a perfusate for dialyzing glucose in Ringer’s solution showed a well-defined functional dependency between the recovery rate during the dialysis process and the acetate concentration losses, which were both derived from the resulting spectra. Figure 7A shows the dialysate spectra obtained under varying perfusion flow rates in combination with the original solutions. The concentrations of the glucose and acetate components were determined by a CLS fitting procedure using spectra of compound solutions of known composition. The results of the glucose recovery and the simultaneous loss of acetate under different flow rate conditions at room temperature are illustrated in Fig. 7B. The results deviate from a simple linear dependency, but this can be explained by an appropriate model taking into account the different diffusivities of the compounds in their aqueous solution. Schoonen and Wientjes recently presented an equation for the recovery rate26 where is the permeability of the membrane, is the effective membrane surface, and is the perfusate flow rate. As explicated by Zahn, the membrane permeability can be assumed to be proportional to the compound diffusion coefficient.27Fig. 7(A) Dialysate and aqueous solution spectra obtained within in vitro recovery rate experiments using CMA60 micro-dialysis catheters and (B) relationship between glucose recovery and acetate loss rates with results from collected dialysates using microdialysis of glucose solutions and blood plasma samples; glucose concentrations were 10, 11.11, and in aqueous, plasma, and spiked plasma, respectively.  From the theoretically expected recovery rates (or more generally called exchange rates across the dialysis membrane), with consideration of the membrane characteristics, compound diffusivities and flow rates, the following equation can be derived: with the recovery rate for glucose defined asthe exchange rate for acetate asand the diffusivity ratio asThe exchange rate for acetate can certainly be simplified, if the acetate concentration in the sample is negligible due to minor transport rates when compared to the amount in the sample volume or due to continuous transport away from the microdialysis catheter surrounding space, as experienced for in vivo implantation of the probe.Due to the limited volume of the in vitro dialyzed sample, true in particular for the plasma samples, the concentration of acetate from the diffusion process into the sample was also taken into account for the preceding calculations. Note that over a longer duration of time, the permeability of the catheter membrane changed even with the catheter dipped in aqueous solution. Recovery rates were not stable if the same or similar flow rates were later applied again for dialysis. With an even larger perfusion rate of , compared to the beginning of the dialysis experiment starting with a flow rate of , a slightly higher recovery rate was achieved. This may be the result of porosity changes in the membrane over time. Therefore, the different perfusate flow rates for one of the experiments based on aqueous glucose solutions are also listed [see Figs. 7A, 7B]. The diffusivity ratio for aqueous glucose samples, obtained from a nonlinear least-squares fit based on the preceding equation, was . The data of diffusivities of glucose and acetate in aqueous solution, taken from the literature28 and corrected for the temperature of our experiment, yielded a value of . Further experiments were carried out using plasma samples for the dialysis process, again with the use of CMA 60 catheters. The diffusivity ratio for glucose and acetate in plasma as calculated from the experimental data was . The data as shown in Fig. 7B when compared to the experiments using aqueous solutions are rather close to each other. Owing to the lower total protein and albumin concentrations found for dermal and subcutaneous interstitial fluid29, 30 (total proteins around and albumin around ), compared to the corresponding reference mean concentrations for plasma (total protein of and albumin of ), the value for the subcutaneously implanted microdialysis probe can be estimated to be in between the experimental results we found for the aqueous and plasma glucose samples. For our microdialysis recovery calculations later during blood glucose monitoring experiments with healthy subjects we used the formula based on aqueous glucose solutions. Using aqueous solutions as well as fluids derived from blood—despite the minor differences found for the diffusivity ratios—the model for the simultaneous determination of the microdialysis recovery rates, based on acetate as recovery marker, was experimentally proven and can be implemented for continuous glucose monitoring. 3.5.Short-Term Continuous Ex Vivo MonitoringOur first measurements with ex vivo glucose detection were carried out on three test persons, with all experiments together lasting for approximately ( on each subject) and providing us with 70 glucose readings with one value per . Owing to the large peristaltic pump and the length of the connecting Tygon tubing to the sampling valve (about ), the physical lag time between venous glucose readings and the IR measurements was approximately . This lag time can be significantly reduced by using shorter connection tubing to the valve including the sample loop. Due to the low dialysis recovery rates experienced for the volunteers using Ringer’s solution as perfusate, the dialysate glucose concentrations were found between 0.83 and . The PLS and CLS calibration results using different validation strategies are presented in Table 1 . Prediction of glucose concentration values by the PLS models, using the spectral data from the interval of 1180 to , resulted in an SEP of or better. From the cross-validation results when leaving single-subject data out, it is obvious that the absorbance spectra—with sample measurements close to the recorded background spectra—provide better and more robust calibration models than when relying on single-beam sample spectra. The latter strategy has also been chosen repeatedly by different groups for near-IR PLS calibration models.31, 32 When discussing the use of absorbance spectra, the calibration models on four spectral variables showed significantly reduced SEP values compared to the full interval calibration models. These results can provide the basis of a miniaturized spectrometer setup using filters or quantum cascade lasers as recently demonstrated.16, 17, 18 The investigations are important for further advancement of the IR spectroscopic techniques to be utilizable also for diabetic patients, requiring portable or even wearable instrumentation. The differences between the results based on either raw spectral absorbance data or logarithmized single-beam spectra, obtained with spectral variable selection, are found generally smaller than for full interval data calibrations. However, to achieve satisfactory results, eight wave number variables are required for optimal calibration modeling when based on only single-beam data, which is in contrast to four variables found when using absorbance spectra (see Table 1). An interesting feature is the achieved robustness of calibration models, based either on leave-10-samples-out cross-validation or using the whole spectral data of one subject for validation, while setting up calibration models with the residual other data sets, assignable to the remaining two probands. The CLS calibration using the spectral data from the interval 1560 to resulted in an SEP of , as calculated versus the dialysate reference concentration values. To calculate these glucose concentration estimates, a dilution factor of 0.86 for the 8-h experiments and of 0.90 for the longer lasting experiment were required for tracing back the original sample plug concentration before transport to the transmission microcell, respectively. The temporal glucose profiles of the dialysates, as measured by IR spectroscopy and based on a PLS calibration method using samples collected behind the transmission microcell and analyzed by a clinical reference method, are presented in Fig. 8A . Since the venous blood glucose values were also available for all three probands, it is interesting to present the blood glucose concentration values in combination with the temporally adjusted dialysate values obtained by IR spectroscopy and the reference assay. By applying a constant recovery rate for the microdialysis process using the first available dialysate concentration values (see different scales for dialysate and blood concentrations; this procedure is equivalent to a one-point calibration used for enzymatic electrochemical biosensors during in vivo monitoring experiments), a nonsatisfactory agreement between both temporal traces was obtained for the second subject [see Fig. 8B]. One reason is certainly a nonconstant recovery performance of the microdialysis probe after implantation and/or, second, physiological changes within the tissue after tissue perforation, which can explain deviations between venous and interstitial temporal glucose profiles (see also previous studies by Wisniewski 33). This explains the requirement for monitoring the performance of the implanted microdialysis catheter, a procedure that has been implemented for long-term continuous monitoring. Fig. 8(A) Oral glucose tolerance tests with three healthy volunteers showing the time course of concentrations in sampled dialysates from microdialysis probes inserted into the subcutaneous adipose tissue and predicted IR sensor values based on PLS calibrations and (B) comparison of blood and dialysate glucose concentrations taking into account a constant microdialysis recovery rate (one-point calibration using the first available dialysate concentration values in comparison to glucose in blood plasma).  The other discrepancies observed for the profile maximum are due to an insufficient sampling frequency and an air bubble removed from the cuvette after in our time scale [see Fig. 8B], missing out the extra excursions in the blood concentration values. To avoid incomplete cell filling, an automatic air bubble detection (based on the opaque wave number regions due to sample water absorption) and removal was successfully implemented into the programmable fluidics. Furthermore, the sampling frequency was raised to one measurement per 10-min time interval. 3.6.Long-Term Continuous Ex Vivo MonitoringA long-term continuous glucose monitoring experiment was carried out with a fourth subject lasting for and providing us with 69 glucose readings with one per using ELO-MEL as a perfusate. For system miniaturization, the large peristaltic pump (Minipuls 3) was replaced by the custom made miniperistaltic pump. A few problems owing to interferometer instability of the spectrometer were observed, due to which the system failed to collect readings until the interferometer stability was recovered. Also, fluidic problems including high cell backpressure hindered the measurements during the night from snack time to breakfast of the proband. These problems were solved later (see Ref. 24). The glucose concentrations measured were between 1.51 and . The CLS calibration model including the scaling due to microdialysis recovery rate compensation yielded an SEP value of , as calculated against the blood glucose values that were spline interpolated to match the timing of the spectral recordings. A comparison of blood and IR predicted dialysate glucose concentrations using CLS calibration and taking into account the microdialysis recovery rates are shown in Figs. 9A . As we can see in Fig. 9B, there are changes in the recovery rates that underline the necessity of an independent method for monitoring the dialysis efficacy. The advantage of CLS is certainly the reduced calibration effort with the selection of a small number of component spectra versus PLS-calibrations and the interpretation of the spectral residues after spectral fitting. Fig. 9(A) Time course of glucose concentrations in venous blood and dialysates from a microdialysis catheter, inserted into the subcutaneous adipose tissue of a healthy subject, calculated from a CLS calibration model including recovery correction (ELO-MEL perfusate flow rate was ) (an a posteriori adjustment of the time shift between venous blood sampling used for glucose concentration point-of-care measurements and the IR-sensor readings is used for presentation); and (B) glucose recovery rates estimated in parallel to glucose dialysate concentrations during the monitoring of interstitial concentrations by microdialysis. 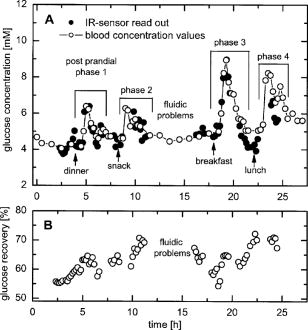 There are a few gaps in the concentration read out from the IR-sensor system, due to occurring air bubbles. The origin of such perturbations could later be assigned to a mismatch in the inner diameter of the Tygon tubing implemented for the push-pull operation of the peristaltic pump used for the perfusion of the microdialysis catheter; for later experiments, pieces of tubing directly neighbored to each other were employed to avoid existing variations in the tubing diameters. Furthermore, using the PLS calibration model from the short-term continuous monitoring data, the data obtained from the long-term continuous measurements on the fourth subject were reevaluated, for which an SEP value of was obtained. As pretreatment of the spectral data, a scaled subtraction of an aqueous solution acetate spectrum was applied to render the spectra compatible in composition to the 8-h experiments, for which Ringer’s solution was used as microdialysis perfusate. The least-squares fit also provided us with the information required for microdialysis recovery. These results confirm that the experience obtained previously from the multivariate analysis of biofluids can be transferred without any problem to the quantitative analysis of dialysates. To assess the clinical applicability of the concentration readings of the bedside instrument, the results were compared with the clinical blood glucose reference values using the so-called Clarke error grid (CEG) analysis. The error grid analysis is a scheme for determining the accuracy of blood glucose meters.34 Using the Beckman analyzer results as the reference values, the grid is subdivided into five zones: A, B, C, D, and E. Values in zones A and B represent consistent or acceptable glucose concentration results. Values in zone C may prompt unnecessary corrections that could lead to a poor outcome in therapy. Values in zone D represent a dangerous failure for detection and treatment. Values in zone E represent an “erroneous treatment.” In short, the more values that appear in zones A and B, the more acceptable is the device performance in terms of its clinical utilization. As illustrated in Fig. 10 , the CEG analysis of the IR spectroscopically predicted glucose concentrations showed all but two values in the clinically accurate zone A and two readings in the acceptable zone B. Our fine correlation of the interstitial glucose concentrations with the blood values, as found for the healthy subjects, is therefore very encouraging for a provision and future implementation of portable bedside instrumentation into the critical care environment, especially stressing the fact of ensuring reliable long-term applications for patient monitoring with a minimum of operator intervention. Fig. 10CEG analysis of the IR CLS-predicted and recovery-corrected glucose concentration values versus venous blood glucose measurements with the lag time of IR sensor readings adjusted.  Table 1Results of PLS calibrations for glucose in dialysates from subcutaneously implanted microdialysis catheters, using spectral data from the interval 1180 to 950cm−1 and based on different validation strategies (SEP, standard error of prediction given in mM; NPLS – optimal number of PLS factors used for calibration modeling; Nλ is the number of spectral variables used after optimal wavenumber selection); for CLS calibration the spectral range of 1560 to 1000cm−1 was used.
In the latter context, the implementation of a simultaneous determination of the microdialysis recovery rate determination using ELO-MEL perfusate is rather unique and will enable us to have a more accurate understanding of the tissue dynamics compared to the intravascular compartment. A different option for determining the recovery rates is using an ion-free isotonic perfusate, which contains 5% mannitol, in combination with either an offline determination of the sodium concentrations by flame photometry or by an online conductivity measurement.35, 36 However, in both cases, the assays rely on a rather constant electrolyte concentration in the interstitial compartment, a hypothesis that may be questioned for critically ill patients with several homeostasis disorders, who—apart from distortions in glycemia—also experience perturbations in the physiological ionic equilibrium. In addition, medications used in the intensive care unit (ICU) can influence the sodium ion concentration.37, 38, 39 To prove the general applicability, another option is the determination of (partial pressure of carbon dioxide), which can also be achieved by infrared spectroscopy, e.g., see our early paper on glucose quantification in whole blood,7 which showed spectral features that are easily assigned to the asymmetric stretching vibration of dissolved at . In such a case, the optical bandpass filter must be removed to access the “natural” broad spectral range of the mid-IR spectrometer. Fluctuations in the spectrometer’s atmosphere must be avoided for such meassurements, which can be achieved by purging the spectrometer and subsequent sealing. In combination with accurate bicarbonate measurements, pH values can also be calculated for dialysate fluids and interstitial compartment using the Henderson-Hasselbalch equation for the corresponding equilibrium. 4.ConclusionsA bedside device for quasicontinuous monitoring of glucose in interstitial fluid within the subcutaneous tissue with intermittent sensor readouts at 10-min intervals, using a conventional mini-FTIR spectrometer in combination with a microdialysis probe and a programmable fluidic system for sample transportation was developed. Using calibrations with multiwavelength information, reliable long-term continuous interstitial glucose monitoring is made possible. Our results from transmission spectrometry indicate that the developed technology with automated operation is very promising, including easy sample handing, cell flushing, and cleansing to avoid requirements for recalibration, which is significantly different from electrochemical enzymatic implantable or ex vivo applied biosensors. The option for determining other metabolites such as urea,40 lactate, and others is also possible, rendering the potential for a multicomponent assay implemented within an all-purpose reagent-free clinical analyzer. The same technology can also be used in the future to monitor a cell-culture medium or a fermentation bioreactor. AcknowledgmentsFinancial support by the European Commission within the CLINICIP (Closed Loop Insulin Infusion for Critically Ill Patients) project (Contract No. 506965, 6th Framework Programme) is gratefully acknowledged. The continuous support by the Ministerium für Innovation, Wissenschaft, Forschung und Technologie des Landes NRW and the Bundesministerium für Bildung und Forschung is also acknowledged by the authors from the ISAS-Institute for Analytical Sciences. ReferencesH. M. Heise,
“Clinical applications of near- and mid-infrared spectroscopy,”
Infrared and Raman Spectroscopy of Biological Materials, 259
–322 Marcel Dekker, New York (2001). Google Scholar
E. Diessel,
P. Kamphaus,
K. Grothe,
R. Kurte,
U. Damm, and
H. M. Heise,
“Nanoliter serum sample analysis by mid-infrared spectroscopy for minimally invasive blood glucose monitoring,”
Appl. Spectrosc., 59 442
–451
(2005). 0003-7028 Google Scholar
S. Clement,
S. S. Braithwaite,
M. F. Magee,
A. Ahmann,
E. P. Smith,
R. G. Schafer, and
I. B. Hirsch,
“Management of diabetes and hyperglycemia in hospitals,”
Diabetes Care, 27 553
–591
(2004). https://doi.org/10.2337/diacare.27.2.553 0149-5992 Google Scholar
G. Van den Berghe,
P. Wouters,
F. Weekers,
C. Verwaest,
F. Bruyninckx,
M. Schetz,
D. Vlasselaers,
P. Ferdinande,
P. Lauwers, and
R. Bouillon,
“Intensive insulin therapy in the critically ill patients,”
N. Engl. J. Med., 345 1359
–1367
(2001). https://doi.org/10.1056/NEJMoa011300 0028-4793 Google Scholar
G. Van den Berghe,
A. Wilmer,
G. Hermans,
W. Meersseman,
P. J. Wouters,
I. Milants,
E. Van Wijngaerden,
H. Bobbaers, and
R. Bouillon,
“Intensive insulin therapy in the medical ICU,”
N. Engl. J. Med., 354 449
–461
(2006). 0028-4793 Google Scholar
G. Van den Berghe,
P. Wouters,
K. Keteloot, and
D. E. Hilleman,
“Analysis of healthcare resource utilization with intensive insulin therapy in critically ill patients,”
Crit. Care Med., 34 612
–616
(2006). 0090-3493 Google Scholar
H. M. Heise,
R. Marbach,
G. Janatsch, and
J. D. Kruse-Jarres,
“Multivariate determination of glucose in whole blood by attenuated total reflection infrared spectroscopy,”
Anal. Chem., 61 2009
–2015
(1989). https://doi.org/10.1021/ac00193a004 0003-2700 Google Scholar
G. Janatsch,
J. D. Kruse-Jarres,
R. Marbach, and
H. M. Heise,
“Multivariate calibration for assays in clinical chemistry using attenuated total reflection infrared spectra of human blood plasma,”
Anal. Chem., 61 2016
–2023
(1989). https://doi.org/10.1021/ac00193a005 0003-2700 Google Scholar
H. M. Heise,
“Glucose measurements by vibrational spectroscopy,”
Handbook of Vibrational Spectroscopy, 5 3280
–3294 Wiley, Chichester (2002). Google Scholar
Y. J. Kim,
S. Hahn, and
G. Yoon,
“Determination of glucose in whole blood samples by mid-infrared spectroscopy,”
Appl. Opt., 42 745
–749
(2003). https://doi.org/10.1038/nj6959-745a 0003-6935 Google Scholar
Y. C. Shen,
A. G. Davies,
E. H. Linfield,
T. S. Elsey,
P. F. Taday, and
D. D. Arnone,
“The use of Fourier-transform infrared spectroscopy for the quantitative determination of glucose concentration in whole blood,”
Phys. Med. Biol., 48 2023
–2032
(2003). https://doi.org/10.1088/0031-9155/48/13/313 0031-9155 Google Scholar
W. B. Martin,
S. Mirov, and
R. Venugopalan,
“Using two discrete frequencies within the middle infrared to quantitatively determine glucose in serum,”
J. Biomed. Opt., 7 613
–617
(2002). https://doi.org/10.1117/1.1501893 1083-3668 Google Scholar
D. Rohleder,
G. Kocherscheidt,
W. Kiefer,
W. Köhler,
J. Möcks, and
W. Petrich,
“Comparison of mid-infrared and Raman spectroscopy in the quantitative analysis of serum,”
J. Biomed. Opt., 10 031108-1
–10
(2005). https://doi.org/10.1117/1.1911847 1083-3668 Google Scholar
H. M. Heise,
A. Bittner,
T. Koschinsky, and
F. A. Gries,
“Ex-vivo determination of blood glucose by microdialysis in combination with infrared attenuated total reflection spectroscopy,”
Fresenius' J. Anal. Chem., 359 83
–87
(1997). 0937-0633 Google Scholar
P. S. Jensen,
J. Bak,
S. Ladefoged, and
S. Andersson-Engels,
“Determination of urea, glucose, and phosphate in dialysate with Fourier transform infrared spectroscopy,”
Spectrochim. Acta, Part A, 60 899
–905
(2004). https://doi.org/10.1016/S1386-1425(03)00317-2 0584-8539 Google Scholar
W. B. Martin,
S. Mirow, and
R. Venugopalan,
“Middle infrared, quantum cascade laser optoelectronic absorption system for monitoring glucose in serum,”
Appl. Spectrosc., 59 881
–884
(2005). https://doi.org/10.1366/0003702054411580 0003-7028 Google Scholar
S. Schaden,
A. Dominguez-Vidal, and
B. Lendl,
“Simultaneous measurement of two compounds in aqueous solution with dual quantum cascade laser absorption spectroscopy,”
Appl. Phys. B, 83 135
–139
(2006). https://doi.org/10.1007/s00340-006-2133-1 0946-2171 Google Scholar
A. Lambrecht,
T. Beyer,
K. Hebestreit,
R. Mischler, and
W. Petrich,
“Continuous glucose monitoring by means of fiber-based, mid-infrared laser spectroscopy,”
Appl. Spectrosc., 60 729
–736
(2006). https://doi.org/10.1366/000370206777887071 0003-7028 Google Scholar
J. T. Olesberg,
M. A. Arnold,
C. Mermelstein,
J. Schmitz, and
J. Wagner,
“Tunable laser diode system for noninvasive blood glucose measurements,”
Appl. Spectrosc., 59 1480
–1484
(2005). https://doi.org/10.1366/000370205775142485 0003-7028 Google Scholar
H. Fabian,
P. Lasch, and
D. Naumann,
“Analysis of biofluids in aqueous environment based on mid-infrared spectroscopy,”
J. Biomed. Opt., 10 031103
(2005). https://doi.org/10.1117/1.1917844 1083-3668 Google Scholar
H. M. Heise,
U. Damm,
O. Vogt, and
V. R. Kondepati,
“Towards reagent-free blood glucose monitoring using micro-dialysis and infrared transmission spectrometry,”
Vib. Spectrosc., 42 124
–129
(2006). 0924-2031 Google Scholar
H. M. Heise and
A. Bittner,
“Rapid and reliable spectral variable selection for statistical calibrations based on PLS-regression vector choices,”
Fresenius' J. Anal. Chem., 359 93
–99
(1997). 0937-0633 Google Scholar
H. M. Heise,
P. R. Janissek, and
P. Fischer,
“Application of detector non-linearity correction for FT-IR spectrometric gas analysis of samples,”
Mikrochim. Acta, 14 301
–303
(1997). 0026-3672 Google Scholar
U. Damm,
V. R. Kondepati, and
H. M. Heise,
“Continuous reagent-free bed-side monitoring of glucose in biofluids using infrared spectrometry and micro-dialysis,”
Vib. Spectrosc., 43 184
–192
(2007). 0924-2031 Google Scholar
C. Lentner, Wissenschaftliche Tabellen Geigy, 8th ed.Ciba Geigy Ltd., Basle (1979). Google Scholar
A. J. M. Schoonen and
K. J. C. Wientjes,
“Glucose transport in adipose tissue,”
Sens. Actuators B, 105 60
–64
(2005). https://doi.org/10.1016/S0925-4005(04)00111-X 0925-4005 Google Scholar
J. D. Zahn,
D. Trebotich, and
D. Liepmann,
“Microdialysis microneedles for continuous medical monitoring,”
Biomed. Microdevices, 7
(1), 59
–69
(2005). 1387-2176 Google Scholar
L. Andrussow,
“Diffusion in Flüssigkeiten,”
Landolt-Börnstein, Zahlenwerte und Funktionen aus Physik, Chemie, Astronomie, Geophysik und Technik, II/5a 6th ed.Springer-Verlag, Berlin/Heidelberg (1969). Google Scholar
N. F. Andersen,
B. M. Altura,
B. T. Altura, and
O. S. Andersen,
“Composition of interstitial fluid,”
Clin. Chem., 41 1522
–1525
(1995). 0009-9147 Google Scholar
M. Ellmerer,
L. Schaupp,
G. A. Brunner,
G. Sendlhofer,
A. Wutte,
P. Wach, and
T. R. Pieber,
“Measurement of interstitial albumin in human skeletal muscle and adipose tissue by open-flow microperfusion,”
Am. J. Physiol. Endocrinol. Metab., 278 352
–356
(2000). Google Scholar
Q. Ding,
G. W. Small, and
M. A. Arnold,
“Evaluation of data pretreatment and model building methods for the determination of glucose from near-infrared single-beam spectra,”
Appl. Spectrosc., 53 402
–414
(1999). https://doi.org/10.1366/0003702991946866 0003-7028 Google Scholar
H. M. Heise and
A. Bittner,
“Multivariate calibration for near-infrared spectroscopic assays of blood substrates in human plasma based on variable selection using PLS-regression vector choices,”
Fresenius' J. Anal. Chem., 362 141
–147
(1998). https://doi.org/10.1007/s002160051047 0937-0633 Google Scholar
N. Wisniewski,
N. Rajmand,
U. Adamsson,
P. E. Lins,
W. M. Reichert,
B. Klitzman, and
U. Ungerstedt,
“Analyte flux through chronically implanted subcutaneous polyamide membranes differs in humans and rats,”
Am. J. Physiol. Endocrinol. Metab., 282 E1316
–E1323
(2002). Google Scholar
W. L. Clarke,
“The original Clarke error grid analysis (EGA),”
Diabetes Technol. Ther., 7 776
–779
(2005). Google Scholar
L. Schaupp,
M. Ellmerer,
G. A. Brunner,
A. Wutte,
G. Sendlhofer,
Z. Trajanoski,
F. Skrabal,
T. R. Pieber, and
P. Wach,
“Direct access to interstitial fluid in adipose tissue in humans by use of open-flow microperfusion,”
Am. J. Physiol. Endocrinol. Metab., 276 E401
–E408
(1999). Google Scholar
M. Ellmerer,
M. Haluzik,
J. Blaha,
J. Kremen,
S. Svacina,
W. Toller,
J. Mader,
L. Schaupp,
J. Plank, and
T. Pieber,
“Clinical evaluation of alternate site glucose measurements in patients after major cardiac surgery,”
Diabetes Care, 29 1275
–1281
(2006). https://doi.org/10.2337/dc05-2377 0149-5992 Google Scholar
P. Wilkes,
“Hypoproteinemia, strong-ion difference, and acid-base status in critically ill patients,”
J. Appl. Physiol., 84 1740
–1748
(1998). 8750-7587 Google Scholar
E. M. Omron,
“Comparative quantitative acid-base analysis in coronary artery bypass, severe sepsis, and diabetic ketoacidosis,”
J. Int. Care Med., 20 269
–278
(2005). Google Scholar
M. Moviat,
P. Pickkers,
P. H. van der Voort, and
J. G. van der Hoeven,
“Acetazolamide-mediated decrease in strong ion difference accounts for the correction of metabolic alkalosis in critically ill patients,”
Crit. Care, 10 R14
(2006). Google Scholar
V. R. Kondepati,
U. Damm, and
H. M. Heise,
“Infrared transmission spectrometry for the determination of urea in micro-liter sample volumes of blood plasma dialysates,”
Appl. Spectrosc., 60 920
–925
(2006). https://doi.org/10.1366/000370206778062066 0003-7028 Google Scholar
|
||||||||||||||||||||||||||||||||||||||||||||||||||||||||||||||||||||||


