|
|
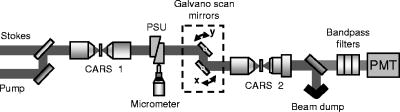
1.IntroductionOptical interferometric methods have been very useful for many metrological applications such as surface analysis of optical and mechanical components, precise measurements of optical wavelength, and many geological and astronomical implementations.1, 2 They have also been utilized in optical microscopic applications to improve image qualities as in the phase contrast and the differential interference contrast (DIC) techniques. Recently, the low-coherence optical interference method has made it possible to acquire optical tomographic images of several biological samples.3, 4 In most interferometric techniques, two light waves originating from one source are linearly superposed with some relative amplitude and phase differences to produce intensity modulations called fringes in the spatial and temporal domains. The relative phase carries information concerning the optical path difference (OPD) between optical paths two waves follow. In some different situations of optical interferometry where light waves with high intensities produce parametric nonlinear optical signals in highly nonlinear media, the optical signals have definite phase relations with the fundamental waves, resulting in the interference between two different nonlinear optical signal waves produced in two different samples. The phase relation of a nonlinear optical signal to the fundamental one depends on the nonlinear optical properties of the sample we want to measure, some of which include resonant behavior of the molecules inside the sample. Physically, it is quite similar to the situation of harmonic or anharmonic oscillators driven by external harmonic forces around their characteristic resonant frequencies. They have a definite phase relation with the external forces, and their phases depend on how much the external frequencies are detuned from the resonant frequencies of the oscillators and on their damping coefficients. Thus, we want to utilize this nonlinear optical interference effect in one of the nonlinear optical four-wave-mixing processes known as coherent anti-Stokes Raman scattering (CARS) for microscopic imaging applications. CARS was originally recognized as an important spectroscopic tool for its superiority to spontaneous Raman scattering. As it is used for a nonlinear optical parametric wave, a CARS signal is spatially and temporally coherent and propagates in a specified direction to which the phase-matching condition is satisfied. One of its main applications in early studies focused on spectroscopic measurements of gaseous samples in combustion flames or a small number of ionic species in plasma chambers for temperature and concentration analysis in a noncontact manner.5 Thus, CARS has long been widely studied and adopted in the fields of plasma and combustion diagnostics. Then, after its revival in 1999 as a new microscopic contrast mechanism, CARS proved to be a power method for sensitive vibrational imaging of biological samples.6, 7 This second phase of CARS application as an optical microscopic tool was prompted by recent cutting-edge technologies of ultrafast light sources and improved detection schemes. Since the molecular vibrational contrast in CARS imaging, which results from the inherent Raman activity of molecules in biological samples, does not require samples to be fluorescence labeled, CARS microscopy is capable of noninvasive live cell and tissue imaging. In contrast to spontaneous Raman scattering, CARS inherently has a background that is nonresonant with molecular vibration and is added coherently to a resonant signal to result in an interference effect, and this usually results in the CARS spectra being complicated to analyze. However, a strong nonresonant background might sometimes be very useful in terms of enhancing the resonant signal through a homodyne interferometric amplification and consequently improving the image quality.8, 9, 10 In this paper, we set up a nonlinear optical interferometer to see how CARS imaging can be improved by interferometric implementations. The experimental scheme is different from conventional schemes that have been tried elsewhere for imaging purpose.10, 11 With one set of incident pump and Stokes beams as fundamental waves, CARS signals are generated two times successively in two thin glass media placed in series along the beam propagation direction and their relative phase is controlled by a phase-shifting unit (PSU) between two glass samples.12, 13 The phase can be controlled in such a way that the thickness of the PSU is varied to change the optical path lengths for both the fundamental and the CARS signal waves. In this kind of interferometer, a bulky optical setup for splitting beams followed by recombination is not necessary and the overall implementation is very simple and easy. We first obtain the interference fringes of two nonresonant CARS signals from glass media. Then we replace the second sample with a mouse skin tissue and perform raster scans of the laser beams on it. We demonstrate image quality improvement with a proper adjustment of the relative phase. 2.TheoryA simplified schematic for the nonlinear optical interferometry of two CARS signals is shown in Fig. 1 , where two thin CARS media are placed at the focal points of microscope objective lenses and a PSU of variable thickness is inserted in-between. The CARS signal generated at the first medium propagates through several dispersive materials along with fundamental waves including the pump and the Stokes beams. The dispersive materials consist of lenses and a PSU, inside which the fundamental and the CARS signal waves travel in different phase velocities. Thus, the CARS signal generated at the second medium would have a different phase from that of the first CARS signal, and the phase difference can be adjusted by changing the thickness of the PSU. The interference signal is then filtered and detected in a photodetector. The observed interference signal can be expressed as where , , and and are the third-order nonlinear susceptibilities of two CARS media. The overall constant includes the fundamental beams intensities, and , , and correspond to the frequencies of the pump, the Stokes, and the CARS signal beams, respectively. The phase changes caused by all dispersive materials except the PSU are fixed and are included in , which is just a function of frequencies. The also includes the phase variation arising from the imaginary part of . For a given frequency set , the CARS signal intensity is modulated by the PSU thickness with a period of called the coherence length. Assuming first CARS signal as a local oscillator and the second one as a sample signal, we find that the CARS signal from the sample can be greatly enhanced with the local oscillator signal. As can be noted immediately in Eq. 1, while the sample signal intensity without the local oscillator signal is , it is significantly changed to with the help of nonlinear optical interference and proper suppression of the background offset . The offset can be measured experimentally by blocking the pump and Stokes beams just before the second objective lens and passing only the first CARS signal through it. The signal is maximized for to result in , and approximated to for the case of . Thus, it is increased by a factor of ,12 and this explains how the CARS image quality is improved through interferometry. Note that this enhancement effect is irrespective of whether is resonant or nonresonant. One thing must be taken care of for this scheme to work properly in practice. Since any fluctuation noises of the local oscillator field can have a large impact on measured signals, the incident laser intensities should be kept stable during measurements; otherwise no interferometric benefit results.In some imaging applications, on the other hand, we want to be free of nonresonant backgrounds to get contrast solely from vibrational Raman modes. This can be achieved by separating the imaginary part of from the real part, which contains nonresonant contributions.11 To see briefly how it could be done, we decompose into the real and imaginary parts and put them into Eq. 1 to give where is the nonlinear susceptibility of the local oscillator and is assumed to be real. As we can easily see in Eq. 2, the nonresonant contribution in the real part can be minimized with . Thus, if we use the heterodyne detection technique with a proper rejection of the homodyne terms, only the resonant imaginary response can be obtained.103.ExperimentA mode-locked Nd:vanadate laser of repetition and pulse duration (PicoTrain, High-Q Lasers) is used as the Stokes beam at , and the pump beams at are generated as a pulse train from an intracavity doubled optical parametric oscillator (Levante, APE Berlin) that is synchronously pumped by the Nd:vanadate laser. The pump and the Stokes beams are collinearly combined by a dichroic beamsplitter and sent to an objective lens of numerical aperture (NA) 0.1 to generate the first CARS signal of a thin glass slab at the focal point and then recollimated by the same kind of lens. Two remaining fundamental beams and the first CARS signal beam are propagated through a PSU and refocused at the other glass slab by another objective lens of NA 0.25 to generate the second CARS signal and to cause the interference with the first CARS signal. The interference CARS signal passes through a dichroic beamsplitter to dump out most fundamental beams accompanying the signal and proceeds through three bandpass filters in series to reject still remaining fundamental beams. The spectral center position and width of the combined filter set are 660 and about in full width of half maximum, respectively. The signal finally arrives at a photomultiplier tube (PMT) to be measured. The PSU consists of a pair of BK7 glass wedges of the same slope . One part of the PSU wedges is fixed and the other can slide on it to change the overall thickness of the unit. A slide of corresponds to . This can be precisely done by moving a micrometer. To acquire CARS images of various samples, we adopt a scanning galvano mirror system to perform raster scans of the laser beams on the samples at the focal plane. The maximum scan angle of our system is about for each axis, and the field of view of our second objective lens, which has a focal length of , can be as wide as . We can obtain CARS images at a speed of one single frame per second with . The power levels of the pump and the Stokes beams at the second sample are kept around in total so as not to severely damage biological samples.14 The lateral and axial spatial resolutions of the presented setup are estimated to be 2 and , respectively. 4.Results and DiscussionThe Raman shift set by our experimental conditions is , and the CARS signal in anti-Stokes region with respect to the pump wavelength of should be at . Since the thin glass samples used in this experiment do not have vibrational resonances around , the CARS signal is purely nonresonant. We measured interference fringes of two CARS signals generated at this Raman shift, as shown in Fig. 2a . We did not scan galvano mirrors in this measurement, so the focal spot at the second sample is fixed spatially. Constructive and destructive interferences of two signals can be seen clearly in the plot of the PMT output voltages as a function of PSU thickness, which shows a coherence length of —a period of the sinusoidal curve. To calculate the theoretical value of the coherence length, we used refractive indices of BK7 glass at 1064, 817.2, and as 1.50664, 1.51042, 1.51408, respectively.15 Equation 1 gives us the coherence length as , which is in a good agreement with the measured value. In Fig. 2a, however, the measured fringe visibility 0.45 has some discrepancy with the theoretical number 0.96 that is deduced from two the CARS signals 500 and before interference. This incomplete interference might be somehow related to longitudinal and transverse chromatic aberrations of the lenses we used, for which the aberrations are not well corrected enough to be used over the broad spectral range of the near-IR covering . Currently we could not estimate to what degree the aberrations are present. However, we could determine that the visibility was increased to 0.5 as we reduced the beam sizes of incident lasers from diameter. This means that the aberration effects surely exist and the resulting wavefront imperfection disturbs the complete spatial mode overlap of two CARS signals. Only the partially overlapping part of the CARS beams provides the modulation in the interferogram. Fig. 2(a) Interference fringes of two CARS signals measured as a function of PSU thickness and (b) 2-D interferogram obtained by raster scanning laser beams on the second glass slab and with the PSU thickness fixed. Since the lens system has a cylindrical symmetry, the interferogram necessarily shows concentric fringes. A position-dependant phase difference between two CARS signals gives rise to interference fringes. 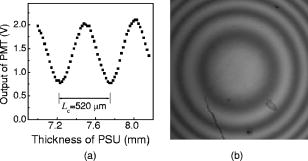 In the next step, we scanned the laser beams on the sample to see how the interference condition varied with scanning positions in the image plane. It is desirable to have a uniform phase distribution over the image plane to achieve a good performance of nonlinear interferometric CARS imaging. In general, unfortunately, when laser beams are scanned angularly by a galvano mirror system through an objective lens, they essentially travel different path lengths within highly dispersive lens media for different angular positions.9 This effect is more pronounced especially for very thick lenses such as high-NA objectives made of a stack of many lenses with sophisticate designs. This resembles the situation of changing PSU thickness, and consequently results in a reduced field of view within which the interferometric effort pays. Figure 2b shows a 2-D interferogam taken as the laser beams scan over the thin glass slab through our second focusing objective lens. The PSU thickness at this time was fixed in a position where the CARS signal was at its maximum at the center of the interference image. As expected, there is a position-dependant phase difference between two CARS signals. Since the lens system has a cylindrical symmetry, the interferogram necessarily shows concentric fringes. The maximum phase variation is about when the laser beams scan in full scale across the image plane, and the area is . From the resulting interferogram, we found that the scan area with a phase difference less than is about for the presented setup. The restriction on the usable field of view caused inevitably by chromatically dispersive lens media can be eliminated by using all-reflective microscope objectives. In addition to the position-dependent interference condition already mentioned, there might be one more position-dependent effect when we scan the laser beams deep inside the sample. In an inhomogeneous medium, the beam intensities decrease with depth to a different degree at each different position and the relative phase of two CARS signals also has some variation over different sample areas because the first CARS signal and two fundamental beams propagate through different refractive index regions. However, these effects would be negligible if we restricted our interests to the shallow regions not far from the sample surface. For a distance much shorter than the coherence length of the presented CARS interferometry setup, the relative phase does not change much and some variation of refractive index has no significant effect on the interference condition. Also the fact that beam intensity losses into typical biological samples are not dramatically varied with respect to sample positions makes our method useful for biological imaging applications.16 Figure 3a and 3b shows two different CARS images obtained as the laser beams scan -diam polystyrene beads distributed over a microscope coverslip. This clearly demonstrates how the nonlinear optical interferometry can improve the image quality. Whereas Fig. 3a was measured without the first glass medium to show just a noninterferometric normal CARS image, Fig. 3b is the interferometric image obtained when we put the glass slab in place and adjust the PSU to make constructive interference. The image contrast is improved to distinguish the beads from background more clearly with increased brightness. For these results, note that the improved contrast in the resulting brighter image are not achieved by increasing the incident laser power of the pump and the Stokes beams but just by adding another CARS signal coherently. Better interferometric imaging performance is expected if we use a lens system with less aberration or an all-reflective-type mirror system. Since the current experiments were carried out at a Raman shift of , we were a bit away from polystyrene vibrational resonances, which are around6 2851, 2902, and . Thus, the CARS images of beads appear more nonresonant, and the contrast can be further enhanced if we move to the vibrational resonances. The scanned areas of Fig. 3 are , and the relative phases in the majority of the areas are less than for the interferometric images. Finally, a comparison of Figs. 3c and 3d shows the same interferometric benefit obtained for real biological tissue taken from a mouse skin. The lateral intensity profiles along the designated lines in both images are explicitly depicted for comparison. Fig. 3(a) CARS image measured without the first CARS signal to give just a normal CARS image with no interference effect, and (b) interferometric CARS image obtained with the first CARS signal and constructive interference. The increased brightness and the improved contrast are achieved without increasing the incident laser power of the pump and the Stokes beams. (c) Normal and (d) interferometric CARS images of mouse skin tissue.  Fourier analysis of the spatially dependent intensity noise in two different CARS images shows that the interferometric image has a 3.5 times higher SNR than the noninterferometric image. Since the CH-stretching vibrational modes of molecules in the sample are nearly in resonance with the frequency difference of the pump and the Stokes beams set in the presented experiment, the CARS images in this case represent molecular vibrational contrast.10 In our current experimental setup, the interference is not complete enough to take full advantage of interferometric benefit already mentioned. Improvement of optical system design after precise wavefront diagnostics should be conducted for more complete interference to provide better imaging performance. Further studies on the simultaneous phase control of various frequency components in a wide spectral range are also necessarily followed to expand the capability of the presented interferometric scheme to multiplex CARS systems because the same phase offset cannot be implemented for all the wavelengths within CARS spectrum with one setting of PSU. In conclusion, we demonstrated that nonlinear optical interferometry of two successive CARS signals is capable of improving the image quality in a more convenient and simpler way than conventional interferometers. This was applied to a real biological sample taken from a mouse skin to show a 3.5 times increment of the SNR in the CARS imaging performance compared to a noninterferometric scheme. We find that this is a promising approach to be adopted for a high-performance CARS microscope system of the narrowband frequency scanning type. AcknowledgmentsThis work was supported by the R&D Program of Fusion Strategies for Advanced Technologies of the Ministry of Commerce, Industry and Energy (MOCIE). ReferencesW. Winkler,
K. Danzmann,
A. Rüdiger, and
R. Schilling,
“Heating by optical absorption and the performance of interferometric gravitational-wave detectors,”
Phys. Rev. A, 44 7022
–7036
(1991). https://doi.org/10.1103/PhysRevA.44.7022 1050-2947 Google Scholar
J. R. P. Angel and
N. J. Woolf,
“An imaging nulling interferometer to study extrasolar planets,”
Astrophys. J., 475 373
–379
(1997). https://doi.org/10.1086/303529 0004-637X Google Scholar
J. M. Schmitt,
M. J. Yadlowsky, and
R. F. Bonner,
“Subsurface imaging of living skin with optical coherence microscopy,”
Dermatology (Basel, Switz.), 191 93
–98
(1995). 1018-8665 Google Scholar
A. G. Podoleanu,
J. A. Rogers, and
D. A. Jackson,
“Three dimensional OCT images from retina and skin,”
Opt. Express, 7 292
–298
(2000). 1094-4087 Google Scholar
T. Dreier,
B. Lange,
J. Wolfrum, and
M. Zahn,
“Determination of temperature and concentration of molecular nitrogen, oxygen and methane with coherent anti-Stokes Raman scattering,”
Appl. Phys. B, 45 183
–190
(1988). https://doi.org/10.1007/BF00695289 0721-7269 Google Scholar
A. Zumbusch,
G. R. Holtom, and
X. S. Xie,
“Three-dimensional vibrational imaging by coherent anti-Stokes Raman scattering,”
Phys. Rev. Lett., 82 4142
–4145
(1999). https://doi.org/10.1103/PhysRevLett.82.4142 0031-9007 Google Scholar
A. Volkmer,
J.-X. Cheng, and
X. S. Xie,
“Vibrational imaging with high sensitivity via epidetected coherent anti-Stokes Raman scattering microscopy,”
Phys. Rev. Lett., 87 023901
(2001). https://doi.org/10.1103/PhysRevLett.87.023901 0031-9007 Google Scholar
S. H. Lim,
A. G. Caster, and
S. R. Leone,
“Single-pulse phase-control interferometric coherent anti-Stokes Raman scattering spectroscopy,”
Phys. Rev. A, 72 041803
(2005). https://doi.org/10.1103/PhysRevA.72.041803 1050-2947 Google Scholar
M. Flörsheimer,
M.-T. Bootsmann, and
H. Fuchs,
“Second-harmonic imaging of the absolute polar molecular orientation at interfaces,”
Phys. Rev. B, 65 125406
(2002). https://doi.org/10.1103/PhysRevB.65.125406 0163-1829 Google Scholar
E. O. Potma,
C. L. Evans, and
X. S. Xie,
“Heterodyne coherent anti-Stokes Raman scattering (CARS) imaging,”
Opt. Lett., 31 241
–243
(2006). https://doi.org/10.1364/OL.31.000241 0146-9592 Google Scholar
C. L. Evans,
E. O. Potma, and
X. S. Xie,
“Coherent anti-Stokes Raman scattering spectral interferometry: determination of the real and imaginary components of nonlinear susceptibility for vibrational microscopy,”
Opt. Lett., 29 2923
–2925
(2004). https://doi.org/10.1364/OL.29.002923 0146-9592 Google Scholar
E. S. Lee and
J. W. Hahn,
“Relative phase control between two successive coherent anti-Stokes Raman-scattering signals for the recovery of spectral lines,”
Appl. Opt., 33 8302
–8305
(1994). 0003-6935 Google Scholar
G. Marowsky and
G. Lüpke,
“CARS-background suppression by phase-controlled nonlinear interferometry,”
Appl. Phys. B, 51 49
–51
(1990). https://doi.org/10.1007/BF00332324 0721-7269 Google Scholar
Y. Fu,
H. Wang,
R. Shi, and
J. X. Cheng,
“Characterization of photodamage in coherent anti-Stokes Raman scattering microscopy,”
Opt. Express, 14 3942
–3951
(2006). https://doi.org/10.1364/OE.14.003942 1094-4087 Google Scholar
, Hoya Optical Glass Technical Data,
(1985) Google Scholar
C. L. Evans,
E. O. Potma,
M. Puoris’haag,
D. Cote,
C. P. Lin, and
X. S. Xie,
“Chemical imaging of tissue in vivo with video-rate coherent anti-Stokes Raman scattering microscopy,”
Proc. Natl. Acad. Sci. U.S.A., 102 16807
–16812
(2005). https://doi.org/10.1073/pnas.0508282102 0027-8424 Google Scholar
|