|
|
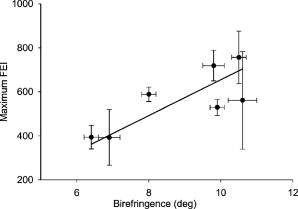
1.IntroductionProteins of the extracellular matrix (ECM) provide the foundation for the mechanical behavior of tissues.1, 2 For tendon and ligaments, collagen is the dominating protein, providing the qualities of strength and stiffness. The presence of elastin, a protein with low stiffness and a high tolerance of deformation, indicates a tissue with a potential for high deformation and elastic recovery.3 These are essential mechanical properties of skin, blood vessels, and tissues that are composites of both elastin and collagen fibers. Tissue restructuring is necessary for animal growth, for wound healing, and for any geometric changes related to pathology, and includes protein remodeling to maintain mechanical function. Two different optical techniques provide a means to track these changes—laser-induced fluorescence (LIF) spectroscopy and polarized light microscopy. To investigate changes in the ECM during the period of animal growth, we focused on rat tail tendon (RTT), a tissue predominantly of type I collagen,4 and over the same maturation period RTT skin, a composite tissue of collagen and elastin. LIF spectroscopy detects the natural fluorescence of the collagens in addition to the stronger fluorescence of elastin.5, 6 The technique of polarizing microscopy reveals the birefringence of the highly ordered molecular structure of collagen fibers7, 8 as well as their organization.9, 10 Elastin lacks the quality of birefringence and is not visible on the polarizing microscope. The tail tendon of the rat is a distinctive tendon in mammals, dominated by the highly ordered parallel bundles of type I fibers, each with a thin envelope of elastin.11, 12 RTT is well documented for mechanical and structural data, and has been established as a standard reference for strength and elasticity for type I collagen.13 For mature animals, the tendon has closely packed and aligned fibers, with a slight waviness in the unstressed state. Once straightened the aligned, parallel fibers exhibit a virtual intolerance for further elongation. Over the growth period of an animal, tendon collagen undergoes a process of continuous restructuring. Skin is also a thoroughly studied tissue, mainly composed of two layers, dermis and epidermis, where the dermis is composed of approximately 80% type I collagen,14 a small percentage of type III collagen,15, 16 and elastin. The top skin layer (epidermis) is where the keratin is located. During the maturation process, skin must also undergo protein remodeling to meet the demands of growth.16 Elastin and collagen types I, III, and IV are prevalent in the ECM of many tissues and have been investigated in the arterial wall, atheroma, and extensively in skin photoaging and cancer. 6, 13, 15, 16, 17, 18 The covalent cross-links that contribute to elastin fluorescence are desmosine and isodesmosine, and for collagen fluorescence pyridinoline and deoxypyridinoline.5, 19, 20 Excitation and emission maxima have been published for collagen and elastin.5, 20 The matrix proteins have characteristic emission spectra when irradiated with UV light. Composite spectra are produced when intact tissues are similarly irradiated. As developed in other studies, the transmission of the exciting radiation and the capture of data occur through the same probe, enabling endovascular measurements in vivo 21 or surface measurements on intact tissues in vitro,22 as employed in this study. By focusing on RTT in the maturing rat in the early weeks of life, we are establishing a foundation for later studies involving a broad range of tissue remodeling. Over the same animal growth period we also made measurements on skin, a tissue substantially different from tendon, having a wider representation of collagen types, including I and III, as well as elastin. We learned that the two optical techniques, responding differently to RTT matrix structure, were correlated in their response to the changing ECM over the early stages of maturation in these small animals. 2.Methods2.1.Tissue PreparationAnimals were available from other studies, supplied in accordance with protocols approved by the Animal Care Committee at the University. Tissue samples were harvested immediately after death from 27 male rats (25 Wistar, 2 Sprague Dawley), weight range 35 to (aged 15 to 115 days); animals were euthanized by either carbon dioxide inhalation or intraperitoneal injection of pentobarbital . Three or four tendon samples were dissected from the base region of each tail along with two samples of skin (one sample for measuring inner skin and one for outer skin). Tissue samples were stored in saline at until required for up to prior to spectroscopic measurements followed by fixation in 10% formalin for for subsequent histological studies. 2.2.Age-Weight CorrelationThe weights of all animals in the experiments were known and for a few animals the actual age at sacrifice was also known. Tabulated data on animal ages and weights from the supplier (Charles River Company) were used to explore empirical relations. Age versus weight had a sigmoidal relationship fit to with and a low standard error (SEE of ), where age is measured in weeks, is weight in grams, and is an empirical constant, not necessarily newborn weight. We chose to use weight for all graphical representations since weights were known for all animals. 2.3.Laser-Induced Fluorescence InstrumentationThe method for obtaining fluorescence spectra was developed for earlier research.23, 24 Fluorescence emission was triggered by UV excitation using an Argon laser (Innova 90, Coherent Laser Products, Palo Alto, California) operating at with a chopped wave output (0.2-ms exposure time; 1.0-ms delay) using a Uniblitz shutter producing an emission energy of 0.5 to (Vincent Associates, Rochester, New York) as previously described.25 By using a low laser power well below that at which photobleaching had been demonstrated in earlier pilot studies we avoided this complication. The laser beam was focused onto a 6F (French) laser angioplasty ring catheter (CeramOptec, Bonn, Germany). Spectra were collected with the tip of the catheter in perpendicular contact with the tissue surface, positioned using a micrometer stage with three degrees of freedom. The excitation radiation and collection of emission spectra occur through the same probe as illustrated in Fig. 1 . Spectra were recorded with an Optical Multichannel Analyzer (Model 1462, EG&G PARC, Toronto, Ontario). Prior to each data recording session the fluorescence emission intensity (FEI) spectra were calibrated with a mercury lamp. Fig. 1Instrument capture setup for detection of emission spectra following UV excitation. Positioning of the fiber optic, in the , , and directions, is achieved with micrometer controls. The fiber optic is placed perpendicular to tissue surface for optimal emission collection. Far right is a cross section of the fiber optic illustrating the concentric ring of silica fibers used to excite and collect light.  Spectra were obtained from animal samples of tail tendon and skin (dermal and epidermal surfaces) and separately from standard preparations of ECM proteins (collagen types I, and III and elastin) described in greater detail in the subsequent section. Ten spectra were recorded for each sampling site after background subtraction, and stored digitally for postprocessing. The system has a diminishing sensitivity with tissue depth, to a maximum penetration of , with a sampling area of . Tissue sample thickness of skin and tendon increased with age with values of 1 and , respectively, for the oldest animal group. 2.4.Protein Reference and Tissue SpectraWe used ECM protein standards from Sigma Chemical to establish separate reference spectra for each of collagen type I (rat tail tendon C-7661, acid soluble powder, Sigma Chemical, St. Louis, Missouri), collagen type III (calf skin C-3511, acid soluble), and elastin (bovine neck ligament E-6527, saline soluble powder). The proteins were placed in saline to provide a moist contact with the fiber optic catheter tip and to mimic the hydrated state of proteins in tissue. For tissue analysis, measurements were acquired in vitro from rat tail tendon and skin samples (epidermal and dermal surface). The 27 animals were divided into three weight classes for detection of gross fluorescence changes and based on natural weight clusters. Groups A, B, and C having 6, 6, and 15 rats respectively (presented in Table 1 with results) with mean weights and standard errors (SEs) of , , and . The animals were also divided into seven groups with uneven ( , 2, 4, 2, 2, 11, 4 in order of increasing weight) based on the data clusters to obtain a regression fit as a function of weight. 2.5.Analysis of Spectral DataStatistical methods for spectral data included analysis of variance (ANOVA) and multiple regression, as previously described.21, 23, 26 Postprocessing began with calculating the average intensity at each frequency for each sampling site.22 Mean values of maximum FEI were plotted as a function of weight, where the error bars are standard error. The mean spectra were then smoothed with a 15-point moving average (software written in MATLAB 6.5) and normalized to peak height by dividing fluorescence intensity at all wavelengths by the maximum intensity of the smoothed spectra (similar methods incorporated by Marcu 27). The wavelength edge below was not analyzed because these data included components from the incident excitation beam. The mean normalized FEI over the range of 390 to was analyzed with a one-way ANOVA using statistical software (SPSS version 11.5, Chicago, Illinois). A value of was our reference for statistical significance. Least significant difference (LSD) post hoc analysis was used to evaluate all possible pairwise comparisons between the three weight groups. Subsequent analysis of normalized average tendon spectra for the three weight groups was performed using stepwise linear regression; we used the extracted protein signature spectra (collagen types I and III and elastin) as reference functions. Regression analysis was used to calculate the relative weightings of each reference spectra that, when combined, closely approximated the measured tendon spectra (shown later in Fig. 6). 2.6.Histological PreparationSamples of fixed tissue for each weight range from rat tail tendon and skin were processed for histology with paraffin embedding, sectioned at and stained with Movat’s pentachrome stain for histological analysis28 (two sections per slide). We used a Zeiss Axioskop microscope equipped with a color video camera (Sony Power HAD 3CCD) and Northern Eclipse program (Empix Imaging Inc., Mississauga, Ontario) for point counting. This was done to calculate volume fractions of elastin and collagen in tendon and skin as a reference for fluorescence spectroscopy measurements. For polarized light, measurements were made on unstained sections cut parallel to the surface of the tendon and from the inner and outer surfaces of the flattened skin samples (i.e., surface of dermis and epidermis). 2.7.Birefringence MeasurementsThe methods for measuring the strength of birefringence are well established by other researchers7 and have been incorporated into previous studies by the authors.10, 29 Measurements were made on a Nikon Optiphot-Pol polarizing microscope (Nikon, Melville, New York) using a Sénarmont compensator, and a narrow-band interference filter that produces near monochromatic light . Birefringent materials such as collagen have two indices of refraction, and , associated with the “ordinary” and “extraordinary” rays of the resolved incident light. When linearly polarized light passes through the birefringent element of tissue, it is resolved into two rays. These pass through the tissue at different velocities, resulting in a phase difference, or retardation, of one ray relative to the other. The Sénarmont compensator is a plate inserted between the specimen and the analyzer, which retards one of the emerging rays by a quarter wavelength, converting the elliptically polarized light emerging from the birefringent tissue back to linearly polarized light at a rotated angle. This angle is proportional to the phase retardation or birefringence, and is measured by rotating the analyzer until extinction of the light is obtained. The birefringence is calculated from , where is the wavelength of the incoming light. To determine the relationship between birefringence and maturity, the animals were separated by weight into seven groups. From each of the samples of tail tendon and inner and outer skin, 10 measurements of collagen birefringence were made from different fiber regions. The geometry of the zigzag patterns of collagen is well documented in the literature. We investigated age-related changes in the geometry of fibers of RTT by making measurement of the crimp angle, and of the crimp period or wavelength, .30, 31 A representative sample of slides from the three weight groups was measured with two sampling areas per slide. Since the plane of the zigzag is not necessarily the same as the plane of sectioning, we also made measurements of the three dimensional (3-D) orientation of collagen fibers using polarized light. The measurement of the 3-D orientation of collagen fibers using a well-established technique is described elsewhere.32 In brief, the alignment of collagen fibers was measured using a Zeiss polarized light microscope with a rotating universal stage attachment. The universal stage enables the slide to be tipped and rotated in oblique planes. Thus, the two angles that define the orientation of a collagen fiber in 3-D space can be measured—the azimuthal angle (in the plane of the stage) and the elevation angle (out of the plane of stage). The crimp angle and period for the three weight groups were analyzed using ANOVA. 3.Results3.1.MicrographsThe micrographs in Fig. 2 , showing a tendon cross section stained with Movat’s pentachrome and a polarizing micrograph of a longitudinal section stained with the picrosirius red8 (for micrograph contrast enhancement), demonstrate the dimensions and general morphology of the tissue. The cross section shows the relatively unique feature of RTT having collagen bundles surrounded by a thin sheath of elastin. The micrograph of Fig. 2a and two other similar micrographs at different RTT stages of maturation were used to calculate the proportion of tail tendon that is elastin used for later comparisons with the calculations from fluorescence analysis. The percentage of elastin, of the tendon volume, was unchanged among the three weight groups. Fig. 2(a) Micrograph of tendon cross section with Movat pentachrome stain where nuclei and elastin are stained black and fibrous tissue is yellow, illustrating tissue organization, scale ; and (b) circularly polarized light micrograph of a longitudinally sectioned tendon stained with picrosirius red, scale . The schematic, lower right, illustrates the zigzag pattern of the collagen fibers with crimp angle and crimp period . 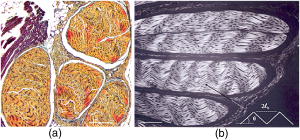 The variable fiber wave pattern appears as a zigzag, as shown by circularly polarized light [Fig. 2b]. In the planar direction, the collagen fibers had a mean amplitude angle and angular deviation of (to the long axis) and no significant differences between the three RTT age groups. However, the crimp period increased with weight from ( animal) to a maximum of ( animal) and did show a significant change between the immature and mature groups (ANOVA). The zigzag of the fibers defines a local plane in three dimensions, which may be quite different from the sectioning plane. These measurements are made from the projection of the zigzag crimp in the sectioning plane; hence, the crimp angles will be underestimated when the plane of the zigzag is substantially different from the sectioning plane. Three-dimensional measurements of the angular orientation of collagen fibers out of the sectioning plane showed that there were distinct alignment differences among adjacent fiber bundles and along individual fibers. These ranged to a maximum of crimp angle out of the section plane. Our measured crimp angles are greater than those described by Diamant 30 but are within the range of values described by Gathercole and Keller.31 The crimp period or wavelength varies as a function of weight and was found to increase significantly during maturation, being within the published range.30 Results of the crimp period or wavelength are independent of the plane of the zigzag. 3.2.Birefringence MeasurementsBlinded sets of birefringence measurements from longitudinally cut tissue sections of tail tendon and inner and outer skin samples from each animal were obtained by two microscopists. The data were grouped into the same seven weight groups as were used for the fluorescence study. Results for tendon and skin are shown in Fig. 3 . Inner versus outer skin birefringence data were found to be highly correlated and were therefore combined for weight relationships. The strength of birefringence increased with animal weight and reached a plateau for both skin and tendon, described by , where and , respectively. Birefringence values were higher for tendon compared to skin, an expected finding due to the dominance of type I collagen and larger fiber size. 3.3.Fluorescence SpectroscopyThe normalized and smoothed fluorescence emission spectra of purified extracted proteins commonly found in skin and tendon are shown in Fig. 4 . The FEI spectra for elastin and collagen types I and III have distinct spectral features. Elastin has a broad peak with its maximum ranging from 435 to and a full width at half maximum (FWHM) of . Type I collagen has a narrower peak with a maximum at and a FWHM of , and type III collagen peaks at with FWHM of . These characteristic spectral differences between the proteins enable separation using statistical approaches. Fig. 4Signature fluorescence emission spectra of the extracellular matrix proteins elastin and types I and III collagen in saline normalized to peak wavelength.  Smoothed and averaged emission spectra of tendon and inner and outer skin were obtained and grouped by animal weight and are plotted in Fig. 5 . Table 1 summarizes the numbers of animals in each group for analysis. The descending portion of the spectra is the most discriminating, and is therefore of importance for analysis. Significant differences in the one-way ANOVA were observed over the entire descending wavelength range for tendon, as illustrated in Fig. 5a, and specific ranges for inner skin (390 to 445 and 570 to ) and outer skin (390 to 440 and 555 to ) in Fig. 5b. Spectra for the inner skin were similar to those of tendon both in magnitude and peak wavelength. Fig. 5Emission spectra divided into three age groups (A, B, and C) for (a) rat tail tendon and (b) inner skin and outer skin.  The normalized spectral data for the three tendon weight groups were analyzed using stepwise regression in the 390- to range. Since collagen type I and elastin are the main components of tendon, these basis functions were input for all three weight groups. For tendon group A the variance is explained by collagen I and elastin with a high correlation of . Similarly for group B the variance is explained by collagen I and elastin with , and a sample fit is illustrated in Fig. 6 . For group C, the variance is explained by collagen types I and III and elastin with . The morphometric analysis of the pentachrome-stained section of tendon correlates with the regression analysis. The maximum fluorescence intensity is a comparative measure of the molecular changes and increased cross-linking that occurs during maturation. Figure 7a displays the positive correlation between maximum emission intensity for rat tail tendon as a function of weight, using weighted regression analysis to incorporate the nonuniformity in error . For this part of the study the animals were divided into seven groups based on weight. The measurement process was repeated for RTT skin where there was a significant positive correlation for the epidermal surface ; however, for the dermal skin surface there was no correlation, as illustrated in Fig. 7b. 4.DiscussionRat tail tendon during the early weeks of life has significant mechanical changes that include increasing ultimate tensile strength and reduced inelastic strain. These changes occur with little or no proportional change in the two principal proteins, collagen (type I) and elastin.1, 33 Tendon, in histological cross sections, reveals its composition of dominating collagen fibers with a fine sheetlike structure of elastin surrounding each bundle of collagen fibers [Fig. 2a] (a similar description is given by Caldini 11). This tissue is well suited for the investigation of its protein cross-linked molecular structure and how the results may complement the mechanical changes in the same period of maturation. It is known that several distinct fluorescing species are activated with UV excitation including collagen (types I and III) and elastin.5, 16, 34 Fluorescence spectroscopy specifically signals the cross-linked structure of collagen and elastin. Deyl 35 described tail tendon spectral characteristics at various excitation wavelengths for collagen and reported that fluorescence from enzyme induced cross-linking increased during maturation. For composite tissues comprised of both elastin and collagen, the differences in spectral shape are influenced by concentration effects and strong elastin fluorescence (normalized spectra are illustrated in Fig. 4). Statistical methods are used in the analysis to incorporate multiple features that are descriptors of the signature spectra of the individual proteins. No single method has emerged as the standard in this field of research and the approach of analysis is varied. Methods include fluorescence intensity ratio analysis,34 classification algorithms,36, 37 and statistical methods using ANOVA and multiple regression,23, 26, 38 the latter being the method chosen for this research. An established approach is to use normalized data that clearly show peak shifts, changes in FWHM, and gradients with respect to frequency.21 The composite spectral analysis of tendon tissue showed the strong presence of collagen type I and elastin as principal signature components, results that fit with known tendon structure. The peritendineum sheath (which surrounds each tendon) is composed of collagen bundles with elastic fibers interspersed.11, 12 Due to the intrinsic attenuating sensitivity of fluorescence spectroscopy, elastin is the large fluorescence contributor, since it appears at the tendon surface and is also scattered throughout the tendon. Also, we saw a steeper gradient for the older group in both skin and tendon spectra. We attributed this to the more developed tendon having larger and more cross-linked collagen fibers (reported by others), confirmed by histology. The tendon emission spectra had increased fluorescence with animal maturation, which parallels the results of Vogel,33 showing an increase in insoluble collagen and total collagen content in the more mature tail tendon, thus indicating increased cross-linking, as illustrated in Fig. 7a. However, spectral data from the inner skin did not differ significantly from each other over the maturation period [Fig. 7b], conflicting with the birefringence measurements, which increased to a plateau. The lack of increased fluorescence intensity is a result of changing skin thickness where at low weight, the skin is thin and semitransparent. In this case, the measurements are influenced by the hair follicles, which explains the similar fluorescence intensity measurements in both the dermis and epidermis during initial stages of maturation . By contrast, the epidermis had a greater fluorescence response at maturation than either tendon or inner skin, a result that we interpreted to be due to keratin in the hair, keratin being another fluorescing protein with its fluorescence overlapping both collagen and elastin.39 Note that UV excitation has a high absorption coefficient and is highly scattering, especially in complex layered structures such as skin, limiting the penetration depth. In addition, it is acknowledged that UV excitation can cause photodamage and photobleaching;40 however, by using a low laser power (0.5 to ), which is below the laser power where in previous studies photobleaching was observed, we avoided the complication of photobleaching. This was confirmed by assessing the fluorescence intensity and spectral shape throughout the measurement sequence. The interrelationship of tissue strength, molecular structure, and collagen fiber birefringence was reported for remodeling due to wound healing in small animals.2, 41, 42 Our project focused on RTT birefringence and LIF, but for a very different biological process of tissue remodeling during maturational changes in early animal life. The tissue birefringence as a function of weight (Fig. 3) increased monotonically to a plateau. Inner and outer skin fiber birefringence were measured separately and the data were highly correlated . Values of birefringence for tissue at a specific weight from inner versus outer skin were not influenced by the high birefringence of the hair follicles (follicles avoided at time of measurement). Compared to skin, the higher birefringence for tendon was an expected finding because of the greater volume fraction of collagen fibers and the known greater fiber size. Fiber strength, that is, the maximum stress to failure, was shown by others to increase monotonically with maturation to a plateau—the results were influenced by strain-rate and possibly animal species.1, 43 Although the time frame of animal maturation for the mechanical studies only partially overlaps our study, the graphical data have a similar shape and a positive correlation would be expected between tendon strength and fiber birefringence. The major advantage of using LIF spectroscopy (LIFS) in comparison to polarizing microscopy is that the measurements are done on fresh intact tissue with in vivo applications, as we have previously established. It also has the potential for automation and the advantage of including both collagen and elastin, whereas birefringence is a property of collagen alone. For tissue remodeling processes, if a priori structural information is unavailable, sophisticated multivariate analytical approaches would be required to deconvolve the fluorescence spectra due to the overlapping spectra of collagen type III and elastin. That being said, there are numerous tissue remodeling processes that mainly involve collagen types I and III such as wound healing, cerebral saccular, and fusiform aneurysm formation, in which case, the current methodology could be applied. Our overall objective was to explore two optical methods in the study of ECM remodeling during maturation of RTT and skin. LIFS and birefringence are independent indicators for assessing the degree of cross-linking of matrix proteins and both measures were expected to change in concert for the maturation phase being studied. A plot of maximum fluorescence against birefringence showed a significant but moderate correlation, each having separate merits; weighted regression analysis was used to incorporate the nonuniformity in error ( , Fig. 8 ). Table 1Summary of characteristic signature measures (au, arbitrary units).
5.ConclusionThere was a linear increase in during the maturation period (2 to 16 weeks) of the RTT, indicating increased collagen cross-linking. Birefringence also increased, but nonlinearly, reaching a plateau at maturation for both RTT and skin. Although the two methods measure different aspects of ECM remodeling, there was a moderate but significant correlation between the two. FEI spectra obtained from purified protein extracts (elastin and collagen types I and III) enabled us to tease out the presence of the three components of the ECM in RTT. While there is significant overlap between collagen type III and elastin, stepwise regression was successful in tracking protein component changes during RTT maturation. The LIFS approach sets the stage for future applications studying ECM changes during wound healing and cerebral vascular remodeling. ReferencesJ. Kastelic and
E. Baer,
“Deformation in tendon collagen,”
Mechanical Properties of Biological Materials, 34th Symp. of the Society of Experimental Biology, 397
–435 Cambridge University Press, Cambridge (1980). Google Scholar
R. G. Paul,
J. F. Tarlton,
P. P. Purslow,
T. J. Sims,
P. Watkins,
F. Marshall,
M. J. Ferguson, and
A. J. Bailey,
“Biomechanical and biochemical study of a standardized wound healing model,”
Int. J. Biochem. Cell Biol., 29 211
–220
(1997). 1357-2725 Google Scholar
S. A. Wainwright,
W. D. Biggs,
J. D. Currey, and
J. M. Gosline, Mechanical Design in Organisms, 116
–119 Princeton University Press, Princeton (1976). Google Scholar
E. J. Miller and
S. Gay,
“Collagen: an overview,”
Methods Enzymol., 82 3
–41
(1982). 0076-6879 Google Scholar
R. Richards-Kortum and
E. Sevick-Muraca,
“Quantitative optical spectroscopy for tissue diagnosis,”
Annu. Rev. Phys. Chem., 47 555
–606
(1996). https://doi.org/10.1146/annurev.physchem.47.1.555 0066-426X Google Scholar
N. Kollias,
R. Gillies,
M. Moran,
I. E. Kochevar, and
R. R. Anderson,
“Endogenous skin fluorescence includes bands that may serve as quantitative markers of aging and photoaging,”
J. Invest. Dermatol., 111 776
–780
(1998). https://doi.org/10.1046/j.1523-1747.1998.00377.x 0022-202X Google Scholar
H. S. Bennett,
“The microscopical investigation of biological materials with polarized light,”
McLung’s Handbook of Microscopical Technique, 591
–677 Hafner, New York (1950). Google Scholar
L. C. U. Junqueira,
G. Bignolas, and
R. R. Brentani,
“Picrosirius staining plus polarization microscopy, a specific method for collagen detection in tissue sections,”
Histochem. J., 11 447
–455
(1979). 0018-2214 Google Scholar
H. Niven,
E. Baer, and
A. Hiltner,
“Organization of collagen fibers in rat tail tendon at the optical microscope level,”
Coll. Relat. Res., 2 131
–142
(1982). 0174-173X Google Scholar
P. B. Canham,
H. M. Finlay,
J. A. Kiernan, and
G. G. Ferguson,
“Layered structure of saccular aneurysms assessed by collagen birefringence,”
Neurol. Res., 21 618
–626
(1999). 0160-6412 Google Scholar
E. G. Caldini,
N. Caldini,
V. De-Pasquale,
R. Strocchi,
S. Guizzardi,
A. Ruggeri, and
G. S. Montes,
“Distribution of elastic system fibres in the rat tail tendon and its associated sheaths,”
Acta Anat. (Basel), 139 341
–348
(1990). 0001-5180 Google Scholar
R. Strocchi,
L. Leonardi,
S. Guizzardi,
M. Marchini, and
A. Ruggeri,
“Ultrastructural aspect of rat tail tendon sheaths,”
J. Anat., 140 57
–67
(1985). 0021-8782 Google Scholar
H. G. Vogel,
“Influence of maturation and age on mechanical and biochemical parameters of connective tissue of various organs in the rat,”
Connect. Tissue Res., 6 161
–166
(1978). 0300-8207 Google Scholar
J. M. Menter,
G. D. Williamson,
K. Carlyle,
C. L. Moore, and
I. Willis,
“Photochemistry of type I acid-soluble calf skin collagen: dependence on excitation wavelength,”
Photochem. Photobiol., 62 402
–408
(1995). 0031-8655 Google Scholar
C. R. Lovell,
K. A. Smolenski,
V. C. Duance,
N. D. Light,
S. Young, and
M. Dyson,
“Type I and III collagen content and fibre distribution in normal human skin during ageing,”
Br. J. Dermatol., 117 419
–428
(1987). 0007-0963 Google Scholar
H. C. Wulf,
J. Sandby-Moller,
T. Kobayasi, and
R. Gniadecki,
“Skin aging and natural photoprotection,”
Micron, 35 185
–191
(2004). https://doi.org/10.1016/j.micron.2003.11.005 0968-4328 Google Scholar
H. Zeng,
C. MacAulay,
D. I. McLean, and
B. Palcic,
“Spectroscopic and microscopic characteristics of human skin autofluorescence emission,”
Photochem. Photobiol., 61 639
–645
(1995). 0031-8655 Google Scholar
L. Brancaleon,
A. J. Durkin,
J. H. Tu,
G. Menaker,
J. D. Fallon, and
N. Kollias,
“In vivo fluorescence spectroscopy of nonmelanoma skin cancer,”
Photochem. Photobiol., 73 178
–183
(2001). https://doi.org/10.1562/0031-8655(2001)073<0178:IVFSON>2.0.CO;2 0031-8655 Google Scholar
R. P. Mecham and
E. C. Davis,
“Elastic fiber structure and assembly,”
Extracellular Matrix Assembly and Structure, 281
–310 Academic Press, San Diego, CA (1994). Google Scholar
N. Ramanujam,
“Fluorescence spectroscopy in vivo,”
Encyclopedia of Analytical Chemistry, 20
–56 John Wiley & Sons Ltd., Chichester (2000). Google Scholar
A. Christov,
R. M. Korol,
E. Dai,
L. Liu,
H. Guan,
M. A. Bernards,
P. B. Cavers,
D. Susko, and
A. Lucas,
“In vivo optical analysis of quantitative changes in collagen and elastin during arterial remodeling,”
Photochem. Photobiol., 81 457
–466
(2005). https://doi.org/10.1562/2004-03-10-RA-107.1 0031-8655 Google Scholar
K. Arakawa,
K. Isoda,
T. Ito,
K. Nakajima,
T. Shibuya, and
F. Ohsuzu,
“Fluorescence analysis of biochemical constituents identifies atherosclerotic plaque with a thin fibrous cap,”
Arterioscler., Thromb., Vasc. Biol., 22 1002
–1007
(2002). https://doi.org/10.1161/01.ATV.0000017461.79231.3D 1079-5642 Google Scholar
E. J. Gaffney,
R. H. Clarke,
A. R. Lucas, and
J. M. Isner,
“Correlation of fluorescence emission with the plaque content and intimal thickness of atherosclerotic coronary arteries,”
Lasers Surg. Med., 9 215
–228
(1989). 0196-8092 Google Scholar
W. D. Yan,
M. Perk,
A. Chagpar,
Y. Wen,
S. Stratoff,
W. J. Schneider,
B. I. Jugdutt,
J. Tulip, and
A. Lucas,
“Laser-induced fluorescence: III. Quantitative analysis of atherosclerotic plaque content,”
Lasers Surg. Med., 16 164
–178
(1995). 0196-8092 Google Scholar
A. Christov,
E. Dai,
M. Drangova,
L. Liu,
G. Abela,
P. Nash,
G. McFadden, and
A. Lucas,
“Optical detection of triggered atherosclerotic plaque disruption by fluorescence emission analysis,”
Photochem. Photobiol., 72 242
–252
(2000). https://doi.org/10.1562/0031-8655(2000)072<0242:ODOTAP>2.0.CO;2 0031-8655 Google Scholar
G. E. Kochiadakis,
S. I. Chrysostomakis,
M. D. Kalebubas,
G. M. Filippidis,
I. G. Zacharakis,
T. G. Papazoglou, and
P. E. Vardas,
“The role of laser-induced fluorescence in myocardial tissue characterization: an experimental in vitro study,”
Chest, 120 233
–239
(2001). 0012-3692 Google Scholar
L. Marcu,
M. C. Fishbein,
J. I. Maarek, and
W. S. Grundfest,
“Discrimination of human coronary artery atherosclerotic lipid-rich lesions by time-resolved laser-induced fluorescence spectroscopy,”
Arterioscler., Thromb., Vasc. Biol., 21 1244
–1250
(2001). 1079-5642 Google Scholar
J. D. Bancroft and
M. Gamble, Theory and Practice of Histological Techniques, Churchill Livingstone, Edinburgh (2002). Google Scholar
A. J. Rowe,
H. M. Finlay, and
P. B. Canham,
“Collagen biomechanics in cerebral arteries and bifurcations assessed by polarizing microscopy,”
J. Vasc. Res., 40 406
–415
(2003). 1018-1172 Google Scholar
J. Diamant,
A. Keller,
E. Baer,
M. Litt, and
R. G. C. Arridge,
“Collagen; ultrastructure and its relation to mechanical properties as a function of ageing,”
Proc. R. Soc. London, Ser. B, 180 293
–315
(1972). 0962-8452 Google Scholar
L. J. Gathercole and
A. Keller,
“Crimp morphology in the fibre-forming collagens,”
Med. Panam, 11 214
–234
(1991). Google Scholar
H. M. Finlay,
P. Whittaker, and
P. B. Canham,
“Collagen organization in the branching region of human brain arteries,”
Stroke, 29 1595
–1601
(1998). 0039-2499 Google Scholar
H. G. Vogel,
“Species differences of elastic and collagenous tissue—influence of maturation and age,”
Mech. Ageing Dev., 57 15
–24
(1991). 0047-6374 Google Scholar
J. J. Baraga,
R. P. Rava,
P. Taroni,
C. Kittrell,
M. Fitzmaurice, and
M. S. Feld,
“Laser induced fluorescence spectroscopy of normal and atherosclerotic human aorta using excitation,”
Lasers Surg. Med., 10 245
–261
(1990). 0196-8092 Google Scholar
Z. Deyl,
I. Miksik, and
J. Zicha,
“Multicomponent analysis by off-line combination of synchronous fluorescence spectroscopy and capillary electrophoresis of collagen glycation adducts,”
J. Chromatogr., A, 836 161
–171
(1999). 0021-9673 Google Scholar
S. K Majumder,
N. Ghosh,
S. Kataria, and
P. K. Gupta,
“Nonlinear pattern recognition for laser-induced fluorescence diagnosis of cancer,”
Lasers Surg. Med., 33 48
–56
(2003). https://doi.org/10.1002/lsm.10191 0196-8092 Google Scholar
C. Wang,
T. Tsai,
H. Chen,
C. Chen, and
C. Chiang,
“PLS-ANN based classification model for oral submucous fibrosis and oral carcinogenesis,”
Lasers Surg. Med., 32 318
–326
(2003). https://doi.org/10.1002/lsm.10153 0196-8092 Google Scholar
P. R. Moreno and
J. E. Muller,
“Identification of high-risk atherosclerotic plaques: a survey of spectroscopic methods,”
Curr. Opin. Cardiol., 17 638
–647
(2002). 0268-4705 Google Scholar
Y. Wu,
P. Xi,
J. Y. Qu,
T-H. Cheung, and
M-Y. Yu,
“Depth-resolved fluorescence spectroscopy reveals layered structure of tissue,”
Opt. Express, 12 3218
–3223
(2004). https://doi.org/10.1364/OPEX.12.003218 1094-4087 Google Scholar
L. Marcu,
W. Grundfest, and
J. I. Maarek,
“Photobleaching of arterial fluorescent compounds: characterization of elastin, collagen and cholesterol time-resolved spectra during prolonged ultraviolet irradiation,”
Photochem. Photobiol., 69 713
–721
(1999). https://doi.org/10.1562/0031-8655(1999)069<0713:POAFCC>2.3.CO;2 0031-8655 Google Scholar
C. J. Doillon,
M. G. Dunn,
E. Bender, and
F. H. Silver,
“Collagen fiber formation in repair tissue: development of strength and toughness,”
Coll. Relat. Res., 5 481
–492
(1985). 0174-173X Google Scholar
M. Wolman and
T. Gillman,
“A polarized light study of collagen in dermal wound healing,”
Br. J. Exp. Pathol., 53 85
–89
(1972). 0007-1021 Google Scholar
R. C. Haut,
“Age-dependent influence of strain rate on the tensile failure of rat-tail tendon,”
J. Biomech. Eng., 105 296
–299
(1983). 0148-0731 Google Scholar
|
|||||||||||||||||||||||||||||||||||||||||||||||||||||||||||||||||||||||||||||