|
|
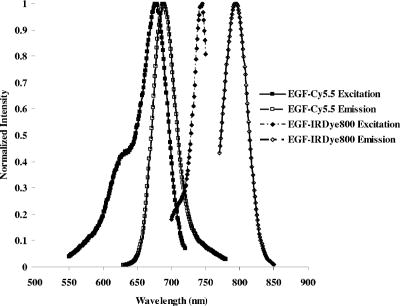
1.IntroductionMolecular imaging with fluorescently labeled targeted probes may provide an optimal means of detecting disease markers in vivo owing to (1) the increased signal that results from the ability to repeatedly excite fluorophores in vivo by surface illumination and (2) the photostability of organic fluorophores, providing photon imaging events long after administration. Using a dual-labeled near-IR (NIR) excitable fluorescent and nuclear labeled integrin-targeting imaging agent, we recently demonstrated detection of -positive human melanoma in xenografts with enhanced signal-to-noise ratio (SNR) of planar optical images over gamma scintigraphy, even though comparable tumor-to-background ratios (TBRs) were obtained for both optical and nuclear images of the same animals.1, 2 This result may be due to the fact that while radiotracers create a maximum of one imaging photon event per radiotracer molecule, a fluorophore with a nanosecond fluorescent lifetime can be reactivated to produce a theoretical limit of imagable photon events per fluorescent molecule per second. Yet, despite the enhanced fluorescent photon count, the sensitivity of fluorescence-enhanced optical imaging can deteriorate dramatically owing to inefficient rejection of backscattered excitation light3 and the presence of tissue autofluorescence. The use of NIR-excitable fluorescent dyes (with excitation at or greater) with a sufficient Stokes shift (of or greater) to enable efficient rejection of backscattered excitation light is optimal for preventing autofluorescence and promoting deep tissue penetration for both preclinical small animal imaging and clinical trials. However, typically small animal fluorescence imaging presented in the literature employs the NHS ester of a visible dye, Cy5.5, for conjugation to targeting moieties. Typically, Cy5.5 is excited at and its fluorescence is collected at . Another convenient dye, IRDye® 800CW, is also available in NHS ester form, but as a NIR dye, it can be excited at and fluorescence collected at . In this paper, we critically compare the performance of small animal imaging using these two dyes conjugated to epidermal growth factor (EGF) to highlight the importance of using NIR-excitable agents in molecular, optical imaging. The EGF receptor (EGFr) is a transmembrane glycoprotein, which is overexpressed in many solid tumors. While there are several studies in the literature that use labeled EGF to target cancer, most imaging agents are radiolabeled with indium-111 (Refs. 4, 5, 6, 7) or technetium-99m (Ref. 8). EGFr has also been targeted9 in optical imaging studies using Cy5.5. In fact, the majority of optical imaging probe designs are based on Cy5.5-conjugated compounds and report promising in vivo results. 3, 9, 10, 11, 12, 13, 14, 15, 16, 17, 18 However, significant autofluorescence from red wavelength excitation can significantly decrease the target to background ratio in whole body imaging.13 Here, we report that by using a NIR-excitable agent, the TBR, a figure of merit used to assess molecular specificity in small animal imaging, is enhanced. We also show with immunohistochemistry (IHC) that diagnostic imaging with EGF results in phosphorylation of EGFr and activation of the signaling pathways that could cause deleterious effects. 2.Materials and MethodsEGF from mouse submaxillary glands was purchased from Invitrogen (Carlsbad, California) and resuspended at in sodium bicarbonate buffer at pH 8.5. Cy5.5-NHS ester was obtained from GE Healthcare, formerly Amersham Pharmacia Biotech (Piscataway, New Jersey), and resuspended in DMSO at . IRDye® 800CW-NHS ester was obtained from Li-Cor Biosciences (Lincoln, Nebraska) and resuspended in methanol at . EGF was reacted with Cy5.5-NHS or IRDye® 800CW-NHS in a 1:5 protein to dye molar ratio for at room temperature with shaking. Free dye was removed by size exclusion chromatography on a 10DG desalting column (Biorad, Hercules, California). Excitation/emission spectra of EGF-Cy5.5 and EGF-IRDye® 800CW were measured using a Fluorolog Tau3 frequency-domain spectrofluorometer (HORIBA Jobin Yvon Inc., Edison, New Jersey) at wavelength increments. Human breast cancer cells that express high levels of EGFr (MDA-MB-468) and human breast cancer cells that do not express EGFr (MDA-MB-435) were purchased from American Type Culture Collection (Manassas, Virginia). The cells were cultured in Dulbecco modified Eagle medium F12 (DMEM/F12; Invitrogen, Carlsbad, California) with 10% fetal bovine serum (FBS) (Hyclone, Logan, Utah) in a humidified incubator maintained at with 5% . When the cells reached 95% confluence, they were treated with trypsin, washed with phosphate-buffered saline (PBS), and resuspended at cells per PBS for inoculation. Four-week-old nude mice Hsd:Athymic Nude- were purchased from Harlan (Indianapolis, Indiana). The human breast cancer cell lines MDA-MB-468 (EGFr positive) and MDA-MB-435 (EGFr negative) were subcutaneously injected in the separate hind limbs of each animal. Each inoculation site received cells and tumors were allowed to develop for to reach diameters of . For imaging, dye equivalence of Cy5.5-NHS, EGF-Cy5.5, IRDye® 800CW-NHS, or EGF-IRDye® 800CW was injected intravenously (i.v.) into the tail vein of mice. A dye equivalence amount is less than was used in previous studies.9 For in vivo blocking studies, of C225 was injected i.v. prior to the injection of EGF-IRDye® 800CW. Mice were imaged for approximately after injection and then at 24 and after injection. In vivo fluorescence-based optical imaging was accomplished by illuminating the animal with light from a laser diode ( , , , model HL6501MG, Hitachi, Eatontown, New Jersey, and , for light DL7140-201, Sanyo, Richmond, Indiana) expanded to a circular area approximately in diameter. The reemitted fluorescent light was collected by an image intensifier (model FS9910C, ITT Night Vision, Roanoke, Virginia) lens coupled to a charge-coupled device camera (model CH350, Photometrics, Tucson, Arizona). In the wavelength range of interest , the sensitivity of the image intensifier is essentially constant. A detailed description of the in vivo optical fluorescence imaging system used in this study was previously reported.9 Filter sets used in this study included a bandpass filter [(1) CVI, F10-710.0-4-2.00 with a center wavelength and optical density at for Cy5.5 or (2) Andover ANDV8483 with a center wavelength and at for IRDye® 800CW] as well as a holographic filter [(1) Kaiser HSP 660.0 with for excitation of Cy 5.5 and (2) HSP 785.0 with for excitation of IRDye® 800CW] to reject backscattered and reflected excitation light. Image acquisition was accomplished using V++ software (Digital Optics, Auckland, New Zealand). Data processing and analysis were accomplished using MATLAB software (The MathWorks, Inc., Natick, Massachusetts). The integration time for each image was . Whole-body images were taken at after the injection. At after fluorescent agent injection, mice were sacrificed and organs were excised for optical imaging, histology, and pathology. For quantitative comparison, ratios of fluorescent intensities in regions of interest (ROIs) corresponding to the tumor and normal tissue regions were determined. Pathology and immunohistochemical staining were performed on slides prepared from frozen tissues. The slides were fixed and incubated with anti-EGF-350, anti-EGFr-546, and anti-EGFr-phos-647 dye conjugated antibodies (Alexa Fluor Dye 350, 546, and 647 from Invitrogen, Carlsbad, California, and antibodies from Novus Biologicals, Littleton, Colorado) at room temperature for . The slides were washed three times in PBS, stained with of Sytox Green for , and imaged with a Leica fluorescent microscope equipped with a xenon lamp and fluorescent filters. Then the slide was hematoxylin and eosis (H&E) stained to confirm the colocalization of the EGF-IRDye® 800CW, anti-EGF antibody, and the EGFr positive cancer cells to demonstrate stability and specificity of the dye conjugate. Statistical analysis was performed using SAS software version 9.1 (SAS Institute Inc., Cary, North Carolina) for Microsoft Windows. The data was analyzed using one-way analysis of variance (ANOVA) and the general linear models. The significance level was set at 0.05, and statistical analysis of TBR was performed on images obtained after injection. Typically, TBR reflects specific and nonspecific uptake, where nonspecific uptake may arise from differences in transport (i.e., vascular volume) as well binding with nontargets. In this study, the TBR was calculated as To determine the tumor region intensity, the area of pixels corresponding to the tumor location was identified from the white light image and the total fluorescence intensity associated with the region was computed. The background region intensity was determined by taking the same number and arrangement of pixels on the contralateral side of the animal and computing the total fluorescence intensity. The tumor and background region intensities were computed in animals administered EGF-IRDye® 800CW and EGF-Cy5.5. Free-dye values were taken from images of animals administered with free IRDye® 800CW and Cy5.5, averaged, and the mean value was subtracted from the ratio of tumor to background region intensities. Defined in this manner, the TBR eliminates the effect of nonspecific dye binding and demonstrates true target specificity.19 To compare levels of autofluroescence using a ratio term, we compute the photon counts in a target region and divide by that in a selected background region. To avoid confusion with TBR defined in Eq. 1, this ratio, termed the “regional ratio” (RR), was computed as Since the regions may have different associated areas, the photon counts were normalized by their areas or the number of pixels in the selected region. This ratio was also used for comparisons where the areas of the two ROIs differ such as for excised tissues.3.Results3.1.Comparison of Excitation and Emission Wavelengths of EGF ConjugatesThe excitation and emission profiles of EGF-Cy5.5 and EGF-IRDye® 800CW in Fig. 1 show that the peak excitation/emission wavelength for the Cy5.5 conjugate is and for the IRDye® 800CW conjugate is . The Stokes shift for EGF-Cy5.5 is and EGF-IRDye® 800CW is . 3.2.In Vivo ImagingFigure 2 shows a typical whole body fluorescence after administration (top row) and excised organ fluorescent images obtained after administration (bottom row) overlaid on white light images from animals injected with EGF-IRDye® 800CW [Figs. 2a and 2c] and monoclonal antibody C225 followed by EGF-IRDye® 800CW [Figs. 2b and 2d]. The images show that the signal intensity is significantly higher in the receptor-positive tumor region [Fig. 2a (hind limb), MDA-MB-468] with EGF-IRDye® 800CW than in the receptor-negative tumor region [Fig. 2a (front limb), MDA-MB-435]. In addition, the fluorescence intensity in the whole body image of the EGFr-positive tumor bearing animal was reduced when preinjected with C225 [Fig. 2b, MDA-MB-468], but the excised tumor appeared slightly fluorescent in the ex vivo images [Fig. 2d, MDA-MB-468]. The ratio of fluorescent intensities of the excised MDA 468 tumor and the muscle were compared using Eq. 2, resulting in RR values of 2.60 with C225 blocking [Fig. 2d] and 4.99 without blocking [Fig. 2c]. These ex vivo fluorescent intensity results show reduction of fluorescence intensity with preadministration of C225 that is consistent with the in vivo images. Fig. 2Whole-body and organ imaging results of animals injected with either EGF-IRDye® 800CW or monoclonal antibody C225 followed by EGF-IRDye® 800CW, at equivalent doses of IRDye® 800CW. The upper row shows the whole-body fluorescence overlaid on white light images and the lower row shows the excised organ fluorescence overlaid on white light images. The signal intensity is significantly higher in the receptor-positive xenograft (MDA-MB-468) than the receptor-negative xenograft (MDA-MB-435) with targeted conjugate (A) (hind limb MDA-MB-468, front limb MDA-MB-435) and (C). Signals in the receptor-positive xenograft (MDA-MB-468) are significantly reduced when preinjected with C225 antibody (B) and (D).  Figure 2 also implies that EGF-IRDye® 800CW binds specifically to the EGFr because the binding can be almost completely blocked with preadministration of C225, an antibody specific to the EGFr. The small amount of binding that is still present could be due to the size difference in the two molecules, with EGF being much smaller than C225 , and thus more able to penetrate into the tumor tissue. Figure 3 shows the pathological and IHC results for receptor-positive tumor (MDA-MB-468) tissue injected with either EGF-IRDye® 800CW [Figs. 3A, 3D, 3G, 3J], IRDye® 800CW [Figs. 3B, 3E, 3H, 3K], or preadministration of C225, an antibody against EGFr, followed by EGF-IRDye® 800CW [Figs. 3C, 3F, 3I, 3L]. The H&E stains show tumor morphology and the anti-EGF antibody IHC shows the signal intensity difference arising from targeted and nontargeted IRDye® 800CW. The anti-EGFr antibody IHC represents the receptor density in the tumors and the anti-EGFr-phos shows the amount of phosphorylated or activated receptor. The red signals represent the antibodies binding to their ligands. Tumor presence is shown by H&E stain [Figs. 3A, 3B, 3C]. Anti-EGF antibody staining was significantly higher in the tumor tissue of animals injected with EGF-IRDye® 800CW [Figs. 3D, 3F] than of those injected with IRDye® 800CW [Fig. 3E], confirming that our in vivo imaging signals are from EGF-IRDye® 800CW. Similar results were obtained for anti-EGF staining of tumor tissues from animals injected with EGF-Cy5.5 and Cy5.5 (data not shown). Preadministration of C225 did not completely block the binding of EGF-IRDye® 800CW to the EGFr positive tumor [Fig. 3(F)]. EGFr expression was upregulated in all the mice that received the EGF targeted dye [Figs. 3G, 3I], but not in the mice that received the untargeted dye [Fig. 3H]. Activation of the EGFr was seen with EGF-IRDye® 800CW [Fig. 3J] but not with free dye [Fig. 3K] or preadministration of C225 followed by targeted dye [Fig. 3L]. The mice injected with EGF-IRDye® 800CW showed an increase in EGFr expression as well as the amount of activated EGFr present on the cells surface when compared with the mice that received unconjugated IRDye® 800CW, thus these effects were not due to the dye itself. A lesser effect was seen in mice that were preadministered C225, suggesting that when C225 blocked the EGF-IRDye® 800CW from binding, it also at least partially blocked the upregulation and activation of EGFr. Alternatively, the upregulation and activation of EGFr could be due to the small amount of EGF-IRDye® 800CW binding after the preadministration with C225. Fig. 3Pathological H&E and IHC staining of tumor tissues. H&E stain confirms tumor regions (A), (B), and (C) either injected with EGF-IRDye® 800CW (A), (D), (G), and (J), IRDye® 800CW (B), (E), (H), and (K), or preadministration of C225 followed by EGF-IRDye® 800CW (C), (F), (I), and (L). IHC staining using anti-EGF antibody (D), (E), and (F) demonstrates that significantly higher EGF concentration in EGF-IRDye® 800CW injected tumor tissue [red signal in (D)] than IRDye® 800CW injected tumor tissue (E) or the C225, then EGF-IRDye® 800CW injected tumor tissue [red signal in (F)]. IHC staining with the anti-EGFr antibody shows upregulation of the EGFr in animals receiving EGF-IRDye® 800CW alone [red signal in (G)] and after C225 administration [red signal in (I)], while free dye alone does not upregulate the receptor (H). Red signals also show activation of the EGFr in the mice injected with EGF-IRDye® 800CW alone (J) and after C225 blocking (L) but not in the case of IRDye® 800CW alone. Green signals represent cell nuclei. 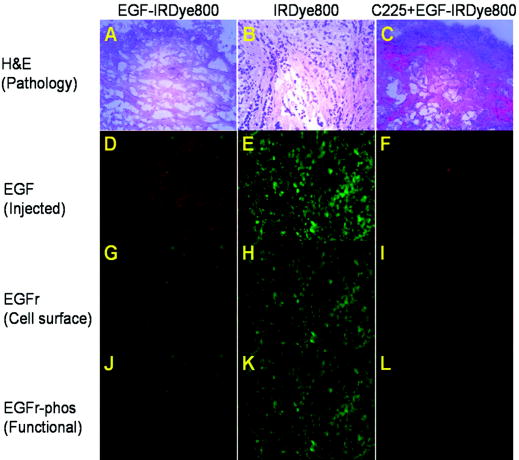 Note that the cell density, reflected by the Sytox Green staining, seems to be reduced in the tissue slices obtained from animals after administration of EGF-IRDye® 800CW with and without preadministration of C225 in comparison to those obtained from animals administered IRDye® 800CW alone. We observed this trend in all tissue slices involving administration of the EGF ligand and note that one possible explanation taken from the literature is a report of changing cell shape and density following calcium signaling.20 Regardless, even with the apparent reduction of cell density in tissue slices, IHC shows that EGFr and EGFr-phos are elevated in these tissue slices, suggesting upregulation and activation of EGFr. 3.3.Influence of Fluorophore on TBRFigure 4 illustrates a side-by-side comparison of conjugate free, unmanipulated animals illuminated with [Fig. 4B] and [Fig. 4B] light with a vial of of either EGF-IRDye® 800CW or EGF-Cy5.5 for reference. To provide a comparative basis, the ratio of fluorescence intensity from the vial containing dye to the autofluorescence from the whole animal using Eq. 2 resulted in RR values of 6.06 for IRDye® 800 CW and 2.14 for Cy5.5. Clearly, the autofluorescent signals in the NIR image [Fig. 4A] are significantly lower than those arising in the red fluorescent images [Fig. 4B], causing an increase in the ratio. Figures 4C, 4D show animals bearing EGFr-positive MDA-MB-468 xenograft injected with EGF-IRDye® 800CW and EGF-Cy5.5, respectively. The images show more efficient detection of tumor with the NIR imaging conjugate [Fig. 4C] than when using the red imaging conjugate [Fig. 4D]. The ratios of fluorescent intensities were compared using Eq. 1, resulting in higher TBR values for EGF-IRDye® 800CW than for EGF-Cy5.5 . Figure 5 reports the values of TBR for the various animal groups and suggests that use of a NIR rather than a red excitable fluorophore can report targeting more efficiently due to a reduction of background autofluorescence. Fig. 4Comparison of autofluorescence and TBR in two different dye conjugates. Upper row shows the images of mice that have not been injected with any dye next to a tube containing of (A) EGF-IRDye® 800CW or (B) EGF-Cy5.5 in of saline. The autofluorescence in the NIR image (A) is significantly lower than in the red (B) fluorescent images. The lower row shows the images of MDA-MB-468 tumor bearing mice after injection of of (C) EGF-IRDye® 800CW or (D) EGF-Cy5.5. NIR dye conjugate (C) has significantly higher TBR than red fluorescent dye (D).  Fig. 5Statistical comparison of TBRs of IRDye® 800CW and Cy5.5 dye conjugates after injection into MDA-MB-468 (with high expression of EGFr) or MDA-MB-435 (with low expression of EGFr) xenograft tumors. The TBR of EGF-IRDye® 800CW was significantly higher than all other groups . The TBR of EGF-Cy5.5 was significantly higher than the predosed animals (MDA-MB-468, C225, EGF-IRDye® 800CW, ), but the difference was not as significant between EGF-Cy5.5 and free IRDye® 800CW (MDA-MB-468, IRDye® 800CW, ), EGF-IRDye® 800CW on EGFr-negative cells (MDA-MB-435, EGF-IRDye® 800CW, ), or free Cy5.5 dye (MDA-MB-468, Cy5.5, ). 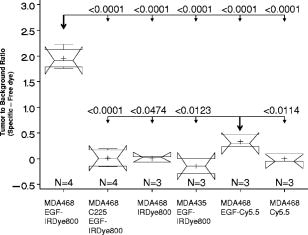 Table 1Comparison of dye properties, as reported by Amersham and Licor.21
Table 1 compares the quantum efficiencies and extinction coefficients for Cy5.5 and IRDye® 800CW. The extinction coefficients are comparable while the quantum efficiency of the Cy5.5 dye is higher than that of IRDye® 800CW. Therefore there is a bias against the IRDye® 800CW in measuring intensity, suggesting that autofluorescence is a dominating factor in reducing the Cy5.5 TBR. Note the significance of correcting for nonspecific uptake in TBR. Owing to the leakiness and density of tumor vessels, one could imagine that nonspecific uptake would result in the ratio of tumor to background intensity to be greater than 1, as previously reported in several studies including our own.2, 9, 22 Indeed, in the current study, the ratio of tumor to background intensities as defined in Eq. 2 [i.e., the first term of the left-hand side of Eq. 1] for unconjugated Cy5.5 and IRDye® 800CW dyes was found to be and , respectively, and statistically different . When defined in our study as specific TBR defined by Eq. 1, the free and nonspecific Cy5.5 and IRDye® 800CW both have a zero mean TBR, as shown in Fig. 5. 3.4.Statistical Comparison of TBRThe statistical comparison of specific TBR between groups of animals imaged is shown in Fig. 5. Notched box-and-whisker plots are used to illustrate the comparison across all the groups. The endpoints of the notches are located at the median plus and minus , where IQR is the interquartile range, and is the group size. The medians (central lines) of two box-and-whisker plots are significantly different at approximately the 0.05 level if the corresponding notches do not overlap.23 The “folding effect” happens when the endpoint of a notch is beyond its corresponding quartile. This typically occurs when the group size is small. The statistical results demonstrate that EGF conjugated with IRDye® 800CW in the receptor positive MDA-MB-468 xenograft has superior specific TBR compared to that from EGF conjugated with Cy5.5 in the xenografts of the same tumor line . Indeed the specific TBR in MDA-MB-468 xenografts was increased by a factor of 5.8 when the Cy5.5 was replaced by IRDye® 800CW. The TBR results for the EGF-Cy5.5 imaging agent in MDA-MB-468 are significantly higher than that arising from the nonspecific IRDye® 800CW or Cy5.5 dyes. Not surprisingly, the TBR results for the EGF-Cy5.5 imaging agent in MDA-MB-468 is significantly higher than that arising after preinjection with C225, as well as that from receptor-negative tumor injected with target specific agent (MDA-MB-435, EGF-IRDye® 800CW). The results reproduce our numerical findings of RR for EGF-Cy5.5. In our prior work, since we were not concerned with comparison of imaging agents, we computed our TBR strictly as a ratio of tumor to background intensities, similar to the RR defined in Eq. 2, instead of accounting for the nonspecific binding as done herein using Eq. 1. Consequently, the values of TBR in this study are lower than those previously reported for EGF-Cy5.5. Most importantly, Fig. 5 shows significantly lower TBRs arising from red-imaging conjugates than from NIR-imaging conjugates, and greater differences of TBRs between receptor-positive and -negative xenografts arising from NIR-imaging conjugates than red-excitable conjugates. These results are probably due to the decreased autofluorescence at NIR as compared to red wavelength excitation. Our comparisons demonstrate that TBR can be dramatically increased by simply shifting the optical reporter dye to the NIR excitation range. 4.DiscussionIn diagnostic cancer imaging, TBR is a critical figure of merit used to assess (1) the efficiency of targeted, experimental molecular imaging agents in small animals as well as (2) the presence of targeting disease markers when translated into the clinic. In contrast to nuclear imaging and bioluminescence, an in vivo activation source in the form of tissue-propagating excitation illumination is required for fluorescence optical imaging. The “background” in fluorescence optical imaging results from (1) excitation of endogenous compounds (i.e., autofluorescence), (2) nonspecific binding, and (3) scattered excitation light leakage through optical filters and the resulting erroneous collection as fluorescent light.3 In this paper, we show that the TBRs are significantly different for two imaging conjugates that have (1) identical disease targeting moieties; (2) similar targeting capabilities, as verified by IHC; but (3) different conjugated fluorophore. In our studies, the optical densities of holographic and interference filters at the respective excitation wavelengths are similar, hence differences in TBR must arise either from differences in autofluorescence levels or differences in nonspecific binding. In the case of the EGF-Cy5.5 imaging conjugate that is excited at the red excitation wavelength, a high background owing to autofluorescence predominates, which could explain the reduction of TBR and the low magnitude of TBR change following preinjection of C225 to block the binding of the imaging conjugate. Conversely, on using the IRDye® 800CW fluorophore with a NIR excitation wavelength, a low background results and an increase in TBR and in the magnitude of TBR change following preinjection of C225 occurs. Since NIR excitation has lower tissue autofluorescence than red excitation, the choice of the fluorophore can dramatically impact the figure of merit used to assess targeting agents for optical imaging. Another consistent explanation of our results may be the differing, nonspecific binding of the imaging conjugates. While IHC shows that there are comparable targeting capabilities of the EGF peptide conjugated to either Cy5.5 or IRDye® 800CW, there may be some differences in nonspecific binding of the dye molecules themselves. Indeed, we do find the IRDye® 800CW to be less “sticky” to cells than Cy5.5, suggesting that the EGF-Cy5.5 may itself have less specificity and hence a lower TBR than the EGF-IRDye® 800CW. Since we have removed contributions due to nonspecific binding in our calculation of TBR, the differences in TBR between the two otherwise identical imaging agents must be due to the fluorescent dye. Since it is a ratio, differences in instrument performance at the different excitation/emission wavelengths used and in the quantum efficiency of the fluorophores should not impact TBR. Therefore, our comparisons demonstrate that TBR can be dramatically increased by simply shifting the optical reporter dye to one with an NIR excitation. Optical imaging agents can be delivered in very small amounts, of the order of . Our results shown in Figs. 2 and 3 illustrate that low diagnostic doses of EGF-IRDye® 800CW are able to report change in EGFr availability caused by preadministration of C225. However, even at a low concentration, a targeting molecule can have strong downstream biological effects if a signaling cascade is activated. The delivery of the EGF-conjugated dye into mice with or without EGFr preblocking resulted in upregulation of EGFr expression that was not seen in the mice that received free dye. In addition to the increased number of EGFr on the cell surface, the EGF-conjugated dye alone caused more activation of the EGFr than in the C225-blocked mice. EGF binds to EGFr in the receptor binding site, which causes receptor dimerization and activation, while C225 binds to a different part of the EGFr, blocking the binding site and preventing receptor dimerization. The upregulation and activation of EGFr has been reported as an indicator of poor prognosis in many cancers, including breast cancer.24, 25, 26 Our work confirms that while C225 and EGF target the same receptor, they have different biological effects on the cells. The choice of a targeting molecule with consideration to its downstream effects is especially important in the case of cancer where upregulation and activation of growth receptors can lead to a more aggressive disease. The results shown here focus on TBR as a figure of merit determined from simple, fluorescent planar imaging of subcutaneously grown tumors. Since most drug studies are conducted with subcutaneous tumor models, assessment of TBR from simple planar imaging is convenient and efficient. Here, we show that the impact of the fluorophore can dramatically impact the figure of merit used to assess targeting capacity. While tomography is under development in our laboratory as well as in many others, quantification of tissue concentration from tomography has yet to be validated with dual-labeled agents2 and can be expected to improve with the use of NIR fluorophores. While bioluminescence does not employ an excitation source, it nonetheless has a limited number of imaging photon events that is governed by the diffusional encounter of enzyme and exogenous substrate in the presence of oxygen and ATP. Hence, despite the drawback of background in fluorescence optical imaging, its potential for a higher SNR over both bioluminescence and nuclear imaging2 offers unique abilities for dynamic imaging and, if excitation light leakage can be appropriately controlled, exquisite sensitivity. Although there are many molecules that target upregulated receptors found on cancer cells, they must be screened carefully and their downstream effects fully evaluated before they are used for in vivo cancer targeting. Thus, a careful choice of an NIR-excitable fluorophore and a targeting molecule represent the first steps in the design and development of optical imaging agents for cancer diagnostics. AcknowledgmentsThe study reported here was supported in part by the National Institutes of Health grants R01 EB003132 (Sevick) and R01 EB005173 (Hirschi), the Susan G. Komen Breast Cancer Foundation BCTR 0504036 (Barry), and the Department of Radiology at Baylor College of Medicine ReferencesW. Wang,
Q. Wu,
M. Pasuelo,
J. S. McMurray, and
C. Li,
“Probing for integrin alpha v beta3 binding of RGD peptides using fluorescence polarization,”
Bioconjugate Chem., 16 729
–734
(2005). 1043-1802 Google Scholar
J. P. Houston,
S. Ke,
W. Wang,
C. Li, and
E. M. Sevick-Muraca,
“Quality analysis of in vivo near-infrared fluorescence and conventional gamma images acquired using a dual-labeled tumor-targeting probe,”
J. Biomed. Opt., 10 054010
(2005). https://doi.org/10.1117/1.2114748 1083-3668 Google Scholar
S. Kwon,
S. Ke,
J. P. Houston,
W. Wang,
Q. Wu,
C. Li, and
E. M. Sevick-Muraca,
“Imaging dose-dependent pharmacokinetics of an RGD-fluorescent dye conjugate targeted to alpha v beta 3 receptor expressed in Kaposi’s sarcoma,”
Mol. Imaging, 4 75
–87
(2005). 1535-3508 Google Scholar
X. Wen,
Q. P. Wu,
S. Ke,
L. Ellis,
C. Charnsangavej, A. S. Delpassand, S. Wallace, and
C. Li,
“Conjugation with (111)In-DTPA-poly(ethylene glycol) improves imaging of anti-EGF receptor antibody C225,”
J. Nucl. Med., 42 1530
–1537
(2001). 0161-5505 Google Scholar
C. R. Divgi,
S. Welt,
M. Kris,
F. X. Real,
S. D. Yeh,
R. Gralla,
B. Merchant,
S. Schweighart,
M. Unger,
S. M. Larson,
“Phase I and imaging trial of indium 111-labeled anti-epidermal growth factor receptor monoclonal antibody 225 in patients with squamous cell lung carcinoma,”
J. Natl. Cancer Inst., 83 97
–104
(1991). 0027-8874 Google Scholar
A. Goldenberg,
H. Masui,
C. Divgi,
H. Kamrath,
K. Pentlow, and
J. Mendelsohn,
“Imaging of human tumor xenografts with an indium-111-labeled anti-epidermal growth factor receptor monoclonal antibody,”
J. Natl. Cancer Inst., 81 1616
–1625
(1989). 0027-8874 Google Scholar
R. M. Reilly,
R. Kiarash,
J. Sandhu,
Y. W. Lee,
R. G. Cameron,
A. Hendler,
K. Vallis, and
J. Gariepy,
“A comparison of EGF and MAb 528 labeled with 111In for imaging human breast cancer,”
J. Nucl. Med., 41 903
–911
(2000). 0161-5505 Google Scholar
M. H. Babaei,
Y. Almqvist,
A. Orlova,
M. Shafii,
K. Kairemo, and
V. Tolmachev,
“[99mTc] HYNIC-hEGF, a potential agent for imaging of EGF receptors in vivo: preparation and pre-clinical evaluation,”
Oncol. Rep., 13 1169
–1175
(2005). 1021-335X Google Scholar
S. Ke,
X. Wen,
M. Gurfinkel,
C. Charnsangavej,
S. Wallace,
E. M. Sevick-Muraca, and
C. Li,
“Near-infrared optical imaging of epidermal growth factor receptor in breast cancer xenografts,”
Cancer Res., 63 7870
–7875
(2003). 0008-5472 Google Scholar
D. R. Vera,
D. J. Hall,
C. K. Hoh,
P. Gallant,
L. M. McIntosh, R. F. Mattrey,
“Cy5.5-DTPA-galactosyl-dextran: a fluorescent probe for in vivo measurement of receptor biochemistry,”
Nucl. Med. Biol., 32 687
–693
(2005). 0969-8051 Google Scholar
O. Veiseh,
C. Sun,
J. Gunn,
N. Kohler,
P. Gabikian,
D. Lee, N. Bhattarai, R. Ellenbogen,
R. Sze,
A. Hallahan,
J. Olson, and
M. Zhang,
“Optical and MRI multifunctional nanoprobe for targeting gliomas,”
Nano Lett., 5 1003
–1008
(2005). 1530-6984 Google Scholar
Z. Medarova,
W. Pham,
Y. Kim,
G. Dai, and
A. Moore,
“In vivo imaging of tumor response to therapy using a dual-modality imaging strategy,”
Int. J. Cancer, 118 2796
–2802
(2006). 0020-7136 Google Scholar
Z. Cheng,
Y. Wu,
Z. Xiong,
S. S. Gambhir, and
X. Chen,
“Near-infrared fluorescent RGD peptides for optical imaging of integrin alphavbeta3 expression in living mice,”
Bioconjugate Chem., 16 1433
–1441
(2005). 1043-1802 Google Scholar
A. Petrovsky,
E. Schellenberger,
L. Josephson,
R. Weissleder, A. Bogdanov Jr.,
“Near-infrared fluorescent imaging of tumor apoptosis,”
Cancer Res., 63 1936
–1942
(2003). 0008-5472 Google Scholar
W. Wang,
S. Ke,
Q. Wu,
C. Charnsangavej,
M. Gurfinkel, J. G. Gelovani, J. L. Abbruzzese,
E. M. Sevick-Muraca, and
C. Li,
“Near-infrared optical imaging of integrin alphavbeta3 in human tumor xenografts,”
Mol. Imaging, 3 343
–351
(2004). https://doi.org/10.1162/1535350042973481 1535-3508 Google Scholar
I. Hilger,
Y. Leistner,
A. Berndt,
C. Fritsche,
K. M. Haas, H. Kosmehl, W. A. Kaiser,
“Near-infrared fluorescence imaging of HER-2 protein overexpression in tumour cells,”
Eur. Radiol., 14 1124
–1129
(2004). 0938-7994 Google Scholar
A. Hansch,
O. Frey,
D. Sauner,
I. Hilger,
M. Haas,
A. Malich,
R. Brauer, and
W. A. Kaiser,
“In vivo imaging of experimental arthritis with near-infrared fluorescence,”
Arthritis Rheum., 50 961
–967
(2004). 0004-3591 Google Scholar
A. Hansch,
O. Frey,
I. Hilger,
D. Sauner,
M. Haas,
D. Schmidt, C. Kurrat,
M. Gajda,
A. Malich,
R. Brauer, and
W. A. Kaiser,
“Diagnosis of arthritis using near-infrared fluorochrome Cy5.5,”
Invest. Radiol., 39 626
–632
(2004). https://doi.org/10.1097/01.rli.0000139008.04288.fd 0020-9996 Google Scholar
R. G. Blasberg,
“Imaging molecular targets: biological determinants of contrast and noise,”
(2005). Google Scholar
T. M. Moore,
G. H. Brough,
P. Babal,
J. J. Kelly,
M. Li, and
T. Stevens,
“Store-operated calcium entry promotes shape change in pulmonary endothelial cells expressing Trp1,”
Am. J. Physiol., 275 L574
–582
(1998). 0002-9513 Google Scholar
G. E. Amersham, Google Scholar
J. S. Reynolds,
T. L. Troy,
R. H. Mayer,
A. B. Thompson,
D. J. Waters,
K. K. Cornell,
P. W. Snyder, and
E. M. Sevick-Muraca,
“Imaging of spontaneous canine mammary tumors using fluorescent contrast agents,”
Photochem. Photobiol., 70 87
–94
(1999). https://doi.org/10.1562/0031-8655(1999)070<0087:IOSCMT>2.3.CO;2 0031-8655 Google Scholar
R. McGill,
J. W. Tukey and
W. A. Larsen,
“Variations of box plots,”
Am. Stat., 32 12
–16
(1978). https://doi.org/10.2307/2683468 0003-1305 Google Scholar
J. R. Sainsbury,
J. R. Farndon,
G. K. Needham,
A. J. Malcolm, and
A. L. Harris,
“Epidermal-growth-factor receptor status as predictor of early recurrence of and death from breast cancer,”
Lancet, 1 1398
–1402
(1987). 0140-6736 Google Scholar
K. Khazaie,
V. Schirrmacher, and
R. B. Lichtner,
“EGF receptor in neoplasia and metastasis,”
Cancer Metastasis Rev., 12 255
–274
(1993). 0891-9992 Google Scholar
S. B. Kondapaka,
R. Fridman, and
K. B. Reddy,
“Epidermal growth factor and amphiregulin up-regulate matrix metalloproteinase-9 (MMP-9) in human breast cancer cells,”
Int. J. Cancer, 70 722
–726
(1997). 0020-7136 Google Scholar
|