|
|
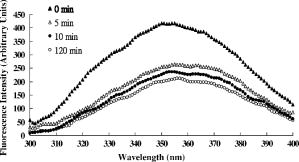
1.IntroductionNative pentameric C-reactive protein (pCRP), first discovered by Tillett and Francis1 in 1930, is a typical acute-phase protein whose synthesis is rapidly upregulated, principally in hepatocytes. In healthy young volunteers, the average concentration of pCRP is2 about ; on stimulation, the values may increase above within and peaks3 as much as 1000-fold at . When the stimulus is removed, the circulation level of pCRP rapidly drops and maintains at the basal level. The sole determination of pCRP concentration is the intensity of inflammation process, and pCRP concentration provides a very useful nonspecific tool for screening inflammation. A pCRP molecule [molecular weight (MW) ] is composed of five identical noncovalently bound monomer subunits (MW ), each containing 206 amino acid residues.4 pCRP belongs to the pentraxin family, named for its cyclic pentameric symmetry; like other pentraxin, it may play an important role both in innate immunity and in clearance of cell corpses to prevent autoimmune disease.5 Recently, a modified form of pCRP (mCRP) formed under a nonproteolytic conformational change in the pCRP subunit structure was described.6, 7 These conformationally rearranged subunits express neoantigens, which can be detected in inflamed rabbit tissue8 as well as in natural killer (NK) cells and B cells.9 Besides conformational change, mCRP also has some distinct properties; compared with pCRP, mCRP loses its ability to bind to phosphatidylcholine but gains its ability to bind to the immune complex.10 In addition, mCRP promotes neutrophil-endothelial cell adhesion11 and delays apoptosis of neutrophil.12 Thus, pCRP and mCRP seem to play different roles in inflammation. Recently, fiber optic biosensors (FOBs) capable of real-time detection, with high adaptability and potential specific sensitivity, have been developed as important detection and identification tools for a wide variety of assays in biomedical applications.13, 14, 15 The detection principle of a large class of FOBs is based on the principle of total internal reflection fluorescence (TIRF).16, 17 When light propagating in the fiber core with a higher refractive index strikes an interface with a medium of lower refractive index at an incident angle greater than the critical angle, defined by the Snell’s law, it will be totally reflected. While the incident light is totally reflected, a shadow layer of electromagnetic field exists in the distal side of the interface as the evanescent wave, which can be used to excite fluorophores of absorbing species, resulting in the evanescent wave excitation of fluorescence. The intensity of the evanescent wave decays exponentially along the direction perpendicular to the interface; typically, the penetration depth of the evanescent wave into the low-index medium is in the range of , restricting the detection of molecular interactions to a localized region around immobilized recognition surface at the interface. Consequently, fluorophores of target molecules outside the sensing volume of evanescent wave do not contribute to the fluorescence signal. This characteristic enables real-time monitoring of the kinetics behavior between receptors and target analytes during the measurement. Moreover, the detected signal intensity of an FOB depends on the amount of fluorophores in the adsorbed analytes, and the relationship between the signal response and the concentration of a tested chemical or biochemical can be determined under a well-calibrated condition. In our current experiments, we set up a novel FOB in which the fluorescence signal excited by evanescent wave in the near-field region of fiber core surface was detected. A photomultiplier tube (PMT) facing the fiber wall, and perpendicularly to the fiber axis enabled us to collect the fluorescence signal more efficiently in the FOB [Fig. 1a ]. Fig. 1(a) Schematic diagram of the setup and configuration of an FOB and (b) diagram of the detailed reaction chamber in the FOB.  In general, an FOB can be used in combination with different types of spectroscopic techniques, such as fluorescence,18 phosphorescence,19 surface-enhanced Raman scattering,20 and surface plasmon resonance.21 TIRF using evanescent wave excitation is especially suitable for measuring the concentration of fluorescent molecules in an analyte.14, 22, 23 In this technique, antibodies are selectively immobilized onto the surface of the fiber core to serve as the probing surface. Several strategies have been used for molecular immobilization on the sensing surface in an FOB. The sandwich assay is one of the strategies24 in which primary antibody is immobilized on the surface of the fiber. On the addition of antigen and labeled second antibody, a “molecular sandwich” complex is formed on the fiber surface such that the labeled second antibody of the complex is within the evanescent-wave excitation volume where the fluorophores are excited. The specific fluorescence light emitted from the labeled antibody is then filtered and collected by a photodetector. To verify the feasibility and to test the sensitivity of this approach, the FOB was first set up to measure the kinetics of immunoglobulin G/anti-immunoglobulin G (IgG/anti-IgG) biomolecular interactions. From the time responses of the experimental results with different concentrations of IgG, the kinetics constants, including the association rate constant and dissociation rate constant of the interactions and the equilibrium dissociation constant were obtained. The binding kinetics between FITC-conjugated anti-CRP and CRP isoforms was then measured by the same system. CRP, an acute phase protein of inflammation, is related to the risk factor for cardiovascular diseases. Recent medical research reports point out that CRP is highly correlated with coronary heart disease (CHD) due to its concentration increase within a short period.25, 26, 27, 28, 29 Thus, the increasing concentration of CRP in a short period becomes an indicator of major risk factor in cardiovascular diseases,30, 31 including acute myocardial infarction (AMI). Moreover, in further studies, mCRP has been implicated as significantly more provoking than pCRP in cardiovascular diseases. Using the proposed and designed14, 15 FOB, we determined the mCRP/anti-CRP binding kinetics17 to investigate the correlation between mCRP and the risk factor of cardiovascular diseases quantitatively. Our experimental results may provide critical information for more efficient prognosis of the potential cardiovascular diseases. 2.Materials and MethodsAll solvents and chemicals used were either of analytical grade or chemically pure. Mouse IgG and monoclonal mouse anti-human CRP were purchased from Sigma-Aldrich Co. (St. Louis, Missouri, USA). Goat anti-mouse IgG and rabbit anti-mouse IgG with FITC conjugate were purchased from Chemicon Co. (Temecula, California, USA). Phosphate-buffered saline (PBS) solution containing phosphate and NaCl with pH 7.4 was used in the experiments. Highly purified CRP of human serum was obtained from Calbiochem Co. (La Jolla, California, USA) and sheep anti-CRP with FITC conjugate was purchased from Biogenesis (Dorset, United Kingdom). 2.1.Preparation of mCRPPurchased human pCRP was treated with the method described by Zouki 11 with some modification. Briefly, pCRP was chelated with EDTA and incubated in urea for at . Urea was removed via extensive dialysis against low ionic strength Tris-HCl (pH 8.3). The mCRP concentration was determined using the G-250 protein concentration assay kit (Bio-Rad 500-0001). The sterile filtered product obtained was designated mCRP and stored at , and used within . 2.2.Fluorescence Spectra Properties of pCRP and mCRPFluorescence spectra of pCRP and mCRP were analyzed with a Perkin-Elmer LS 50B luminescence spectrometer at . All spectra were corrected for buffer absorption. The Raman spectrum of water was also corrected. Both the red shift and fluorescence intensity changes were analyzed together using the average emission wavelength method.32 The average emission wavelength was calculated according to the following equation: where is the fluorescence intensity at the specific emission wavelength .2.3.Circular Dichroism Analysis of pCRP and mCRPThe circular dichroism (CD) measurement was made with a Jasco J-810 spectropolarimeter under constant flush and using a -path-length cell and averaging over three repetitive scans between 250 and . Parallel spectra of buffer ( Tris buffer with ) without protein were also recorded and subtracted from the sample spectra. Mean residue ellipticity was obtained by33 where is the ellipticity in millidegrees at the wavelength of , the mean amino acid residue weight , the cell path , and is the protein concentration in milligrams per milliliter.2.4.Coomassie Blue G-250 Staining and Western Blotting Analysis of pCRP and mCRP in Sodium Dodecysulfate-Polyacrylamide Gel Electrophoresis (SDS-PAGE) and Native-PAGEWe followed a method for immunoblotting described previously.34 Briefly, samples dissolved in SDS-PAGE buffer or native-PAGE (a nondenatured PAGE) buffer, followed by 12% SDS-PAGE and 8% native-PAGE, respectively, were used for electrophoretic experiments. After electrophoresis, proteins on the gel were either stained with Coomassie blue G-250, or transferred to Immobilon® PVDF membrane via wet transfer blotting system (Blot Electrophoretic Transfer Cell, Bio-Rad; transfer buffer: Tris, glycine, 0.1% SDS and 20% methanol, at for ). The membranes were blocked with blocking buffer [5% nonfat dried milk powder (NFDM) in PBS with 0.1% Tween 20] at room temperature (RT) for with slow shaking. Then, the membranes were immunoblotted with the primary antibody, i.e., monoclonal anti-human pCRP antibody (dilution ratio 1:1000 with 5% NFDM). After blotting, the membranes were washed in washing buffer (PBS with 0.1% Tween 20) once for followed by two washes. The membranes were immunoblotted with appropriated secondary antibodies in the same blocking buffer for at RT with slow shaking. The secondary antibodies for pCRP were anti-mouse IgG conjugated or anti-goat IgG conjugated with horseradish peroxidase with a dilution ratio of 1:2000 with 5% NFDM. Afterward, membranes were further washed in washing buffer once for followed by two washes. Protein visualization on each immunoblot was developed and performed with Renaissance®, DuPont Western Blot Chemiluminescence Reagent, NEN Research Products as described;34 or as manufacturer-provided protocols. 3.Fiber Optic Detection System Setup and ConfigurationFigure 1a is a schematic illustration of our fiber-optic detection system, which consists of a plastic (PMMA) fiber ( , ). A glass reaction chamber was used to hold the fiber near the inside bottom of the chamber [Fig. 1b]. The plastic fiber was uncladded by immersing into ethyl acetate for , followed by washing and cleaning with PBS three times. After that, a secondary-antibody sandwich technique was adopted to perform kinetics experiments. Rabbit anti-mouse IgG was immobilized onto the uncladded surface of plastic fiber for a start. Before injecting mouse IgG into the reaction chamber to form ⟨anti-IgG/IgG⟩ complex, skim milk was added into the chamber to block mouse IgG or FITC-conjugated anti-mouse IgG adsorbed onto the surface of uncladded fiber to avoid unspecific binding events, allowing only the specific binding between anti-mouse IgG and mouse IgG. By injecting different concentrations of mouse IgG into reaction chamber, ⟨anti-IgG/IgG⟩ complex was formed, which was used for further binding kinetics assay between FITC-conjugated anti-mouse IgG and mouse IgG. Finally, a series of different concentration of FITC-conjugated rabbit anti-mouse IgG, with the same corresponding concentrations of mouse IgG in previous steps, were added to the chamber to form a sandwich composite ⟨anti-IgG/IgG/FITC anti-IgG⟩ complex on the fiber surface. The attached FITC was excited by the evanescent wave near the uncladded fiber surface produced by a laser beam totally reflected in plastic fiber. Since the penetration depth of the evanescent wave is about at uncladded fiber surface, only FITC-conjugated antibody bound with antigen (in the tested solution) in the near-field region could be excited and detected. This feature renders unnecessary some complicated and tedious procedures of repeated-washing steps required in the conventional enzyme-linked immunosorbent assay (ELISA) to reduce false signal from unbound FITC-conjugated anti-IgG in reaction chamber. The fluorescence signal was detected by a PMT placed in the vicinity of (and facing) the fiber wall to improve the fluorescence collection efficiency. A lock-in amplifier (LIA) was incorporated to enhance the signal-to-noise ratio (SNR). The signal from the LIA is linked to a personal computer for data recording and processing. 3.1.CRP Sandwich AssayInitially, anti-CRP antibody was immobilized onto the uncladded surface of optical fiber in PBS (pH 7.4) for . After that, the unclad optical fiber was incubated with bovine serum albumin (BSA, ) for another so as to block the area unoccupied by anti-CRP antibody on the fiber surface; the error signal of nonspecific binding is thus reduced. At this stage, the optical fiber was ready to capture the antigen (5, 7.5, 10, and of either pCRP or mCRP) to form anti-CRP/pCRP complex. The incubation time in this period was . Finally, FITC-labeled anti-CRP (5, 7.5, 10, and ) was added into the PBS solution to form anti-CRP/pCRP/FITC-anti-CRP complex for binding kinetics measurement. The detection time of the fluorescence signal was . The total period of this kinetics measurement took about . 4.Kinetics Analysis of Protein-Protein Binding4.1.Protein Binding KineticsThe rate equation describing fluorescence-labeled antibody binding with antigen under the pseudo-first-order reaction kinetics is given by35 where is the association rate constant, is the dissociation rate constant, is the volume concentration of ⟨FITC—anti CRP⟩, is the surface concentration of CRP that is bound with the immobilized anti-CRP on the uncladded surface of the plastic fiber in this experiment, is the concentration of complex of at time , which is proportional to the intensity of fluorescence signal of the measurement.In consistence with the diffusion equation of external diffusion in solid-phase immunosensor described by Stenberg, 36 the volume concentration of FITC-anti-CRP in our experiment remains constant under pseudo-first order reaction. This implies that the measurement is not diffusion limited or mass transport limited reaction. In the measurement, the surface concentration of at time can be expressed by where is the maximum surface concentration of at .Based on Eq. 3, the association constant and the dissociation constant were deduced from the experimental data depicted in Figs. 5(b), 6(b), and 7(b) in Sec. 5.5.Results5.1.Comparison of Electrophoretic Mobility Between pCRP and mCRP5.1.1.Coomassie blue G-250 staining of CRP in native-PAGE and SDS-PAGEUnder the electric field, the mobility of macromolecules including pCRP and mCRP through a PAGE depends on its charge and also on its molecular mass, size, and shape. The mobility of pCRP and mCRP stained with Coomassie blue G-250 on Native-PAGE was measured and compared. As shown in Fig. 2 (a, panel A), initially pCRP was loaded in lane 1, after electrophoresis the protein showed little mobility in the gel, with no other mobility shifted bands observed. In contrast, we observed a smear in the gel indicating mCRP moving into the lower portion of the gel [Fig. 2(a, panel A)]. Together, the data suggest that subunits dissociation with a variation of molecular mass (weight) and conformation occurs during conversion from pCRP into mCRP. Fig. 2(A) Coomassie blue G-250 staining, with native-PAGE and SDS-PAGE electrophoretic difference between (panel a) crude pCRP and mCRP and (panel b) purified pCRP and mCRP. (B) Western blotting analysis, with native-PAGE electrophoretic difference between (panel a) crude pCRP and mCRP; (panel b) purified pCRP and mCRP.  Next, a column chromatography approach was used to separate and purify mCRP from pCRP (data not shown). To test the purity, the separated fractions of mCRP and pCRP were loaded onto SDS-PAGE and native-PAGE, respectively. After electrophoresis, proteins were stained with Coomassie blue G-250 and the results were shown in Fig. 2(a, panel B). On native-PAGE, the smear of mCRP was almost completely removed, and no contaminated fragments were detected on SDS-PAGE, indicating the purity of mCRP and pCRP. 5.1.2.Western blotting analysis of CRPMoreover, to identify and confirm the existence of pCRP and mCRP in our process, we further conducted Western blotting analyses of pCRP and mCRP. As we can see in Fig. 2(b, panel A), there is a wider smear band of crude mCRP compared to that of pCRP. After purification of mCRP via column chromatography, the smear of mCRP on native-PAGE was largely removed [Fig. 2(b, panel B)] compared to the lane of mCRP given in Fig. 2(b, panel A). 5.2.Fluorescence Spectral Properties of the Conformational Change During Conversion from pCRP to mCRPpCRP was treated with EDTA and urea in to become mCRP and the tryptophan fluorescence emission spectra of pCRP and mCRP were compared. As shown in Fig. 3 , when excited at , mCRP exhibits a red shift relative to the pCRP (maxima are at 357 and , respectively). Moreover, the fluorescence intensity was markedly quenched during the first of treatment, and reached equilibrium in about . This decrease in fluorescence intensity and the red shift indicate that protein unfolding is involved in the formation of mCRP. These data thus suggest that a rapid conversion from pCRP to mCRP occurred, and one or more of the six tryptophans of each subunit of pCRP became more solvent-exposed during this process. 5.3.CD Analysis of pCRP and mCRPThe CD spectroscopy was further used to investigate whether there is any secondary structure change between pCRP and mCRP (Fig. 4 ). The calculated secondary structure for mCRP is 19% helix, 25% sheet, 22% turn, and 34% unordered structure. Moreover, the fluorescence intensity also decreased after pCRP was converted to mCRP. These data support that mCRP formation requires conformational rearrangement. Table 2Summary of the percentage of secondary structure of pCRP and mCRP estimated by circular dichroism spectra.
5.4.IgG/Anti-IgG Binding KineticsTo first calibrate and optimize the system, the binding between FITC-conjugated rabbit anti-mouse IgG interacting with mouse IgG captured using immobilized rabbit anti-mouse IgG was studied, results are shown in Fig. 5a . The ascending rate of the fluorescence intensity depends upon the reaction rate of the protein dynamic behavior, hence the kinetic rate constants, i.e., the association and dissociation rate constants ( and ) as well as the equilibrium dissociation constant, , can be determined. In Fig. 5a, the protein complex is directly proportional to the fluorescence intensity at the initial stage of reaction during the binding process; the saturated portion of this time response curve means that the protein-protein interaction has reached dynamic equilibrium during the binding process. Fig. 5(a) Fluorescence intensity of five different concentrations of FITC-labeled rabbit anti-mouse IgG interacted with mouse IgG detected and measured by FOB and (b) determination of mouse IgG/anti-mouse IgG kinetics.  Using Eq. 3, we obtained the association and dissociation rate constants, and , from the slope and the abscissa of the experimental data (at different concentrations of secondary antibody) depicted in Fig. 5b. The equilibrium dissociation constant was then obtained. From Fig. 5b, the calculated , , and for IgG-anti IgG binding interactions are , , and , respectively.17 These data are consistent with the published IgG-anti IgG binding kinetics assay by conventional method.37 These results validate the capability of our approach to measure the kinetics of protein-protein interaction properly. 5.5.pCRP/Anti-CRP Binding Kinetics MeasurementThe experiments of anti-CRP interacting with pCRP at various concentrations were continuously monitored. The mouse anti-human CRP was immobilized onto the uncladded optical fiber in advance. After that, different concentrations of human pCRP (i.e., antigen) were added to form ⟨anti-CRP/pCRP⟩ complex and positioned in the reaction chamber as shown in Fig. 1b. Finally, FITC-conjugated sheep anti-human CRP was injected into reaction chamber to measure the binding affinity between FITC-conjugated anti-CRP and pCRP in real time. Figure 6a demonstrates the time response of FITC-conjugated sheep anti-CRP interacting with immobilized pCRP. Figure 6b shows the linear response of versus fluorescence intensity for different FITC-conjugated sheep anti-CRP concentrations (1, 2, 5, and ). The association rate constant , the dissociation rate constant , and the equilibrium dissociation constant were deduced from the ⟨pCRP/FITC anti-CRP⟩ binding reactions. 5.6.mCRP/Anti-CRP Binding Kinetics MeasurementNext, the experiments of FITC-conjugated sheep anti-human CRP interacting with mCRP at various concentrations were continuously monitored. The mouse anti-human CRP was immobilized onto the uncladded optical fiber in advance. After that, different concentrations of human mCRP (i.e., antigen) were added to form ⟨anti-CRP/pCRP⟩ complex and positioned in the reaction chamber as shown in Fig. 1b. Finally, FITC-conjugated sheep anti-human CRP was injected into reaction chamber to measure the binding affinity between anti-CRP and mCRP in real time. Figure 7a is the output fluorescence intensity versus time of FITC-conjugated sheep anti-human CRP concentration at . In Fig. 7b, we demonstrate the linear response of versus different concentrations (5, 7.5, 10, and ) of FITC-conjugated sheep anti-CRP in this experiment.17 Under the same test concentration, the fluorescence intensity in ⟨FITC anti-CRP/CRP⟩ is comparatively higher than that in ⟨FITC anti-IgG/IgG⟩ interaction, as shown in Fig. 5. This is due to a lower molecular weight of CRP compared with IgG, resulting in a higher density of fluorophores on the sensor surface of optical fiber core. Therefore, the SNR of the CRP experiments is higher than that in IgG experiment. For the ⟨mCRP/FITC anti-CRP⟩ interaction, the association rate constant, , the dissociation rate constant, , and the equilibrium dissociation constant, . The value of obtained is an order of magnitude larger than that of ⟨IgG/FITC anti-IgG⟩ interaction measured by the same approach. The results of key experiments are summarized in Table 1 . Fig. 7(a) Time response of FITC-conjugated anti-CRP interact with mCRP and (b) mCRP/FITC-conjugated anti-CRP kinetics determination. 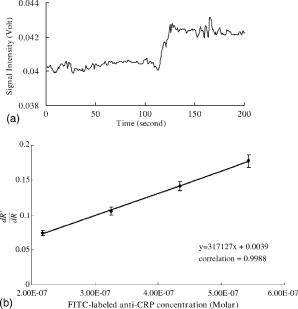 Table 1Summary of association rate constant (ka) , dissociation rate constant (kd) , and equilibrium dissociation constant (KD) for ⟨pCRP/FITC-anti-CRP⟩ interaction and ⟨mCRP/FITC-anti-CRP⟩ interaction.
6.Conclusions and DiscussionpCRP has been proven as an independent marker of cardiovascular disease.38 However, whether it is only a marker or a participator in atherosclerosis is still controversial. Recently, Pasceri 39 first found that pCRP might have a proinflammation effect on endothelium cells. Until now, more than a dozen papers described that pCRP promoted atherosclerosis through up-regulating inflammation cytokine, adhesion molecular and monocytes chemoattractant protein-1 (MCP-1). This evidence lead us to speculate that pCRP can be a mediator of atherosclerosis. An immediate (and related) question is whether pCRP is involved in all stages of atherosclerosis or in just a few specific periods. From a recent finding,31 Danesh indicated that the concentration of circulating pCRP could be a moderate predictor of coronary heart disease for at least . It implies that pCRP participates through out all stages. In general, pCRP belongs to pentraxin family, which is composed of five identical subunits arranged in a planar ring,40 and serum amyloid p (SAP) component is the other member. Each subunit of pCRP requires calcium to maintain its stability. The intrinsic fluorescence is a sensitive probe to monitor the conformational change of a protein. Our emission fluorescence data (Fig. 3) shows that the tertiary structure of EDTA and urea treated pCRP started to change within and reached equilibrium within . From our current results, the secondary structure of pCRP is estimated to be 13% helix, 44% sheet, 16% turn, and 27% unordered structure; in contrast, the secondary structure of mCRP is estimated to consist of 19% helix, 25% sheet, 22% turn, and 34% unordered structure. For comparison, our results are summarized in Table 2 along with the earlier estimated results reported by Dong 41 Recent papers39, 42 indicate that pCRP has proinflammatory effects on vascular cells and may lead to the progression of atherosclerosis. But all these proinflammatory effects of pCRP occurred from of incubation, reaching maximum at in a time window long enough for pCRP to convert to mCRP in vitro. Thus, we believe that a part of pCRP, in these experiments, spontaneously dissociated into mCRP in culture medium,43 and the proinflammatory phenomena are contributed by mCRP. In a recent review,44 the author who is the first to report that pCRP has a proinflammation on endothelial cells also noticed this intrinsic change inside pCRP. In the kinetics study, IgG/anti-IgG biomolecular interactions were monitored in real time, and the association rate constant , dissociation rate constant , and the equilibrium dissociation constant were measured accurately. To differentiate the kinetic behavior of pCRP from that of mCRP, which has been implicated more provoking than the pCRP; the kinetics constants of pCRP and mCRP were measured. The association rate constant of pCRP is 2 orders of magnitude higher than that of mCRP, and the dissociation rate constant of pCRP is an order higher than that of mCRP. Therefore, the developed fiber optic sensor can be a useful tool to quantitatively determine mCRP/anti-CRP and pCRP/anti-CRP binding kinetics, and to investigate the correlation between mCRP and the risk factor in cardiovascular diseases. The accumulated measurements and results of mCRP/anti-CRP binding kinetics can be potentially useful for earlier and faster diagnosis of the cardiovascular diseases. From the experimental results, FOB detects ⟨anti-CRP/pCRP⟩ and ⟨anti-CRP/mCRP⟩ interaction within a range of concentration from of pCRP and mCRP for and measurements, respectively. The high SNR of detected fluorescence signals in these experiments implies that an FOB is capable of detecting CRP at physiological concentration, which is in the range45 of . Recently, we46 have successfully detected CRP antigens via chemical adsorption method at the concentration of pCRP or mCRP. In contrast, the early diagnostic assay in conventional methods, such as nephelometry47 and turbidimetry,48 are able to detect CRP only at higher concentration of serum CRP. Although ELISA can detect49 CRP at , a relatively high false positive rate due to nonspecific binding reactions has been reported in a clinical environment.50, 51 Our FOB is based on fluorescence excitation by evanescent wave in the localized region adjacent to uncladded fiber core surface via total internal reflection; as a result, the binding specificity and the sensitivity to biomolecular interactions are improved, and the false rate induced by unbound FITC-anti-CRP antibody in the reaction chamber is thus reduced. The FOB described in this paper has the advantages of (1) high detection sensitivity, (2) better collection efficiency of fluorescence signal, and (3) multiple fiber channels detection capability. In our experimental setup, the PMT was placed in the vicinity of the optical fiber (and facing the fiber wall) to achieve better fluorescence detection efficiency under dark-field detection. Even under such a favorable condition, the absorption of the fluorescence signal by the aqueous solution in the reaction chamber can still reduce the intensity of fluorescence signal. This can be resolved by either using a proper aqueous solution transparent to the fluorescence signal or by decreasing the optical thickness of the aqueous solution between the fiber and the PMT. Besides, the fact that the auto-fluorescence emission peak of plastic fiber is far apart from the emission peak of FITC is critical to achieving a high sensitivity in our measurements. AcknowledgmentsThis research was supported by the Department of Health, Taiwan (DOH91-TD-1161, DOH92-TD-1119, CCMP92-RD-155, CCMP93-RD-055 to C. Chou); the National Science Council, Taiwan (NSC-93-2323-B-010-004 to C. Chou; and NSC-93-2120-M-010-002 to H.-Y. Hsu); the National Health Research Institutes, Taiwan (NHRI-EX93-9211SI to H.-Y. Hsu); the Ministry of Education, Taiwan, in the Program for Promoting Academic Excellence of Universities (A-91-B-FA09-2-4 to H.-Y. Hsu). ReferencesW. S. Tillet and
T. Francis,
“Serological reactions in pneumonia with a non-protein somatic fraction of pneumococcus,”
J. Exp. Med., 52 561
–571
(1930). 0022-1007 Google Scholar
B. Shine,
F. C. de Beer, and
M. B. Pepys,
“Solid phase radioimmunoassays for human C-reactive protein,”
Clin. Chim. Acta, 117 13
–23
(1981). 0009-8981 Google Scholar
C. Gabay and
I. Kushner,
“Acute-phase proteins and other systemic responses to inflammation,”
N. Engl. J. Med., 340 448
–454
(1999). 0028-4793 Google Scholar
D. Thompson,
M. B. Pepys, and
S. P. Wood,
“The physiological structure of human C-reactive protein and its complex with phosphocholine,”
Structure Fold Des., 7 169
–177
(1999). Google Scholar
M. C. Bickerstaff,
M. Botto,
W. L. Hutchinson,
J. Herbert,
G. A. Tennent,
A. Bybee,
D. A. Mitchell,
H. T. Cook,
P. J. Butler,
M. J. Walport, and
M. B. Pepys,
“Serum amyloid P component controls chromatin degradation and prevents antinuclear autoimmunity,”
Nat. Med., 5 694
–697
(1999). 1078-8956 Google Scholar
L. A. Potempa,
B. A. Maldonado,
P. Laurent,
E. S. Zemel, and
H. Gewurz,
“Antigenic, electrophoretic and binding alterations of human C-reactive protein modified selectively in the absence of calcium,”
Mol. Immunol., 20 1165
–1175
(1983). 0161-5890 Google Scholar
L. A. Potempa,
J. N. Siegel,
B. A. Fiedel,
R. T. Potempa, and
H. Gewurz,
“Expression, detection and assay of a neoantigen (Neo-CRP) associated with a free, human C-reactive protein subunit,”
Mol. Immunol., 24 531
–541
(1987). 0161-5890 Google Scholar
R. F. Rees,
H. Gewurz,
J. N. Siegel,
J. Coon, and
L. A. Potempa,
“Expression of a C-reactive protein neoantigen (neo-CRP) in inflamed rabbit liver and muscle,”
Clin. Immunol. Immunopathol, 48 95
–107
(1988). 0090-1229 Google Scholar
R. A. Bray,
N. L. Samberg,
H. Gewurz,
L. A. Potempa, and
A. L. Landay,
“C-reactive protein antigenicity on the surface of human peripheral blood lymphocytes. Characterization of lymphocytes reactive with anti-neo-CRP,”
J. Immunol., 140 4271
–4278
(1988). 0022-1767 Google Scholar
M. Motie,
S. Brockmeier, and
L. A. Potempa,
“Binding of model soluble immune complexes to modified C-reactive protein,”
J. Immunol., 156 4435
–4441
(1996). 0022-1767 Google Scholar
C. Zouki,
B. Haas,
J. S. Chan,
L. A. Potempa, and
J. G. Filep,
“Loss of pentameric symmetry of C-reactive protein is associated with promotion of neutrophil-endothelial cell adhesion,”
J. Immunol., 167 5355
–5361
(2001). 0022-1767 Google Scholar
T. Khreiss,
L. Jozsef,
S. Hossain,
J. S. Chan,
L. A. Potempa, and
J. G. Filep,
“Loss of pentameric symmetry of C-reactive protein is associated with delayed apoptosis of human neutrophils,”
J. Biol. Chem., 277 40775
–40781
(2002). 0021-9258 Google Scholar
B. Bluestein,
I. M. Walczak, and
S. Y. Chen,
“Fiber optic evanescent wave immunosensors for medical diagnostics,”
Trends Biotechnol., 8 161
–167
(1990). 0167-7799 Google Scholar
M. Mehrvar,
C. Bis,
J. M. Scharer,
M. Moo-Young, and
J. H. Luong,
“Fiber-optic biosensors—trends and advances,”
Anal. Sci., 16 677
–692
(2000). 0910-6340 Google Scholar
P. N. Prasad,
“Optical biosensors,”
Introduction to Biophotonics, 311
–356 Wiley-Interscience, NJ
(2003). Google Scholar
Y. H. Chang,
T. C. Chang,
E. F. Kao, and
C. Chou,
“Detection of protein A produced by Staphylococcus aureus with a fiber-optic-based biosensor,”
Biosci., Biotechnol., Biochem., 60 1571
–1574
(1996). 0916-8451 Google Scholar
T. S. Chan,
C. Chou,
C. Y. Han,
H. T. Wu, and
Z. R. You,
“Detecting E. coli with fiber-optic biosensor,”
734
(2003). Google Scholar
T. S. Chan,
Z. R. You,
H. T. Wu,
S. Y. Chiu, and
C. Chou,
“Optical fiber biosensor for real time analyzing biomolecule binding kinetics,”
592
–594
(2003). Google Scholar
M. A. Chan,
J. L. Lawless,
S. K. Lam, and
D. Lo,
“Fiber optic oxygen sensor based on phosphorescence quenching of erythrosine B trapped in silica-gel glasses,”
Anal. Chim. Acta, 408 33
–37
(2000). 0003-2670 Google Scholar
D. L. Stokes and
T. Vo-Dinh,
“Development of an integrated single-fiber SERS sensor,”
Sens. Actuators B, 69 28
–36
(2000). https://doi.org/10.1016/S0925-4005(00)00291-4 0925-4005 Google Scholar
J. Homola,
S. S. Yee, and
G. Gauglitz,
“Surface plasmon resonance sensors: review,”
Sens. Actuators B, 54 3
–15
(1999). https://doi.org/10.1016/S0925-4005(98)00321-9 0925-4005 Google Scholar
M. D. Marazuela and
M. C. Moreno-Bondi,
“Fiber-optic biosensors—an overview,”
Anal. Bioanal. Chem., 372 664
–682
(2002). https://doi.org/10.1007/s00216-002-1235-9 1618-2642 Google Scholar
C. Zhou,
P. Pivarnik,
S. Auger,
A. Rand, and
S. Letcher,
“A compact fiber-optic immunosensor for salmonella based on evanescent wave excitation,”
Sens. Actuators B, 42 169
–175
(1997). 0925-4005 Google Scholar
T. Vo-Dinh,
M. J. Sepaniak,
G. D. Griffin, and
J. P. Alarie,
“Immunosensors: principles and applications,”
Immunomethods, 3 85
–92
(1993). 1058-6687 Google Scholar
W. K. Lagrand,
C. A. Visser,
W. T. Hermens,
H. W. Niessen,
F. W. Verheugt,
G. J. Wolbink, and
C. E. Hack,
“C-reactive protein as a cardiovascular risk factor: more than an epiphenomenon,”
Circulation, 100 96
–102
(1999). 0009-7322 Google Scholar
G. J. Blake and
P. M. Ridker,
“Novel clinical markers of vascular wall inflammation,”
Circ. Res., 89 763
–771
(2001). 0009-7330 Google Scholar
R. S. Rosenson and
W. Koenig,
“High-sensitivity C-reactive protein and cardiovascular risk in patients with coronary heart disease,”
Curr. Opin. Cardiol., 17 325
–331
(2002). 0268-4705 Google Scholar
R. Nijmeijer,
W. K. Lagrand,
C. A. Visser,
C. J. Meijer,
H. W. Niessen, and
C. E. Hack,
“CRP, a major culprit in complement-mediated tissue damage in acute myocardial infarction,”
Int. Immunopharmacol., 1 403
–414
(2001). Google Scholar
G. Taubes,
“Cardiovascular disease. Does inflammation cut to the heart of the matter,”
Science, 296 242
–245
(2002). 0036-8075 Google Scholar
P. M. Ridker,
N. Rifai,
L. Rose,
J. E. Buring, and
N. R. Cook,
“Comparison of C-reactive protein and low-density lipoprotein cholesterol levels in the prediction of first cardiovascular events,”
N. Engl. J. Med., 347 1557
–1565
(2002). 0028-4793 Google Scholar
J. Danesh,
J. G. Wheeler,
G. M. Hirschfield,
S. Eda,
G. Eiriksdottir,
A. Rumley,
G. D. Lowe,
M. B. Pepys, and
V. Gudnason,
“C-reactive protein and other circulating markers of inflammation in the prediction of coronary heart disease,”
N. Engl. J. Med., 350 1387
–1397
(2004). 0028-4793 Google Scholar
M. M. Sanchez del Pino and
A. R. Fersht,
“Nonsequential unfolding of the alpha/beta barrel protein indole-3-glycerol-phosphate synthase,”
Biochemistry, 36 5560
–5565
(1997). 0006-2960 Google Scholar
B. Moza,
S. H. Qureshi,
A. Islam,
R. Singh,
F. Anjum,
A. A. Moosavi-Movahedi, and
F. Ahmad,
“A unique molten globule state occurs during unfolding of cytochrome c by LiClO4 near physiological pH and temperature: structural and thermodynamic characterization,”
Biochemistry, 45 4695
–4702
(2006). 0006-2960 Google Scholar
H. Y. Hsu,
D. P. Hajjar,
K. M. Khan, and
D. J. Falcone,
“Ligand binding to macrophage scavenger receptor-A induces urokinase-type plasminogen activator expression by a protein kinase-dependent signaling pathway,”
J. Biol. Chem., 273 1240
–1246
(1998). 0021-9258 Google Scholar
R. J. Green,
R. A. Frazier,
K. M. Shakesheff,
M. C. Davies,
C. J. Roberts, and
S. J. B. Tendler,
“Surface plasmon resonance analysis of dynamic biological interactions with biomaterials,”
Biomaterials, 21 1823
–1835
(2000). https://doi.org/10.1016/S0142-9612(00)00077-6 0142-9612 Google Scholar
M. Stenberg,
L. Stiblert, and
H. Nygren,
“External diffusion in solid-phase immunoassays,”
J. Theor. Biol., 120 129
–140
(1986). 0022-5193 Google Scholar
D. Ivnitski,
T. Wolf,
B. Solomon,
G. Fleminger, and
J. Rishpon,
“An amperometric biosensor for real-time analysis of molecular recognition,”
Bioelectrochem. Bioenerg., 45 27
–35
(1998). 0302-4598 Google Scholar
P. M. Ridker,
“Clinical application of C-reactive protein for cardiovascular disease detection and prevention,”
Circulation, 107 363
–369
(2003). 0009-7322 Google Scholar
V. Pasceri,
J. T. Willerson, and
E. T. Yeh,
“Direct proinflammatory effect of C-reactive protein on human endothelial cells,”
Circulation, 102 2165
–2168
(2000). 0009-7322 Google Scholar
A. P. Osmand,
B. Friedenson,
H. Gewurz,
R. H. Painter,
T. Hofmann, and
E. Shelton,
“Characterization of C-reactive protein and the complement subcomponent C1t as homologous proteins displaying cyclic pentameric symmetry (pentraxins),”
Proc. Natl. Acad. Sci. U.S.A., 74 739
–743
(1977). 0027-8424 Google Scholar
A. Dong,
W. S. Caughey, and
T. W. Du Clos,
“Effects of calcium, magnesium, and phosphorylcholine on secondary structures of human C-reactive protein and serum amyloid P component observed by infrared spectroscopy,”
J. Biol. Chem., 269 6424
–6430
(1994). 0021-9258 Google Scholar
C. H. Wang,
S. H. Li,
R. D. Weisel,
P. W. Fedak,
A. S. Dumont,
P. Szmitko,
R. K. Li,
D. A. Mickle, and
S. Verma,
“C-reactive protein upregulates angiotensin type 1 receptors in vascular smooth muscle,”
Circulation, 107 1783
–1790
(2003). 0009-7322 Google Scholar
Y. Wu,
S. R. Ji,
H. W. Wang, and
S. F. Sui,
“Study of the spontaneous dissociation of rabbit C-reactive protein,”
Biochemistry (Mosc.), 67 1377
–1382
(2002). 0006-2979 Google Scholar
S. Verma,
P. E. Szmitko, and
E. T. Yeh,
“C-reactive protein: structure affects function,”
Circulation, 109 1914
–1917
(2004). 0009-7322 Google Scholar
H.-W. Wang and
S.-F. Sui,
“Dissociation and subunit rearrangement of membrane-bound human c-reactive proteins,”
Biochem. Biophys. Res. Commun., 288 75
–79
(2001). 0006-291X Google Scholar
H.-Y. Chen,
“The application of fiber-optic biosensor on measuring kinetics of mCRP/anti-CRP interaction for acute myocardial infarction detection,”
National Yang Ming University,
(2004). Google Scholar
M. Lammers,
J. Bienvenu,
G. Monneret,
de L. L. Borque,
N. Gaona, and
G. Schumann,
“Evaluation of an improved immunonephelometric assay for C-reactive protein,”
Clin. Chem., 42 S165
(1996). 0009-9147 Google Scholar
C. P. Price,
A. K. Trull,
D. Berry, and
E. G. Gorman,
“Development and validation of a particle-enhanced turbidimetric immunoassay for C-reactive protein,”
J. Immunol. Methods, 99 205
–211
(1987). 0022-1759 Google Scholar
J. Wilkins,
J. R. Gallimore,
E. G. Moore, and
M. B. Pepys,
“Rapid automated high sensitivity enzyme immunoassay of C-reactive protein,”
Clin. Chem., 44 1358
–1361
(1998). 0009-9147 Google Scholar
A. Dalimi,
R. Hadighi, and
R. Madani,
“Partially purified fraction (PPF) antigen from adult Fasciola gigantica for the serodiagnosis of human fascioliasis using Dot-ELISA technique,”
Ann. Saudi Med., 24 18
–20
(2004). Google Scholar
J. Yang,
K. W. Joo,
Y. S. Kim,
C. Ahn,
J. S. Han,
S. Kim, and
J. S. Lee,
“Two cases of pure red-cell aplasia due to anti-erythropoietin antibodies,”
J. Nephrol., 18 102
–105
(2005). Google Scholar
|