
|
|
|
The use of light scattering techniques for in vitro measurements of subcellular structures has gained considerable momentum in recent years, and in particular, several authors have focused on cellular light scattering to report changes in mitochondrial morphology in response to a variety of stresses.1, 2 In our laboratory, we have studied angularly resolved light scattering from EMT6 cells and shown that our measurements are consistent with mitochondria and lyso-somes being the dominant light scattering centers within cells.3 Our models of scattering signatures attributed to mitochondrial swelling have to date assumed that the lysosomal contribution to cellular light scattering is negligible.4 In a recent report, we observed a scattering contrast between cells stained with a high-extinction lysosomal-localizing dye and cells that were unstained, and through an absorbing-sphere model, we extracted a size distribution and scattering contribution that we assigned to lysosomes.5 As that model was an approximation designed primarily to identify the refractive index of lysosomes, we need an independent set of experiments to verify that the size distributions and scattering contributions of lysosomes identified in that report are correct. The dye N-aspartyl chlorin e6 (NPe6) is a photosensitizer used in photodynamic therapy (PDT) that localizes in lysosomes.6 It is well established that with proper irradiation of cells loaded with lysosomal-localizing photosensitizers, oxidative stress is deposited to these organelles, causing lysosomal ablation.6, 7, 8 PDT destroys the overwhelming majority of lysosomes with a variety of lysosomal-localizing photosensitizers7 in cell lines including EMT6 (Ref. 8) and specifically using NPe6 in other cell lines.6 In this letter, we find conditions under which NPe6-PDT causes lysosomal ablation and use angularly resolved light scattering measurements from control- and lysosome-ablated EMT6 cells to measure lysosomal particle size distributions and the lysosomal contribution to cellular light scattering. For fluorescence microscopy studies, EMT6 cells were grown on 25-mm round coverslips in Eagle’s basal medium with 10% fetal bovine serum (complete media) at 37 °C and 5% . After three days, the media was removed and the cells were incubated overnight in the dark in complete media containing of NPe6. They were then costained with LysoTracker Blue (Molecular Probes, Eugene, Oregon) for . The cells were then washed twice in Hank’s Balanced Salt Solution (HBSS) and placed in a coverslip dish that accommodates of HBSS. Fluorescence images of the cells were acquired using a Nikon Diaphot inverted microscope with filter sets appropriate for LysoTracker Blue. Cells were irradiated on the microscope stage with of light from a 662-nm diode laser at fluences ranging from to , with fluorescence images captured at various fluences spanning this range. For angularly resolved light scattering measurements, cells were maintained in monolayer culture in complete media. When cells reached 60 to 70% confluence, the media was removed, and the cells were incubated overnight in complete media containing NPe6. The cells were then washed twice with HBSS, lifted from the plate with 0.25% trypsin, and suspended in at least 1 part complete media per part trypsin. They were then centrifuged and resuspended in HBSS at a concentration of . Using a goniometer described in detail previously,4, 5 angularly resolved light scattering measurements at were taken on intact control EMT6 cells and cells incubated with NPe6 and irradiated with a treatment at . Representative fluorescence images demonstrating lysosomal ablation are shown in Fig. 1 . In the pretreatment image (a), we see a punctate pattern of fluorescence characteristic of lysosomal staining. After a irradiation (b), the fluorescence pattern is more diffuse, consistent with redistribution of the LysoTracker Blue into the cytosol. After (c), the majority of the punctate foci of fluorescence have disappeared, indicating the ablation of a significant fraction of lysosomes. The fluorescence pattern did not significantly change when a irradiation was delivered to the cells. Cells loaded with LysoTracker Blue in the absence of NPe6 were imaged pre- and post-irradiation with at to ensure that changes in the fluorescence pattern were not due to photobleaching of the LysoTracker Blue. The post-irradiation image is shown in Fig. 1d. Fig. 1(a) to (c) Fluorescence images of EMT6 cells loaded with NPe6, stained with LysoTracker Blue, and imaged with a filter set appropriate for LysoTracker Blue. (a) Cells with no irradiation show a punctate pattern of fluorescence. (b) After of irradiation, we see a more diffuse pattern of fluorescence. (c) After , the majority of lysosomes are ablated. (d) Image of cells labeled with LysoTracker Blue only and irradiated at . The punctate fluorescence is maintained in the absence of NPe6-mediated PDT. The scale bar is .  Angularly resolved light scattering data from control, intact cells and cells with PDT-ablated lysosomes are shown in Fig. 2 . The scattering data for PDT-treated cells reveal that cells subjected to a treatment scatter less light than control cells into angles greater than , while forward-directed scattering is similar for the two cell groups. Scattering changes in this angular range are consistent with previous findings attributed to lysosomes5 and are dramatically inconsistent with our findings following mitochondrial perturbations.4 Within a Mie theory model, scattering changes in this range of angles are consistent with perturbations to particles smaller than mitochondria. Fig. 2Angularly resolved light scattering data from intact control EMT6 cells (squares) and cells given a NPe6-PDT treatment. These two cell populations have similar angular scattering distributions in the forward direction, while the PDT-treated group scatters less light beyond , characteristic of a population of light scattering centers being ablated.  We fit our Mie theory model described in detail previously3 to both the control-cell scattering data and data from cells subjected to a NPe6-PDT. Briefly, we assumed that the functional form of the particle size distribution, , was a sum of log-normal distribution as where are constants representing relative numbers of particles in each log-normal distribution, , that is described completely by its mean, , and standard deviation, . Angular scattering distributions for the assumed particle size distributions are calculated from Mie theory, and the s, s, and s are adjusted to minimize using a downhill simplex routine.4 A notable result of these fits is that, consistent with results reported previously in Wilson and Foster,3 the particle size distributions returned from fits to both control and PDT-treated cells are bimodal and are incompatible with a trimodal size distribution. Representative plots of scattering-cross-section- -weighted particle size distributions, , are displayed in Fig. 3 . In these curves, which represent the amount of light scattered as a function of particle diameter, it is evident that the effect of lysosomal ablation on light scattering from these cells is modest and that changes in the plots are apparent for particle sizes smaller than . Parameters returned by these fits, the means , standard deviations , and scattering contribution defined asare summarized in Table 1 .Fig. 3Cross-section-weighted particle size distributions returned from fits to angularly resolved light scattering data from control and NPe6-PDT treated cells. Analysis of these plots shows that lysosomes are to in size and contribute ~14% of the total scattering signal at . 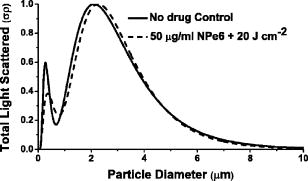 As the fits to each individual data set do not reveal the existence of a lysosomal population, we fit a model to the control- and PDT-treated-cell scattering data simultaneously by methods similar to Wilson 5 to quantify the contribution of lysosomes. The model we adopted was that intact control cells had a trimodal size distribution of the form of Eq. 1. When cells were treated with in the presence of NPe6, one of these log-normal distributions, representing the contribution from lysosomes, is completely ablated, while the other two remain intact. The particle size distributions for control and lysosome-ablated cells are then written When these data sets were fit simultaneously, three distinct populations of light scatterers were recovered. The particle distribution that we identified as lysosomes, or in Eq. 3, is characterized by a mean size and standard deviation of and , respectively. Its contribution to the scattering signal, from Eq. 2, is 14%. The dominant light scattering population, , with an parameter of 77%, had a mean diameter and standard deviation of and , respectively. This population has size parameters very similar to those that we have attributed to mitochondria.4, 5 The third population, , had a mean and standard deviation of and , respectively, and accounted for only 9% of the signal. These parameters are summarized in Table 1.Figure 4 shows the log-normal particle size distributions returned by fits to control cell scattering data and distributions returned from simultaneous fits to control and PDT-treated cell data sets. The particle size distributions that we have attributed to lysosomes and mitochondria, which were obtained using Eq. 3, are shown as dots and dashes , respectively. It is clear that these curves blend together in size. In fact, when we plot the weighted sum of these distributions, represented by open circles , the plot takes the form of a single log-normal distribution, which accounts for the fact that we cannot isolate mitochondrial and lysosomal light scattering contributions without some form of contrast. What is striking is that when we overlay the distribution returned from our bimodal fit to the control-cell data, represented by the solid black curve, it is indistinguishable from the weighted sum of the lysosomal and mitochondrial populations. Fig. 4Particle size distributions extracted from fits to scattering data. The control distribution (solid line) refers to population 1 from the control column in Table 1. The simultaneous fits represent populations 1 (dashed line) and 3 (dotted line) from the simultaneous column in Table 1, which we attribute to mitochondria and lysosomes, respectively. The open circles are the weighted sum of the simultaneous populations 1 and 3.  Table 1Summary of parameters that were returned by fits to angularly resolved light scattering data from control and NPe6 PDT-treated cells. When the control and PDT-treated data sets were fit individually, each returned a bimodal distribution in particle size, with the treated cells favoring slightly larger particles. When we fit the two sets simultaneously, we obtained information about a third population.
We used photodynamic ablation to quantify the lysosomal contribution to angularly resolved light scattering from intact EMT6 cells. We found both the particle size distributions and the relative scattering contribution for lysosomes to be in remarkable agreement with those reported in Wilson 5 The lysosomal contribution to cellular light scattering of 14% that we found here in one sense represents a lower limit, as the possibility that some lysosomes were left intact after PDT cannot rigorously be excluded. However, taken with our previously reported estimate of 15% obtained using an independent method5 and the electron microscopy results reported in Lin, 7 we conclude that the overwhelming majority of lysosomes were effectively ablated by photodynamic action. This study demonstrates that angularly resolved light scattering measurements can be used to quantify lysosomal morphology; however, these measurements are significantly more sensitive to the population that we identify as primarily mitochondria. AcknowledgementsThe authors are grateful to the Light Sciences Corporation for the gift of NPe6. This work was supported by NIH Grant No. CA68409 awarded by the National Cancer Institute. ReferencesG. Schuele,
E. Vitkin,
P. Huie,
C. O’Connell-Rodwell,
D. Palanker, and
L. T. Perelman,
“Optical spectroscopy noninvasively monitors response of organelles to cellular stress,”
J. Biomed. Opt., 10 051404
(2005). https://doi.org/10.1117/1.2075207 1083-3668 Google Scholar
N. N. Boustany,
R. Drezek, and
N. V. Thakor,
“Calcium-induced alterations in mitochondrial morphology quantified in situ with optical scatter imaging,”
Biophys. J., 83 1691
–1700
(2002). 0006-3495 Google Scholar
J. D. Wilson and
T. H. Foster,
“Mie theory interpretations of light scattering from intact cells,”
Opt. Lett., 30 2442
–2444
(2005). https://doi.org/10.1364/OL.30.002442 0146-9592 Google Scholar
J. D. Wilson,
C. E. Bigelow,
D. J. Calkins, and
T. H. Foster,
“Light scattering from intact cells reports oxidative-stress-induced mitochondrial swelling,”
Biophys. J., 88 2929
–2938
(2005). https://doi.org/10.1529/biophysj.104.054528 0006-3495 Google Scholar
J. D. Wilson,
W. J. Cottrell, and
T. H. Foster,
“Index-of-refraction-dependent sub-cellular light scattering observed with organelle-specific dyes,”
J. Biomed. Opt., 12 014010
(2007). https://doi.org/10.1117/1.2437765 1083-3668 Google Scholar
J. J. Reiners Jr., J. A. Caruso,
P. Mathieu,
B. Chelladurai,
X. M. Yin, and
D. Kessel,
“Release of cytochrome c and activation of pro-caspase-9 following lysosomal photodamage involves Bid cleavage,”
Cell Death Differ, 9 934
–944
(2002). 1350-9047 Google Scholar
C. W. Lin,
J. R. Shulok,
S. D. Kirley,
C. M. Bachelder,
T. J. Flotte,
M. E. Sherwood,
L. Cincotta, and
J. W. Foley,
“Photodynamic destruction of lysosomes mediated by Nile blue photosensitizers,”
Photochem. Photobiol., 58 81
–91
(1993). 0031-8655 Google Scholar
I. Georgakoudi and
T. H. Foster,
“Effects of the subcellular redistribution of two Nile blue derivatives on photodynamic oxygen consumption,”
Photochem. Photobiol., 68 115
–122
(1998). https://doi.org/10.1562/0031-8655(1998)068<0115:EOTSRO>2.3.CO;2 0031-8655 Google Scholar
|


