|
|
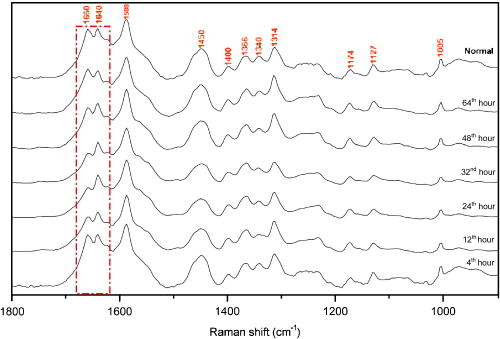
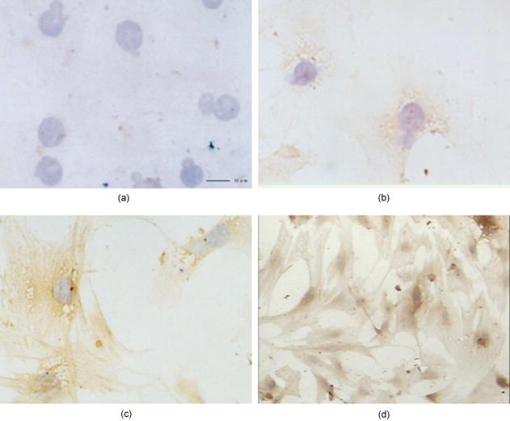
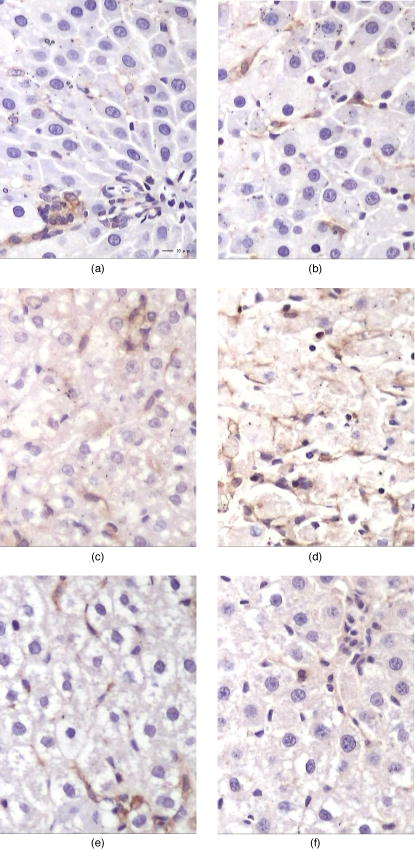
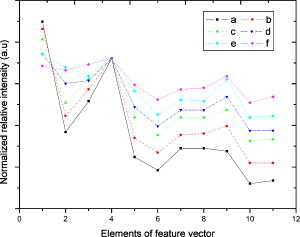
1.IntroductionHepatic stellate cells (HSCs; Ito cells1), comprising 5 to 8% of the total number of resident liver cells, play an important role in the pathogenesis of liver disease. The activation of HSCs represents a final common pathway of the hepatic response to liver injury.2 Following an acute/chronic liver injury, the normally quiescent HSCs undergo a progressive activation or transdifferentiation into proliferative, fibrogenic, proinflammatory, and contractile myofibroblasts.3 Since the activation of HSCs could be regarded as an early symbol of the hepatic fibrosis,4 it was desirable to find a single, rapid, and precise technique to identify HSCs in the quiescent phenotype and after their activation. Several methods for HSC phenotype identification such as fluorescence microscope,4 flow cytometry,5 Western blot analysis,6 and immunochemistry,7 have been reported. However, most of these methods are invasive and require complex preparation steps such as cell fixation, staining, protein extractions, etc. Hence there is a need to develop a suitable technique capable of directly characterizing HSC in vivo or in vitro activation.4 Raman spectroscopy is a well-established analytical tool and is based on the interaction of electromagnetic radiation with the molecules in the sample. The Raman spectrum provides useful information for chemical fingerprinting of the samples. This technique has three main advantages over conventional biological assays for the study of cells or tissues (1) it is rapid8, 9 (1 to ), (2) it is noninvasive and no labels are required, and (3) no damage is induced to the biomedical samples if suitable laser wavelength and laser power are used.9, 10 It has been applied in the investigation of biomedical issues including quantitative histochemical analysis of human arteries,11 disease diagnosis especially for cancer,12, 13 characterization of pterygium and normal bulbar conjunctiva,14 imaging of cells,15 and analysis of the stratum corneum in human skin in relation to administration of therapeutic agents.16 A few studies have been carried out on the application of Raman spectroscopy in hepatology. Hawi used Raman microspectroscopy to characterize normal and malignant hepatocytes in cultured cells and in human liver tissues.17 In this study, we successfully isolated HSCs and induced cell in vitro activation using growth in uncoated plastic plates and in vivo activation by a single intraperitoneal injection of . The activated cells were analyzed using Raman microspectroscopy as well as by other established biological methods to establish a correlation between spectral changes and molecular changes within the HSCs. 2.Materials and Method2.1.Cell Sample PreparationHSCs were isolated from 1-yr-old male Wistar rats. Livers were isolated and perfused under pentobarbital anesthesia , with and free Hanks’ balanced salt solution (HBSS) for and then with Hanks containing 0.1% pronase E (Roche Diagnostics, Penzberg, Germany) for and with Hanks containing 0.04% collagenase (GIBCO-BRL, Burlington, Ontario) for another . Livers were minced and incubated at C with constant shaking for in Dulbeco’s modified eagle medium (DMEM) containing 0.01% DNase I. Hepatocytes were removed by centrifuging at for . HSCs were then isolated using Nycodenz (Axis-Shield PoC AS, Norway) density gradient centrifugation. To improve the purity of stellate cells, a third layer of 8% Nycodenz was added between 11% Nycodenz and DMEM layers as described by Oinonen 18 After centrifugation, HSCs were collected from the 8% Nycodenz-DMEM interphase. Freshly isolated HSCs were plated on uncoated plastic tissue culture plates to induce HSCs in vitro activation at a density of in DMEM containing 10% calf serum. HSCs were identified by their typical microscopical appearance with characteristic retinoid droplets, autofluorescence emission, and immunochemical staining for desmin. The freshly isolated and the 4th, 8th, and 12th day cells in culture were examined by confocal Raman spectroscopy (CRS), and immunochemical staining for -SMA ( -smooth muscle action). HSCs were digested by trypsin and washed twice with phosphate-buffered saline (PBS) (pH 7.4). The HSC suspensions were diluted to an optical density of . These suspensions were dropped on carriers of gold sheet for Raman detection and discarded after use.19, 20 2.2.Laser Confocal MicroscopyTo observe typical HSC microscopic appearance with characteristic retinoid droplets, a photograph of the freshly isolated HSCs were taken by a Nikon microscope camera FX-35WA connected to the inverted microscope (Nikon diaphot, Japan). Freshly isolated HSCs were also examined by laser confocal microscopy (Leica TCS SP2 MP, Germany) with a 328 nm excitation beam to identify the emission of blue/green autofluorescence in cells. 2.3.Immunochemical Staining for DesminThe freshly isolated HSCs were smeared to the slides and fixed with acetone to perform immunochemical staining for desmin. The slides were incubated with 0.1% Triton-X 100 for , and then with for , and with 5% bovine serum albumin for another at 37°C. Then, the slides were incubated with the mouse monoclonal antibodies against desmin (Zymed, San Francisco, California; dilution 1:100) for at 37°C. Immunoreactivity was detected with the streptavidin-biotin-complex/immunoperoxidase (SABC) kit (Wuhan Boster Biological Technology Ltd., China) as the protocol. The sections were developed with -diaminobenzidine tetrahydrochloride (Sigma, St. Louis, MO), and counterstained with haematoxylin. Replacement of the primary antibody with phosphate buffer solution (PBS) served as a negative control. Light microscopic examinations were made at 200 magnifications. 2.4.Immunocytochemical Analysis for -SMA of HSCs During CultivationThe freshly isolated and the 4th, 8th, and 12th day cultured cells were examined by immunochemical staining for -SMA. Cell crawl slides were washed in PBS and fixed with acetone. Then, immunochemical staining was performed as already described except that the primary antibody was mouse anti- -SMA monoclonal antibody (1:100; Wuhan Boster Biological Technology Ltd., China). Light microscopic examinations were made at . 2.5.Liver Tissue Sample PreparationThe model animals used were 48 adult male Wistar rats (weighing 200 to ). They were injected intraperitoneally with ( by weight) dissolved in olive oil. Eight rats were executed each time at the indicated time points: 4th, 12th, 24th, 32nd, 48th, and . Excision specimens taken from each rat were divided into two parts, one was used for immunohistological analysis, and the other was snap-frozen in liquid nitrogen and stored at until use. Cryosections ( thick) were placed on a gold sheet for Raman detection. During the measurement, the liver tissue section was thawed to reach room temperature in air. 2.6.Raman SpectroscopyA Renishaw Raman microspectrometer (System RM1000, Renishaw, Wotton under Edge, UK), similar to the system used by Maquelin 21 was optimized for maximum throughput, detection sensitivity, and fluorescence suppression. The argon ion laser (Spectra Physics, Mountain View, California) provided a 20 mW excitation light at . After attenuation through prisms and filters, the power of the laser exposed on the samples was only about , which makes it almost impossible for the laser to lead to degradation of the tissues. Spectra were measured from tissues with a short-working-distance objective [numerical aperture (NA) 0.40], and the signal was integrated for 30 to and measured over a spectral range of 600 to with respect to the excitation frequency. The system included a stigmatic spectrometer with two motorized gratings, of which the grating was used to provide a spectral resolution of about . Raman scattering was detected by using an air-cooled pixels CCD camera. Peak frequencies and rapid checking of instrumental performance were calibrated with the silicon phonon line at . Spectra were recorded and processed (for smoothing, baseline subtraction, and peak detection) by means of the Grams/32 software (Thermo Galactic). Profile data were then imported into Origin 7.0 software (Origin Lab Corporation). To minimize the autofluorescence of tissues under visible excitation, the CRS should be optimized by reducing the slit and CCD area to suppress fluorescence and achieve a better performance. Furthermore, laser bleaching was often employed, which means most samples should be irradiated by laser about to minimize its autofluorescence. This system had the highest spatial and spectral resolution; the laser was focused on a small spot within the sample. Theoretically, the size of laser spot in our experiments could be given by , and it was about . The laser beam was focused manually on individual spots by means of a microscope objective to a spot of 1 to in diameter. The power density was generally defined as the ratio of the power of the laser to the area of the spot, which means power density here was about . No differences were observed using 4-mW excitation laser between spectra collected for the same spot within consecutive duration focuses. Therefore, the spectra that were collected with such low excitation powers did not reveal changes that could be attributed to tissue heating.22 2.7.Immunohistological Analysis for -SMA in Liver TissuesA small sample of liver at the indicated time points was fixed in 10% buffered formalin and processed in paraffin wax. The liver sections were deparaffinized and immunochemical staining was performed. The dewaxed formalin fixed sections were subjected to microwave heat antigen retrieval in citrate buffer , pH 6.0, for (80 to . The following steps were the same as immunochemical staining for -SMA except that the incubation time of primary antibody was . Light microscopic examinations were made at magnification. 2.8.Autoclassifying System Based on Flow Cytometry and an Artificial Neural NetworkThis software system, integrating the high robustness of an artificial neural network (ANN) and the strong quantity estimation ability of flow cytometry (FCM), was designed in our group previously.23 It identifies regions of the sample that have similar spectral response by clustering the spectra into groups or clusters such that differences in the intracluster spectral responses are minimized while simultaneously maximizing the intercluster differences between spectral responses. To design neural network architecture, we must know how many clusters there are in the sample set. Also, a proper initial value of cluster centers to guarantee the convergence of algorithm should be available when FCM algorithm is used to classify. Supposing we do not know how many clusters there should be for a given set of data, a subtractive clustering method is a suitable one-pass algorithm for estimating the number and the value of cluster centers in a set of data. In the subtractive clustering algorithm, the number of clusters is increased gradually until the criterion to stop adding new clusters is reached. 3.Results3.1.HSC IdentificationAfter isolation of the HSCs, identification was performed by several methods. Phase-contrast microscopy of the freshly isolated cells demonstrated that HSCs appeared as small, dark cells with a granular cytoplasm [Fig. 1a ]. In Fig. 1b, the characteristic quick-fading autofluorescence (blue/green fluorescence) of retinoid droplets were observed in cells by fluorescence microscopy. By immunochemical staining, the freshly isolated cells were identified as desminpositive HSCs (brown yellow in cytoplasm) [Fig. 1c]. 3.2.HSC and Liver Tissue Raman SpectraThe CRS technique yielded a rapid acquisition of high SNR (signal-noise-ratio) Raman spectra of the liver tissues and HSCs using 514.5 nm laser irradiation. Figure 2a shows average Raman spectra of the freshly isolated, 4th, 8th, and 12th day HSCs cultured on plastic. The frequencies of the Raman bands and some tentative assignments are given in Table 1 . The Raman bands of HSCs, including the quiescent and activated HSCs, resulted primarily from protein and retinoid, such as amide I at ; amide III in the 1250 to region; (or ) deformation vibration of protein at , stretch (backbone) vibration of proteins at 1130, 1065, and ; and twisting and wagging vibration at . Furthermore, there were more specific Raman bands for smaller molecular compounds, such as the very characteristic sharp band for ring-breathing vibration of phenylalanine at and , which appeared in all protein-containing samples. Figure 2b shows the average Raman spectra of the eighth day HSCs (about 980 to ), including the original (bottom) and subsequent second derivative spectrum (top). The band at can be seen with difficulty, due to overlapping of the vibration of phenylalanine, but definitely appears in its second-derivative spectrum. On the other hand, vibrational modes of retinoid also appeared in the spectra of two types of cells and showed obvious decrease accompanying the HSCs activation, such as the band at , which can be assigned to stretching vibration of retinoid, and the band at 1364 and , which may be assigned to symmetrical deformation and in-plane deformation vibration of retinoid, respectively. Fig. 2(a) Average Raman spectra of the freshly isolated, 4th, 8th, and 12th day HSCs cultured on plastic, where the inset shows the molecular formula of retinoid, and (b) average Raman spectra of the eighth day HSCs (980 to ), with the original spectrum at the bottom and the subsequent second-derivative spectrum at the top. 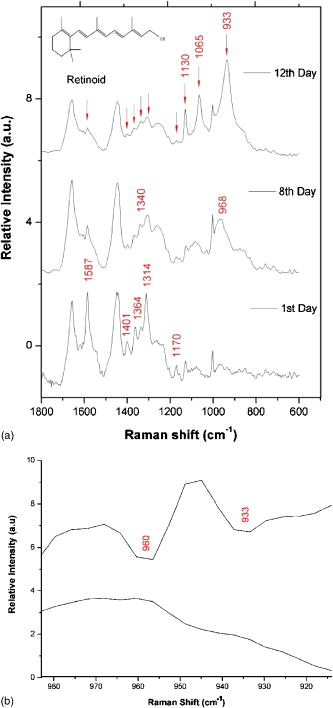 Figure 3 shows a series of average Raman spectra obtained from normal and injured rat liver tissues sections at the indicated time points including 4, 12, 24, 32, 48, and after injection. The primary Raman bands of tissues were observed at 1660, 1640, 1587, 1450, 1400, 1364, 1340, 1314, 1174, 1127, and . There were nearly no macroscopic differences among these spectra except for bands at 1660 and , which should be assigned12 to vibration of amide I. This is described in detail in the following part. 3.3.Immunochemical Staining for -SMAThe immunochemical staining (see Fig. 4 ) result of -SMA (the marker of HSC activation) in vitro cultured HSCs showed that there were no expressions for the freshly isolated HSCs [Fig. 4a] and gradually increased during culture [brown yellow in cytoplasm seen in Figs. 4b, 4c, 4d]. For liver tissues sections, the area and extent of -SMA positive expression showed a maximal increase at the 32nd h from the 4th h after injection and gradually decreases after the 32nd h. The maximum of fatty infiltration, hepatocellular necrosis and the highest degree of lysosomal damage developed also at the 32nd hour, seen in Fig. 5d , in which there were nearly no intact hepatocytes could be observed. 3.4.Data ProcessingSince the same chemical bond always presents different Raman bands in different chemical circumstances, only the relative intensity of the respective Raman band is a reasonable index. Generally, the Raman band with highest intensity can be selected as an internal standard. In our study, the Raman band at that should be assigned to retinol is the best choice used for normalization. The spectra of HSCs or liver tissues were obtained directly after laser exposure, and reveal a broad, featureless, and strong fluorescence background of specimens with 11 superimposed sharp Raman peaks. Normalized relative intensity of peak values of 11 Raman bands ( , , , , , , , , , , and ) were used as the first 11 elements of feature vector . In addition to 11 normalized intensity of these Raman bands, one important relative intensity value of Raman shift were supplemented into our feature vector according to the elucidation mentioned above: (amide I vibration of collagen). Raman spectra from 48 rat liver tissues of different injury degree were used to build and train our autoclassifying system. The six cluster center features are presented in Fig. 6 . All the spectra of liver tissues were divided into six clusters corresponding to six time points, respectively. Table 1Raman bands position and tentative assignments of quiescent and activated HSCs.
Abbreviations: bk; backbone; def., deformation; Phe, phenylalanine 4.Discussion4.1.In Vitro Activation of HSCs: Loss of Retinoid, Decrease of Hemoglobin, but Increase of -Helical ProteinFrom Fig. 2a, note that the relative intensity of band at in the freshly isolated HSCs became weaker step by step with the process of HSC in vitro activation. The band at may be attributed to stretching vibration of retinoid [the inset in Fig. 2b showed its molecular formula] according to related study in which Failloux 24 demonstrated that the wavenumber of the more symmetrical stretching mode of retinol and all detected photoproducts, were expected to fall between 1500 and . Retinoid (vitamin A), a primary alcohol consisting of a -ionone core and a conjugated polyene chain (see the inset in Fig. 2), is important in many essential biological processes, including vision, glycoprotein synthesis, and reproduction, immunology, and cell growth.25 The other two bands at 1364 and in the spectra, which should be attributed to symmetrical deformation vibration and in-plane deformation vibration, also confirmed that the band at should be surely attributed to stretching mode of retinoid. Generally, the liver is a major organ of retinoid metabolism and storage, and more than 80% of the liver retinoid is stored in HSCs. Photographs of phase-contrast microscopy and fluorescence microscopy are shown in Fig. 1. It is obvious that lipid droplets existed in the freshly isolated HSCs. Other methods, such as transmission electronic microscopy (TEM), can also be used to observe the retinoid droplets with different size in the cytoplasm of quiescent4 HSC. According to the already mentioned assignment of Raman bands, the consistent decreases associated with these three bands (1587, 1364, and ) undoubtedly proved that HSC in vitro activation resulted in the significant loss of retinoid droplets. Now the question arises about the metabolite of retinoid during the process of HSC activation. Okuno presumed that the increased 9, 13-di-cis-retinoic acid (one of retinoid metabolites) in fibrotic liver may have a potential link between retinoid loss and transforming growth factor (TGF)- mediated fibrogenesis in vivo.26 However, no significant increase of this product, whose characteristic Raman band should appear in the region of 1500 to , was observed in our study. In addition, there were three Raman bands at 1130, 1065, and were obvious. These bands were all related to the modes of the stretch vibration in protein.12, 27 Especially, the band at is usually used to characterize the secondary structure of protein and here should be assigned to the stretching vibration of -helical protein. Generally, Raman spectroscopy has proved to be a very sensitive technique characterizing the secondary structure of protein.12 Here, we question how to understand the obvious increase for the relative intensity of band at . It is well known that in vitro activation of HSCs associated with overexpression of -SMA, and -SMA is a kind of cytoskeleton and also an -helical protein; its accumulation for HSC activation may be the main reason12, 27 of the intensity increase of Raman band at . As shown in Fig. 2a, the 12th HSCs displayed increased intensity at , which indicates a greater content of the protein with -helix structure known to exist in activated HSCs, because they contain -SMA rather than quiescent ones. Due to overlapping of the vibrations of phenylalanine, the spectral profile with a signal attributable to the Raman band at was difficult to be observed, but definitely appeared in its second-derivative spectrum for the 8th day HSCs [shown in Fig. 2b]. This suggested the protein with -helix structure ( -SMA) could be detected when its content increased gradually along with in vitro HSC activation. If the period of in vitro HSC activation was divided into early, middle, and later stages, the 8th and 12th days should correspond to middle and later stages, respectively. When the phenotype of HSCs was changing into myofibroblast-like cells (namely, in the 12th day HSCs) completely, CRS could sensitively characterize their rapid molecular changes. Accordingly, the result of -SMA immunocytochemistry analysis also (see Fig. 4) showed that there is no expression for the freshly isolated HSCs but distinct expression for the 12th day HSCs, which confirm our results of Raman detection. 4.2.In Vivo Activation of HSCs: The Increase of Collagen in Liver TissuesAs shown in Fig. 3, the ratio of the relative intensity of bands at 1640 and showed regular changes from the bottom to top of the spectrum. In detail, this ratio, namely, starting from hour 4 gradually increased until hour 32 and subsequently decreased step-by-step by hour 64. The top profile represented the Raman spectrum of normal liver tissue and looked the same with that of the injured tissue, which indicated that rat liver had been recovered from the injury state completely. It was determined that Raman band at should be assigned to a characteristic vibration mode of collagen.12 Why did the content of collagen show a maximal increase at hour 32 in this case? What was the relationship among rat liver injury, increased collagen, and even HSCs in vivo activation? Lee identified HSC proliferation and showed a maximal increase at hour 32 after injection,5 and our immunohistogical study (Fig. 5) also showed a positive increase for -SMA and maximal degree of hepatocytes injury at hour 32 after injection. These suggested HSC in vivo activation and the degree of liver injury achieve to a peak about at hour 32 after a single injection of . The major function of activated HSCs in liver injury was to secrete extracellular matrix (ECM) containing fibril-forming collagens. Therefore, the ratio of a characteristic vibration mode of collagen may be regarded as the extent of HSC activation in vivo and the degree of liver injury. 4.3.Spectral Clustering Analysis of Liver Tissues Using the Autoclassifying SystemRaman spectroscopy is an efficient technique applied to characterization of HSCs, but an important aspect that should not be underestimated is that the type of information obtained through Raman spectroscopy may be new to hepatologists. In addition, Raman spectroscopy will potentially be utilized to study the HSC activation in vivo in the near future, and it is urgent determine a way to automatically accomplish the judgment of HSC activation. According to empiric and some criteria a conclusion can be safely drawn that cluster in Fig. 6a has the highest probability to be a 32nd hour tissue and the cluster in Figs. 6e and 6f has the highest probability to be normal tissue (see Fig. 6). It can be easily determined that the cluster in Fig. 6a has a high intensity at , and this band is always assigned to amide I stretching of collagen and represents more collagen in the liver tissue as result of HSC in vivo activation, which is a distinct sign of HSC in vivo activation. Another set of 20 samples was used to test our classifying system. The result is almost the same as the result classified by hand, and only two spectral data conflict with the result of hand classifying, which means a 90% accuracy rate. Considering the relatively small initial training set, this result is satisfactory. Also compared with accuracy rates of 85 and 75% for the FCM method alone and the ANN method alone, respectively, the combination of FCM and ANN is recommended. To achieve improvement and facilitate the perspective application in clinic application, future work will focus on building an expert knowledge database for proper choice of feature vector and optimizing the design of ANN structure and clustering method. 5.ConclusionsThis paper demonstrated the application of Raman spectroscopy to study HSCs and obtain satisfactory results consistent with other methods. The spectroscopic results revealed that Raman analysis of single isolated HSC cultured on plastic and induced injury rat liver tissue provide a novel, rapid, reagent free, and nondestructive technique for study of HSCs in vitro and in vivo activation. A tentative user-friendly autoclassifying system was applied to classify Raman spectra of rat liver tissues and provided more credible classifying results for automatically evaluating the degree of HSC in vivo activation. Liver fibrosis is reversible, whereas cirrhosis, the end-stage consequence of fibrosis, is generally irreversible. Thus, efforts to slow the progression of fibrosis focus primarily on events that lead to the early accumulation of scarring, in hopes of identifying its molecular changes. A liver biopsy analyzed with connective tissue stains has long been considered the “gold standard” for assessing liver histology, disease activity, and liver fibrosis. However, biopsy is associated with potential morbidity and mortality, and has several limitations.28 Raman spectroscopy in conjunction with a fiber optic probe can potentially accomplish in vivo, in situ monitoring for the molecular changes of the early accumulation of scarrings, and further whether the liver fibrosis is reversible or has evolved to liver cirrhosis. Accordingly, this technique shows considerable promise as an accurate diagnostic test for early liver fibrosis clinically, and we think it will be of interest for a wide range of scientists in this field. AcknowledgmentsThe authors gratefully acknowledge all the staff of Institute of Analytical Biomedicine (IAB), Wuhan University, for their generous cooperation. This project was supported by the National Natural Science Foundation of China under Grants 20405011, 90409013, 30371666, and 20375029. ReferencesA. Reuben,
“Ito becomes a star,”
Hepatology (Philadelphia, PA, U.S.), 35 503
–504
(2002). 0270-9139 Google Scholar
R. Blomhoff,
M. H. Green,
J. B. Green,
T. Berg, and
K. R. Norum,
“Vitamin A metabolism: new perspectives on absorption, transport, and storage,”
Physiol. Rev., 71 951
–990
(1992). 0031-9333 Google Scholar
S. L. Friedman,
“Molecular regulation of hepatic fibrosis, an integrated cellular response to tissue injury,”
J. Biol. Chem., 275 2247
–2250
(2003). 0021-9258 Google Scholar
T. Wu and
G. J. Teng,
“Culture and identification of the rat hepatic stellate cells,”
Mod. Med. J., 32 303
–306
(2004). Google Scholar
J. I. Lee,
K. S. Lee,
Y. H. Paik,
Y. N. Park,
K. H. Han,
C. Y. Chon, and
Y. M. Moon,
“Apoptosis of hepatic stellate cells in carbon tetrachloride induced acute liver injury of the rat: analysis of isolated hepatic stellate cells,”
J. Hepatol, 39 960
–966
(2003). 0168-8278 Google Scholar
R. Whalen,
D. C. Rockey,
S. L. Friedman, and
T. D. Boyerl,
“Activation of rat hepatic stellate cells leads to loss of glutathione s-transferases and their enzymatic activity against products of oxidative stress,”
Hepatology (Philadelphia, PA, U.S.), 30 927
–933
(1999). 0270-9139 Google Scholar
S. Vogel,
R. Piantedosi,
J. Frank,
A. Lalazar,
D. C. Rockey,
S. L. Friedman, and
W. S. Blaner,
“An immortalized rat liver stellate cell line (HSC-T6): a new cell model for the study of retinoid metabolism in vitro,”
J. Retin. Res., 41 882
–893
(2000). Google Scholar
G. J. Puppels,
F. F. de Mul,
C. Otto,
J. Greve,
M. Robert-Nicoud,
D. J. Arndt-Jovin, and
T. M. Jovin,
“Studying single living cells and chromosomes by confocal Raman microspectroscopy,”
Nature (London), 347 301
–303
(1990). https://doi.org/10.1038/347301a0 0028-0836 Google Scholar
I. Notingher,
S. Verrier,
S. Haque,
J. M. Polak, and
L. L. Hench,
“Spectroscopic study of human lung epithelial cells (A549) in culture: living cells versus dead cells,”
Biopolymers, 72 230
–240
(2003). https://doi.org/10.1002/bip.10378 0006-3525 Google Scholar
I. Notingher,
G. Jell,
U. Lohbauer,
V. Salih, and
L. L. Hench,
“In situ non-invasive spectral discrimination between bone cell phenotypes used in tissue engineering,”
J. Cell. Biochem., 92 1180
–1192
(2004). 0730-2312 Google Scholar
G. Deinum,
D. Rodriguez,
T. J. Römer,
M. Fitzmaurice,
J. R. Kramer, and
M. S. Feld,
“Histological classification of Raman spectra of human coronary artery atherosclerosis using principal component analysis,”
Appl. Spectrosc., 53 938
–942
(1999). https://doi.org/10.1366/0003702991947829 0003-7028 Google Scholar
A. Mahadevan-Jansen and
R. Richards-Kortum,
“Raman spectroscopy for the detection of cancers and precancers,”
J. Biomed. Opt., 1 31
–70
(1996). https://doi.org/10.1117/1.2169477 1083-3668 Google Scholar
C. D. Sudworth and
N. Krasnera,
“Raman spectroscopy of Alzheimer’s diseased tissue,”
Proc. SPIE, 5321 93
–101
(2004). 0277-786X Google Scholar
A. G. Shen,
Y. Ye,
X. H. Wang,
C. C. Chen,
H. B. Zhang, and
J. M. Hu,
“Raman scattering properties of human pterygium tissue,”
J. Biomed. Opt., 10 024036
(2005). https://doi.org/10.1117/1.1888345 1083-3668 Google Scholar
P. Rösch,
M. Harz,
M. Schmitt, and
J. Popp,
“Raman spectroscopic identification of single yeast cells,”
J. Raman Spectrosc., 36 377
–379
(2005). https://doi.org/10.1002/jrs.1312 0377-0486 Google Scholar
P. J. Caspers,
A. C. Williams,
E. A. Carter,
H. G. M. Edwards,
B. W. Barry,
H. A. Bruining, and
G. J. Puppels,
“Monitoring the penetration enhancer dimethyl sulfoxide in human stratum corneum in vivo by confocal Raman spectroscopy,”
Pharm. Res., 19 1577
–1580
(2002). https://doi.org/10.1023/A:1020481305420 0724-8741 Google Scholar
S. R. Hawi,
W. B. Campbell,
A. Kajdacsy-Balla,
R. Murphy,
F. Adar, and
K. Nithipatikom,
“Characterization of normal and malignant human hepatocytes by Raman microspectroscopy,”
Cancer Lett., 110 35
–40
(1996). 0304-3835 Google Scholar
T. Oinonen,
T. Koivisto, and
K. O. Lindros,
“No significant expression of CYP2E1 in rat liver stellate cells,”
Biochem. Pharmacol., 15 1075
–1107
(1998). 0006-2952 Google Scholar
A. G. Shen,
Y. Ye,
J. W. Zhang,
X. H. Wang,
J. M. Hu,
W. Xie, and
J. Shen,
“Screening of gastric carcinoma cells in the human malignant gastric mucosa by confocal Raman microspectroscopy,”
Vib. Spectrosc., 37 225
–231
(2005). 0924-2031 Google Scholar
K. C. Schuster,
I. Reese,
E. Urlaub,
J. R. Gapes, and
B. Lendl,
“Multidimensional information on the chemical composition of single bacterial cells by confocal Raman microspectroscopy,”
Anal. Chem., 72 5529
–5534
(2000). 0003-2700 Google Scholar
K. Maquelin,
L. P. Choo-Smith,
T. van Vreeswijk,
H. P. Endtz,
B. Smith,
R. Bennett,
H. A. Bruining, and
G. J. Puppels,
“Raman spectroscopic method for identification of clinically relevant microorganisms growing on solid culture medium,”
Anal. Chem., 72 12
–19
(2000). https://doi.org/10.1021/ac991011h 0003-2700 Google Scholar
M. G. Shim and
B. C. Wilson,
“The effect of ex vivo handling procedures on the near-infrared Raman spectra of normal mammalian tissues,”
Photochem. Photobiol., 63 662
–671
(1996). 0031-8655 Google Scholar
Y. Y. Tan,
A. G. Shen,
J. W. Zhang,
N. Wu,
L. Feng,
Q. F. Wu,
Y. Ye, and
J. M. Hu,
“Design of auto-classifying system and its application in Raman spectroscopy diagnosis of gastric carcinoma,”
1360
–1363
(2003). Google Scholar
N. Failloux,
I. Bonnet,
E. Perrier, and
M. H. Baron,
“Effects of light, oxygen and concentration on vitamin A1,”
J. Raman Spectrosc., 35 140
–147
(2004). 0377-0486 Google Scholar
M. J. O’Connell,
R. Chua,
B. Hoyos,
J. Buck,
Y. Chen,
F. Derguini, and
U. Hämmerling,
“Retro-retinoids in regulated cell growth and death,”
J. Exp. Med., 184 549
–555
(1996). 0022-1007 Google Scholar
M. Okuno,
T. Sato,
T. Kitamoto,
S. Imai,
N. Kawada,
Y. Suzuki,
H. Yoshimura,
H. Moriwaki,
K. Onuki,
S. Masushige,
Y. Muto,
S. L. Friedman,
S. Kato, and
S. Kojima,
“Increased 9,13-di-cis-retinoic acid in rat hepatic fibrosis: implication for a potential link between retinoid loss and TGF-beta mediated fibrogenesis in vivo,”
Hepatology (Philadelphia, PA, U. S.), 30 1073
–1080
(1999). 0270-9139 Google Scholar
C. Kraffta,
T. Knetschke,
A. Siegner,
R. H. W. Funk, and
R. Salzer,
“Mapping of single cells by near infrared Raman microspectroscopy,”
Vib. Spectrosc., 32 75
–83
(2003). 0924-2031 Google Scholar
S. L. Friedman,
“Liver fibrosis—from bench to bedside,”
Hepatology (Philadelphia, PA, U. S.), 38 S38
–S53
(2003). 0270-9139 Google Scholar
|


