
|
|
1.IntroductionA number of different types of nanoparticles have recently been proposed for use as optical imaging agents to aid in cancer detection, including quantum dots (qdots),1, 2, 3 nanoshells,4 and metal nanoparticles.5 The use of nanoparticles for molecular imaging of cancer has several important advantages. Their surface chemistry is well understood, so they can be easily targeted using antibodies or aptamers to bind to cancer biomarkers. By adjusting the particle geometry, the optical properties can be tuned over a large spectral region to provide multicolor labeling. The bright reflectance or luminescence of nanoparticles provides a strong source of signal for in vivo imaging. Last, multiplexing different types of particles and targeting molecules provides a common platform for multiple applications with a high degree of flexibility.2 While qdots have shown promise in preclinical cellular and animal studies, they possess a number of disadvantages for clinical use. Qdots are generally composed of very toxic materials, raising concerns about their potential use in humans. Although qdots offer greatly improved photostability, they still are not completely resistent to photobleaching;6 this, in combination with “blinking” effects, can complicate the development of qdot-based ultrasensitive imaging techniques. Last, tissue autofluorescence in vivo occurs in the same spectral region as the luminescence of some of the most widely used qdots and can be difficult to separate from the contrast agent signal.1 The use of metal nanoparticles as contrast agents for in vivo molecular imaging offers a number of advantages over both qdots and organic fluorescent dyes. Similar to qdots, the optical properties of metal particles can be systematically changed by varying particle size and geometry.5, 7 However, the very high scattering cross section of metal nanoparticles as compared with the fluorescence cross sections of organic dyes and even qdots provides a much brighter source of signal with complete immunity to photobleaching.5, 8, 9 Metal nanoparticles, particularly gold, offer an inert, biocompatibile alternative to qdots; gold is already used in routine clinical treatment of arthritis.10 Last, the strength and the wavelength characteristics of the scattered signal from metal nanoparticles is sensitive to the nanoscale spacing of individual particles.9, 11, 12 This property provides a tool not only to monitor overexpression of a biomarker, but also to monitor biomarker interactions and activation and to increase contrast between images of normal and cancerous tissue beyond the limited contrast provided by a fewfold overexpression level. Nanotechnology offers an opportunity to probe the molecular and cellular events of carcinogenesis in real time and the ability to monitor the impact of therapeutic interventions. However, there are a number of barriers to achieve this potential, including development of:
We present a study to address these barriers in detection of epithelial precancers, which account for up to 90% of all initial malignant changes. Recently, the potential of gold nanoparticles for molecular specific imaging was demonstrated in cell culture models of oral cancer using a combination of dark field optical microscopy and white light illumination.13 In this paper, we bring together molecular-specific contrast agents that are based on gold nanoparticles, topical formulations for their delivery in vivo, and noninvasive confocal reflectance microscopy to demonstrate detection of molecular changes in models of epithelial precancers ranging from cell tissue cultures to preclinical in vivo animal models, as shown conceptually in Fig. 1 . Integrating these tools, we focus on imaging one of the hallmarks of cancer—the uncoupling of a cell’s growth program from environmental signals. Specifically, we describe imaging of the epidermal growth factor receptor (EGFR), which is associated with carcinogenesis in many epithelial cancers including lung, oral cavity, and cervix.14 There is good consensus that EGFR levels demonstrate a statistically significant increase as lesion severity progresses from earlier dysplasia to invasion.15, 16 It has been also demonstrated that EGFR function and activation is associated with dimerization and concurrent higher order aggregation of receptor molecules.17 2.Materials and Methods2.1.Anti-EGFR Contrast AgentsWe synthesized 25-nm gold nanoparticles via sodium citrate reduction of gold tetrachloride (Sigma). The conjugates of gold nanoparticles with anti-EGFR monoclonal antibodies were prepared using the method that was originally developed for preparation of gold immunostains for electron microscopy.18, 19 Briefly, of anti-EGFR antibodies (clone 225, Neomarkers, or clone 29.1, Sigma), in a 40-mM HEPES buffer, pH 7.4, were mixed for 20 to with an equal volume of gold nanoparticles at approximately particles per mL. Conjugates were centrifuged at 3000 rcf for 1 to in the presence of 1% PEG and resuspended at particle concentration in a PBS buffer, pH 7.4 containing 1% BSA and 0.2% PEG. Bifunctional contrast agents were synthesized via a monoclonal antibody labeling kit (Molecular Probes) to attach fluorescein or Alexa Fluor 647 dye to purified antibodies via a succinimidyl ester reaction that forms linkages between the dye and primary amines on the antibody. Fluorescently labeled antibodies were then conjugated with gold nanoparticles as described earlier. 2.2.Cell CulturesCells were cultured in DMEM (A-431, MDA-MB-435) or MEM (MDA-MB-468) plus 10% FBS and grown at in 5% . Cells suspensions were labeled in a 50:50 (v/v) mixture of phenol/serum-free DMEM and contrast agents for at room temperature. 2.3.Cell Specificity AssaysFor the competition assay, SiHa cervical cancer cells were incubated with a mixture of anti-EGFR gold conjugates and unlabeled anti-EGFR mAbs at molar ratio in phenol-free medium for a period of at room temperature under mild mixing. The cells were then washed in the media and imaged using confocal microscopy in reflectance mode. For the displacement assay, SiHa cells were first labeled with anti-EGFR gold nanoparticles for at room temperature. The cells were then washed and exposed to an excess of unlabeled anti-EGFR mAbs (concentration ) for . Following incubation, the cells were imaged using reflectance confocal microscopy. Cells labeled with anti-EGFR gold nanoparticles alone were used as a positive control, and cells incubated with gold conjugates with nonspecific IgG were used as a negative control for labeling efficiency. The assays showed a tenfold or more decrease in the scattering signal of cells either labeled in the presence of unlabeled anti-EGFR mAbs or incubated with the unlabeled Abs after labeling with anti-EGFR gold conjugates. 2.4.Tissue PhantomsIn vivo molecular imaging requires development of efficient delivery systems of contrast agents to their targets. We used dimethyl sulfoxide (DMSO) to promote topical delivery of anti-EGFR gold conjugates. DMSO was chosen because of its permeation efficiency and high aqueous solubility and because it is already FDA-approved for human use20 in certain applications. We fabricated heterogeneous three-dimensional (3-D) tissue constructs that consisted of a 1:1 high-density mixture of MDA-MB-468 and MDA-MB-435 breast cancer cells. and cell lines were labeled with membrane-permeable derivatives of fluorescein and seminaphthorhodafluors (SNARF), respectively, which fluoresce only when they are inside the cells. Cells were incubated with membrane permeable derivatives of fluorescein and seminaphthorhodafluors (SNARF; Molecular Probes), respectively, in DMEM for and washed. The dyes are rendered membrane permeable via a chloromethyl group that is enzymatically cleaved upon entering a viable cell. Thus, once in the cytosol, the dye becomes membrane impermeable and does not exit the cell. A 1:1 (v/v) mixture of the two cell lines was resuspended in a 1-mg/mL buffered (pH 7.4) collagen solution (Roche) at a concentration of approximately 80 to cells per mL. A 200 to -thick disk of the cell/collagen mixture was coated onto a permeable membrane (Corning) and left to proliferate overnight in the incubator. Phantoms were topically exposed to of contrast agents (at particles per mL) in a PBS solution containing 10% DMSO for , briefly washed in media, and transversely sectioned using a Krumdieck slicer. 2.5.Tissue Phantom Specificity AssaysFor homogeneous phantoms used in the specificity assays, 3-D tissue cultures with SiHa cells were prepared using the method described earlier for the heterogeneous phantoms. First, phantoms were treated with unconjugated anti-EGFR mAbs. The mAbs were topically delivered in PBS with 10% DMSO at the concentration of for at . Immediately after this initial application, anti-EGFR gold nanoparticles were topically applied in the same solution for . The cultures were then washed in PBS, transversely sliced, and imaged using reflectance confocal microscopy. Tissue cultures that were not preexposed to the unlabeled mAbs were used as a positive control for labeling efficiency. Each of these assays was repeated at least three times. The average grayscale values of reflectance signal intensity were computed by using the NIH ImageJ software. The ratio of unlabeled anti-EGFR mAbs to anti-EGFR gold nanoparticles was calculated based on the amount of mAbs conjugated to the nanoparticles. The amount of the attached Abs was determined using the number of nanoparticles ( particles/l), their diameter , and a previously published value of IgG antibody density on a gold surface (Ref. 21). We observed a more than tenfold decrease in the scattering signal of the cultures pretreated with unlabeled mAbs as compared to the positive control. These results illustrate the specificity of the anti-EGFR gold bioconjugates for EGFRs in 3-D tissue cultures. 2.6.Human Cervical BiopsiesClinically normal and abnormal cervical biopsies were obtained from consenting women seen at the Department of Gynecologic Oncology, M. D. Anderson Cancer Center. Biopsies were placed in chilled DMEM and later embedded in a 3% agarose gel such that only the epithelial surface was exposed. We applied of contrast agents (at particles per mL) in PBS containing 10% DMSO (v/v) to the surface for at room temperature. Biopsies were then transversely sectioned and imaged. After imaging, samples were placed in 10% formalin and submitted for histological evaluation. To evaluate whether the presence of dysplasia can compromise the barrier function of the epithelium, we prepared dual fluorescent/reflectance contrast agents using anti-EGFR mAbs labeled with Alexa Fluor 647 dye and then conjugated to gold particles. The bifunctional contrast agents were topically applied to a pair of normal and precancerous (CIN 2) cervical biopsies. The excess contrast agent was removed, and two types of optical measurements were performed. First, a ball lens fiber optic probe22 was used to measure the fluorescence of the Alexa Fluor 647 dye that is proportional to the total uptake of the dual contrast agent. Second, the biopsies were transversely sliced and imaged using fluorescence/reflectance confocal microscopy to study the spatial distribution of the agent. 2.7.Hamster Cheek Pouch ModelTen Golden Syrian hamsters were treated 2 to 3 times weekly with a 0.5% solution of dimethyl benz anthracene (DMBA) in mineral oil on the right mucosal side of the cheek pouch under the supervision of a small animal veterinarian. Two nontreated, separately housed animals functioned as normal controls. After anesthetization with ketamine, the cheek pouch was inverted, and 200 to of contrast agent (at particles per mL) was applied topically in PBS containing 10% DMSO (v/v) for 15 to . Contrast agent exposure times were shorter than those used for biopsies due to the relatively short anesthetization times that are safely attained using ketamine. After washing, the hamsters were imaged using a portable reflectance confocal microscope.23 Immediately following, biopsies were taken from the imaged area of the cheek pouch and submitted for histological analysis. All animals were treated under guidance from the institutionally approved IACUC protocol study standards. 2.8.Topical Delivery of Polystyrene Spheres Ex VivoPig tissue from the oral cavity was obtained from a freshly harvested pig head. Cheek oral epithelial samples were cut in approximately 6-mm cubes. The specimens were embedded in an agarose gel with the epithelium exposed. Polystyrene fluorescent nanoparticles conjugated with neutravidin (Molecular Probes) were then topically applied for in solutions containing 10% DMSO or 5% Transcutol as permeation enhancers. Nanoparticles with 40- and were used. After incubation, the samples were washed, transversely sliced using the Krumdieck Tissue Slicer, and imaged under a fluorescence confocal microscope. The fluorophors were excited with a Ar laser and detected using a -long bandpass filter. 2.9.Optical ImagingDarkfield and fluorescence imaging of cells was performed using a Leica DM6000 upright microscope configured with a , 0.5-NA darkfield objective, fluorescence filter cubes (Chroma), and Xe light source. RGB images were captured using a Q-Imaging Retiga EXi CCD camera with color LCD attachment. Hyperspectral images were captured with a spectral imaging camera (Applied Spectral Imaging). Tissue phantoms were imaged using a Leica TCS-4D confocal microscope using 488-nm excitation and 515/10-nm bandpass filter (Fluorescein) and 514-nm excitation and 660-nm long pass filters (SNARF). Reflectance was acquired with 647-nm excitation. Cervical biopsies were imaged using a Leica SP2 AOBS confocal microscope. Reflectance images were obtained with 594-nm and 633-nm illumination. Bifunctional contrast agents were imaged with 633-nm excitation and 650 to emission bandwidth. Imaging of hamsters in vivo was carried out using a portable reflectance confocal microscope, which is described in Ref. 23. 2.J.Scanning Transmission Electron MicroscopyLabeled A-431 cells were absorbed onto a gold/carbon film grid and exposed to 5% buffered, pH 7.4 formaldehyde for at room temperature (RT). The cells were then dehydrated in a series of water/ethanol mixtures with increasing ethanol percentage from 10% to 25%, 50%, 75%, and finally 100% for in each solution. Subsequently, cells were fixed in 2% glutaraldehyde for , and the samples were then subjected to a series of ethanol/acetone exchanges in the same manner as described earlier for water/ethanol. After this treatment, the cells were placed in an automated /acetone critical point drying apparatus (Samdri-790, Tousimis Corp.), which avoids surface tension–induced disturbances of the cell surface during drying.24 Cells were imaged with a JEOL 2010F STEM equipped to image in Z-contrast mode. A HAADF detector (50 to ) was used for image acquisition with a probe size of . In addition, the JEOL STEM system contains atom-level probes connected to an Oxford INCA Energy Dispersive Spectrometer (EDS) to positively identify the presence of gold on the cellular surface. 2.K.Modeling of Light Scattering from Metal NanoparticlesFor incident collimated light of intensity , the total power scattered into a given differential solid angle from an assembly of particles may be expressed as: where is a factor analogous to the structure factor used to express scattering from large molecules or from refractive-index fluctuations in solids,25 and is the differential scattering cross section for a single particle in the forward direction (i.e., ). The structure factor includes the scattering effects of the geometry of the assembly of particles, including effects due to the phase shift of light scattered from distinct particles in the assembly.For aggregates of size sufficiently less than , the optical phase shift across the aggregate is minimal.26 In this case, taking the wavelength and angular integration of Eq. 1 results in: where is the wavelength-integrated total scattering cross section. In the present analysis, the effects of plasmon coupling contribute at the second order and, therefore, can be neglected. This approximation was used to model the expected behavior of the scattering signal intensity from living cells labeled with anti-EGFR gold bioconjugates and indicates a quadratic dependence on the scattering cross section with respect to the number of particles in an aggregate.Simulation of the spectral shift for nanoparticle aggregate cross-sections was implemented through the use of a simple two-parameter effective-field model. The two model parameters correspond to the mean interparticle spacing in an aggregate and the largest aggregate size that contributes to the observed red shift. This model is a first-order approximation of a complex system of nanoparticle arrangement on the cytoplasmic membrane; however, it can be used to illustrate the major tendencies in scattering by nanoparticle aggregates. It is important to note that the contribution to the spectrum from large aggregates is significantly enhanced over that from smaller aggregates due to the coherent scattering enhancement discussed earlier. The aggregates were assumed to have planar geometry, which is appropriate for an arrangement of particles on the plasma membrane. A particle center-to-center spacing of 2.25 times the particle radius and a 91-particle aggregate size were found to give a spectrum consistent with the largest experimentally observed spectral shift. All simulations use the most widely accepted experimental permittivity data for gold, with appropriate corrections for the small particle size. The gold particle dimer simulation includes coupling through the dipole-dipole term, and this simulation is known to be quite accurate for the small particles that were used in this study. For the calculation of the total cross section, the average value is taken over polarization and dimer orientation.27 3.Results3.1.Optical Properties of Gold Nanoparticles for Molecular Imaging of Cancer In VivoWe imaged SiHa cells with a darkfield microscope equipped with a hyperspectral imaging system and color CCD cameras to study the color and spectral changes associated with labeling using anti-EGFR gold conjugates (Fig. 2 ). The conjugates were prepared using monoclonal antibodies, which do not interfere with biological activity of cells.28 The unlabeled cells appear blue due to the intrinsic cellular scattering [Fig. 2a]. The labeled cells have dim green regions and bright regions that are different shades of orange [Fig. 2b]. The green tinge is the color of the isolated nanoparticles, and it corresponds to regions with low density of bound contrast agent. The orange color corresponds to the closely spaced assemblies of anti-EGFR gold conjugates that interact with EGF receptors on the plasma membrane of SiHa cells. EGF receptors are known to form closely spaced assemblies in cancer cell membranes.29 Hyperspectral imaging reveals that there is more than a 100-nm red shift in light scattering associated with the orange-colored assemblies of the particles in SiHa cancer cells [Fig. 2c]. Fig. 2Color change in labeling of cancer cells. Darkfield images of unlabeled (a) and labeled (b) SiHa cells. Hyperspectral images reveal spectral information (c) at individual pixels, as indicated by the [colored] arrows. The scattering peak from individual gold bioconjugates (maximum ) cannot be resolved in the hyperspectral data on the background of the scattering signal from cells (C, [green] curve). EGFR mediated aggregation of gold bioconjugates results in a significant increase in scattering intensity and shift of scattering maximum to the [red] region at (C, [red] curve). Scale bar is .  The wavelength shift of the maximum scattering cross section is attributed to changes in the local electric field in the vicinity of an individual particle due to the combined effects of the scattered electric fields from all other particles in the imaging voxel. The dominant contribution to interparticle coupling is from the dipole-dipole interaction, which depends on the cube of the interparticle distance.27 Therefore, the spatial arrangement of gold bioconjugates is key to understanding the observed color changes. To determine if experimental results correlate with theory, high-angle annular darkfield (HAADF) scanning transmission electron microscopy (STEM) pictures were obtained of whole labeled cells [Figs. 3a and 3b ]. The observed distribution of the nanoparticles is in good agreement with previously published reports on the organization of EGF receptors.29 The wavelength shift of the maximum scattering cross section from a nanoparticle aggregate is consistent with published theoretical results27 when estimates of mean interparticle distance are taken from the electron microscopy images [Fig. 3c]. A smaller red shift (5 to ) is predicted in the case of two isolated interacting nanoparticles [Fig. 3c]. Fig. 3Z-contrast scanning transmission electron microscopy (STEM) of whole cancer cells labeled with anti-EGFR gold nanoparticles [(a) and (b)]. Gold conjugates appear as white spheres. White circles in (a) highlight dimers of gold nanoparticles that reflect dimerization of EGFR molecules. Theoretically simulated spectra of scattering from a single gold nanoparticle [(C), ——], a nanoparticle dimer [(C), - - -], and from a larger assembly of particles . Each spectrum in (c) is normalized to one. 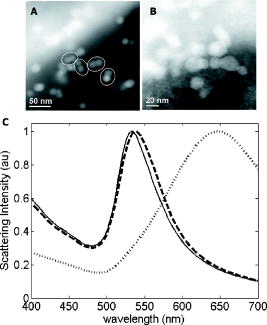 To study the intensity behavior of optical scattering from nanoparticle labeled cells, we labeled cancer cells using bifunctional anti-EGFR contrast agents (Fig. 4 ). These agents consisted of fluorescently labeled mAbs conjugated with gold nanoparticles. We carried out fluorescence and darkfield reflectance measurements from the same labeled cells and plotted the values of reflectance signal versus fluorescence signal on a pixel-by-pixel basis. While the fluorescence signal intensity is proportional to the number of gold particles in each pixel, the intensity of darkfield reflectance is proportional to the scattering cross section of the gold nanoparticle assemblies. The experimental data of Fig. 4 agree well with the theoretically predicted quadratic dependence of the scattering cross section on aggregate size (see Sec. 2K). Because labeling with gold bioconjugates can give information on both the overexpression and nanoscale spatial relationship of EGF receptors in the cell membrane, both of which are altered in neoplasia, it can significantly increase the image contrast between normal and EGFR overexpressing cancer cells. In contrast, fluorescent labeling results in signal intensities that are linearly related to receptor concentration. Fig. 4Quadratic dependence of the total scattering cross section on the number of anti-EGFR gold conjugates. The inset displays fluorescence (left) and darkfield reflectance (right) images of A431 cells labeled with anti-EGFR fluorescein tagged antibodies conjugated to gold nanoparticles. The plot shows the relationship between the reflectance intensity from each pixel in the darkfield image and the fluorescence intensity from the same pixel in the fluorescence image . The experimental data agree well with the theoretically predicted quadratic dependence of the scattering cross section on the number of nanoparticles ( ; solid curve). The observed variations in the intensity of the darkfield pixel values can be explained by the accuracy of the optical measurements with an 8-bit CCD camera.  3.2.3-D Tissue CulturesFigure 5 shows transverse sections of topically labeled heterogeneous tissue phantoms and indicates that the reflectance signal (white) is localized to the periphery of the green cells. Little to no reflectance signal is associated with red cells. Results demonstrate that DMSO-mediated delivery does not adversely alter molecular specificity of the contrast agents and enables penetration through a thickness that corresponds to a typical epithelial layer. Fig. 5Heterogeneous 3-D tissue cultures. (a) Low-magnification fluorescence confocal image of a transverse section, showing distribution of cells in [green] and cells in [red]. (b) High-magnification image of the area indicated showing overlay of fluorescence image with corresponding reflectance image. Reflectance signal is shown in white. Scale bars are (a) and (b).  3.3.Human Cervical BiopsiesWhile 3-D tissue cultures remain a useful, reproducible preclinical tool, the use of human ex vivo tissue represents a more realistic and complex model. We analyzed a total of four colposcopically normal/abnormal biopsy pairs. Figure 6c summarizes the histopathologic diagnoses and the abnormal to normal reflectance intensity ratios after labeling. The reflectance intensity was integrated over the entire epithelial thickness. The histopathologic diagnoses range from changes associated with human papillomavirus infection to CIN 3 and represents several important steps in the progression of precancerous changes in the cervix. The reflectance intensity ratio increases with progression of carcinogenesis [Fig. 6c]; this correlates well with the increase of EGFR expression seen in precancer progression in the cervix.30 Fig. 6Confocal reflectance images of transverse sections of abnormal [(a), left] and normal [(a), right] cervical biopsies labeled with anti-EGFR gold conjugates. The image of the abnormal biopsy was obtained just above the basement membrane. Images of tissue intrinsic fluorescence were also collected (not shown) to independently confirm the presence of epithelial cells in the same field of view. Corresponding H&E staining of the abnormal [(b), left] and normal [(b), right] biopsies. An excitation wavelength of was used in (a). Scale bars are . In (c), the average signal intensity ratios between the abnormal and normal biopsy pairs were compared to the abnormal diagnosis in the four sample pairs collected. The abnormal/normal signal ratio increased monotonically with pathological severity.  Figure 6a shows representative confocal reflectance images of a normal cervical biopsy and a biopsy with severe dysplasia (CIN 3) labeled with anti-EGFR gold contrast agents. The abnormal specimen clearly shows a distinct “honeycomb” structure characteristic of EGFR labeling on cellular membranes. No distinct structures are visible in the normal biopsy. We observed signal intensity differences of up to 21-fold between normal and abnormal cases. The confocal reflectance and H&E stained images of the abnormal biopsy reveal very similar tissue architecture [Fig. 6b]. It is known that epithelial dysplasia can compromise the barrier function of the epithelium. To evaluate whether the “leaky roof” of dysplasia partially accounts for the increased signal intensity of precancerous biopsies, we used dual fluorescent/reflectance contrast agents topically applied to a pair of normal and precancerous (CIN 2) cervical biopsies. The abnormal to normal fluorescence intensity ratio, as measured by a ball lens fiber optic probe,22 was , indicating delivery of more contrast agent to the abnormal biopsy. The transversely sliced abnormal biopsy showed both fluorescence associated with the Alexa Fluor 647 dye [Fig. 7b ] and the strong reflectance signal associated with gold [Fig. 7a] throughout the entire epithelial thickness of . The fluorescence and reflectance were perfectly colocalized, as seen in Fig. 7c; this demonstrates that both signals are associated with the dual contrast agents. In contrast, fluorescence was observed to a depth of in the normal sample [Fig. 7e], and only very weak reflectance was detected, as shown in Fig. 7d. The reflectance intensity was times higher in the abnormal sample than in the normal, even in regions with similar fluorescence intensity of the Alexa Fluor dye (and therefore similar amounts of the contrast agent). The difference in the reflectance signal between the two samples can be attributed to EGFR-mediated clustering of gold bioconjugates in the abnormal sample. In the normal biopsy, nonbasal epithelial cells do not express substantial levels of EGFR molecules;30 therefore, the effect of contrast agent clustering is not significant. Fig. 7Topical delivery of bifunctional fluorescent/reflectance anti-EGFR gold nanoparticles in abnormal (CIN 2) [(a), (b), (c)] and normal [(d), (e)] cervical biopsies. The dual contrast agents were prepared using anti-EGFR mAbs labeled with Alexa Fluor 647 dye and then conjugated to gold particles. Reflectance confocal images [(a) and (d)] were obtained using 633-nm excitation, and fluorescence confocal images [(b) and (e)] were excited with and collected using a 650 to filter. Image (c) is the overlap of images (a) and (b). The absolute intensity of the reflectance signal (a) is -fold higher than the intensity of the fluorescence signal (b). The detector gain was adjusted to obtain both images at the same intensity level. The scale bar is .  3.4.In Vivo Hamster Cheek Pouch ModelLast, we demonstrated the efficacy of molecular-specific imaging with gold bioconjugates in vivo in the hamster cheek pouch carcinogenesis model. Histologically, the 16-week treatment with dimethyl benz anthracene (DMBA) pushes the epithelial lining of the cheek pouch through progressive dysplastic changes and ultimately carcinoma in situ.31 Anesthetized hamsters were imaged with a portable reflectance confocal microscope described in Ref. 23 immediately before and after topical application of anti-EGFR gold nanoparticles. Figure 8 shows results of in vivo imaging of the cheek pouch of the same hamster at different points of the study. The images in Fig. 8a were obtained before the beginning of treatment with the carcinogen, and the images in Fig. 8b show the results after 3 weeks of treatment. Although the contrast agents were applied in both imaging sessions, cell-membrane morphology characteristic for labeling of EGF receptors and a significant increase in scattering intensity after the application of gold bioconjugates were observed only after the animal was treated with DMBA [Fig. 8b right]. The contrast in the images between the normal animal [Fig. 8a right] and the animal with early neoplastic changes [Fig. 8b right] after the application of the contrast agents exceeds 10 times. Figure 8a, left, and (b), left, indicate the appearance before application of contrast agents. The imaging results were confirmed using EGFR immuno-histochemical staining of cheek pouch biopsies taken from the areas that were imaged in vivo [Fig. 8c]. These results clearly demonstrate the possibility of molecular-specific imaging with topically delivered gold bioconjugates. However, they were not always repeatable. We attribute the difficulty in topical delivery of the nanoparticles to extremely high levels of superficial keratin expressed in the hamster buccal mucosa. The thick layer of keratin represents a significant barrier against topical delivery of not only nanoparticles and macromolecules but even small molecules like acetic acid. Fortunately, such elevated levels of surface keratin are not characteristic for human epithelial tissues. Therefore, future preclinical evaluation of topical delivery of contrast agents should be focused on animal models with levels of keratin expression that are more representative of human epithelium. Fig. 8In vivo confocal reflectance imaging of EGFR overexpression in a hamster model. Images shown are obtained from the same hamster before the beginning of the treatment with carcinogen DMBA (a) and after 3 weeks of DMBA treatment (b). The images were taken immediately before [(a), left, and (b), left] and after [(a), right, and (b), right] topical application of the anti-EGFR gold conjugates. EGFR immuno-histochemical staining (c) reveals elevated EGFR levels in the DMBA-treated animal [(c), right] and very low levels of EGFR expression before DMBA treatment [(c), left]. The scale bars are .  Fig. 9Topical delivery of fluorescently labeled polymeric nanospheres coated with neutravidin to the oral cavity epithelium of a pig ex vivo using 10% DMSO as a permeation agent (a) and 5% Transcutol (b). Fluorescence confocal images are shown in the left column, while the fluorescence signal overlaid with the transmittance signal is shown in the right column. The scale bar is . 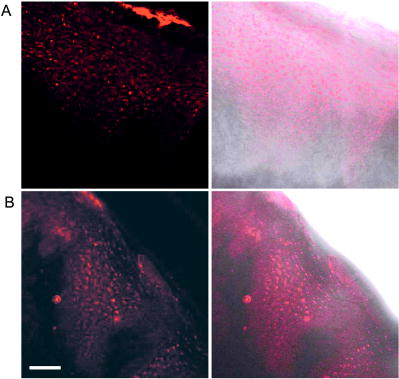 4.ConclusionIt is known that the optical properties of metal nanoparticles undergo dramatic changes when two or more particles are in close vicinity12 to each other. These include an increase in the scattering cross section per particle and a red shift in the plasmon resonance frequency (color change). Recently, these properties were exploited to develop ultrasensitive assays in vitro, 5, 8, 9, 11, 32, 33 as well as for photothermolysis applications.34 Some of the most promising directions in this area focus on exploiting plasmon resonance coupling between adjacent nanoparticles for DNA probe assays.11, 32, 33 Here, we used cancer cells labeled with anti-EGFR gold conjugates to demonstrate how these nonlinear optical properties can translate into high-contrast molecular imaging of cancer biomarkers in living cells. EGFR-mediated nanoparticle aggregation results in plasmon coupling between gold bioconjugates, producing a spectral shift of more than in light scattering of the nanoparticles. In addition, coherent scattering effects result in a quadratic increase in the total scattering cross section of closely spaced nanoparticles for an assembly with total aggregate size sufficiently less than , where is the wavelength of light in the media;26 this occurs because an assembly of nanoparticles manifests an electric polarization in response to the incident electric field. The magnitude of this polarization is proportional to the magnitude of the incident field and also to the total number of nanoparticles. The scattered electric field is proportional to this polarization, and therefore the scattered power and the scattering cross section are proportional to the square of the number of the particles in the aggregate. The combination of the plasmon redshift and the nonlinear increase in the total scattering cross section of aggregates leads to a large increase in the scattering signal from labeled cells in the red optical region; this allows simple optimization of the excitation wavelength for detection of highly proliferating cancerous cells, even in the presence of isolated gold bioconjugates. Additionally, the large red optical shift in the plasmon resonances provides the possibility to decrease the contribution from the endogenous scattering of cells and epithelial tissue that is predominant in the blue spectral region. Indeed, high contrast was observed in the images of normal and precancerous human cervical biopsies (Figs. 6 and 7) and between normal and abnormal hamster cheek pouch in vivo (Fig. 8) without implementation of any washing steps, which would strongly limit the potential of in vivo applications. We observed contrast ratio in excess of tenfold in vivo, providing substantial improvement over recently reported values of less than 2 times obtained in the same animal model of carcinogenesis using antibody-targeted near-infrared (NIR) fluorescent dyes.35 In fluorescence labeling, signal intensity is linear with the number of fluorophors, and unbound dye can create strong background signal. To overcome this limitation, “smart” fluorescent probes which emit light only in the presence of particular biomolecules such as proteolytic enzymes have been developed.36 Although very promising, this approach can be used for only a limited number of different biomolecules. It is important to note that the nonlinear properties of gold nanoparticles cannot be fully exploited for detection of biological molecules that do not form closely spaced assemblies in the natural environment of living cells or the human body. In these situations, enzyme-activated molecular beacons and fluorophor-quencher pairs may provide better contrast. We believe that the combination of the contrast agents based on gold nanoparticles, topical delivery formulation, and noninvasive optical systems is feasible for use in human clinical trials in the near future because each component of this combination has already been approved for different applications in humans. The bioreactivity and toxicity of metallic gold has long been established as low, as evidenced by the use of metallic gold implants, the use of monovalent gold salts in treatment of arthritis,10 the exploration of gold nanoparticles as gene therapy carriers for HIV patients with up to of gold applied during treatment,37 and preclinical studies of a new minimally invasive thermal treatment of cancer using gold nanoshells.21 However, it is important to note that metallic gold is not metabolized. In some cases, a premalignant lesion can require a long patient follow-up; therefore, potential interference between the initial labeling with gold nanoparticles and subsequent imaging should be considered. It is well known that EGFR is regularly internalized and degraded within the cell.38 The degraded receptors are replaced with newly synthesized EGF receptors that can be targeted by the contrast agents. Delivery of nanoparticulates through mucosal boundaries has been demonstrated in a number of studies for a variety of size ranges. For example, 150 to diameter chitosan derivative–based nanoparticles have been successfully used as therapeutic carriers39 for peanut allergy immunization in the intestinal epithelium. DMSO has been shown to facilitate transmucosal transport of several materials such as antibodies,40 anticancer drugs,41 and photosensitizers.42 The FDA has approved DMSO as a treatment for interstitial cystitis via bladder instillation,20 and the toxicity of DMSO has been shown to be quite low, with an of . Further, there are several other compounds that have been shown to promote transmucosal permeability, such as polyvinyl pyrrolidone (PVP) (Ref. 43), chitosan,39 and lipid surfactants44 that may be utilized for promoting topical delivery of gold nanoparticle contrast agents. We found that two permeation enhancers, DMSO and Transcutol, can deliver neutravidin-conjugated polymeric fluorescent spheres through the whole thickness of fresh porcine oral epithelium (Fig. 9 ). However, delivery of 100-nm particles was significantly inhibited. We demonstrated that impairment of the epithelial barrier function by precancerous lesions facilitates topical delivery of gold bioconjugates in two ways: overall, approximately 40% more contrast agents are delivered to the abnormal tissue as compared to normal epithelium, and the contrast agents penetrated through the whole epithelial thickness (more than ) in the abnormal tissue and about deep in the normal epithelium. However, the 40% increase in the amount of the topically delivered contrast agent between the abnormal and normal samples cannot account for -fold increase in the intensity of the reflectance signal. Even in the areas where the amount of the contrast agent is the same in the normal and precancerous samples, we still observed the 11-fold increase in the reflectance signal in the abnormal tissue. Therefore, the specific binding of the contrast agents to EGF receptors in the abnormal sample is the determining factor in producing high reflectance intensity and increasing image contrast. Thus, gold bioconjugates in combination with topical delivery formulations and noninvasive real-time optical imaging systems are uniquely positioned to fulfill the need for sensitive detection and monitoring of epithelial cancers and their precursors, which account for approximately 85% of all cancer-related deaths. This can impact clinical practice, providing new tools to assess the risk of cancer progression based on molecular profiling, rational choice of therapeutic agents, and rapid molecular assessment of cancer response to therapy. AcknowledgmentsThe authors would like to acknowledge Dr. A. Malpica, for pathological reading of cervical biopsies; Ms. N. Abbey and Ms. J. L. Brandon, for histological staining; and Ms. V. Mack, for preparation of tissue phantoms. The study was supported by Grant No. R01-CA103830 BRP. ReferencesX. Gao,
Y. Cui,
R. M. Levenson,
L. W. K. Chung, and
S. Nie,
“In vivo cancer targeting and imaging with semiconductor quantum dots,”
Nat. Biotechnol., 22
(8), 969
–976
(2004). https://doi.org/10.1038/nbt994 1087-0156 Google Scholar
X. Michalet,
F. F. Pinaud,
L. A. Bentolila,
J. M. Tsay,
S. Doose,
J. J. Li,
G. Sundaresan,
A. M. Wu,
S. S. Gambhir, and
S. Weiss,
“Quantum dots for live cells, in vivo imaging, and diagnostics,”
Science, 307
(5709), 538
–544
(2005). https://doi.org/10.1126/science.1104274 0036-8075 Google Scholar
A. P. Alivisatos,
W. Gu, and
C. Larabell,
“Quantum dots as cellular probes,”
Annu. Rev. Biomed. Eng., 7 55
–76
(2005). https://doi.org/10.1146/annurev.bioeng.7.060804.100432 1523-9829 Google Scholar
C. Loo,
L. Hirsch,
M.-H. Lee,
E. Chang,
J. West,
N. Halas, and
R. Drezek,
“Gold nanoshell bioconjugates for molecular imaging in living cells,”
Opt. Lett., 30
(9), 1012
–1014
(2005). https://doi.org/10.1364/OL.30.001012 0146-9592 Google Scholar
J. Yguerabide and
E. E. Yguerabide,
“Resonance light scattering particles as ultrasensitive labels for detection of analytes in a wide range of applications,”
J. Cell. Biochem., 84
(Suppl. 37), 71
–81
(2001). 0730-2312 Google Scholar
W. C. Chan and
S. Nie,
“Quantum dot bioconjugates for ultrasensitive nonisotopic detection,”
Science, 281
(5385), 2016
–2018
(1998). https://doi.org/10.1126/science.281.5385.2016 0036-8075 Google Scholar
S. J. Oldenburg,
R. D. Averitt,
S. L. Westcott, and
N. J. Halas,
“Nanoengineering of optical resonances,”
Chem. Phys. Lett., 288
(2–4), 243
–247
(1998). https://doi.org/10.1016/S0009-2614(98)00277-2 0009-2614 Google Scholar
P. Alivisatos,
“The use of nanocrystals in biological detection,”
Nat. Biotechnol., 22
(1), 47
–52
(2004). https://doi.org/10.1038/nbt927 1087-0156 Google Scholar
K. Aslan,
J. R. Lakowicz, and
C. D. Geddes,
“Plasmon light scattering in biology and medicine: new sensing approaches, visions, and perspectives,”
Curr. Opin. Chem. Biol., 9
(5), 538
–544
(2005). https://doi.org/10.1016/j.cbpa.2005.08.021 1367-5931 Google Scholar
M. J. Abrams and
B. A. Murrer,
“Metal compounds in therapy and diagnosis,”
Science, 261
(5122), 725
–730
(1993). 0036-8075 Google Scholar
C. Soennichsen,
B. M. Reinhard,
J. Liphardt, and
A. P. Alivisatos,
“A molecular ruler based on plasmon coupling of single gold and silver nanoparticles,”
Nat. Biotechnol., 23
(6), 741
–745
(2005). https://doi.org/10.1038/nbt1100 1087-0156 Google Scholar
W. Rechberger,
A. Hohenau,
A. Leitner,
J. R. Krenn,
B. Lamprecht, and
F. R. Aussenegg,
“Optical properties of two interacting gold nanoparticles,”
Opt. Commun., 220
(1–3), 137
–141
(2003). https://doi.org/10.1016/S0030-4018(03)01357-9 0030-4018 Google Scholar
I. H. El-Sayed,
X. Huang, and
M. A. El-Sayed,
“Surface plasmon resonance scattering and absorption of anti-EGFR antibody conjugated gold nanoparticles in cancer diagnostics: applications in oral cancer,”
Nano Lett., 5
(5), 829
–834
(2005). https://doi.org/10.1021/nl050074e 1530-6984 Google Scholar
C. J. Barnes, R. Kumar,
“Biology of the epidermal growth factor receptor family,”
Cancer Treat Res., 119 1
–13
(2004). 0927-3042 Google Scholar
P. Mathevet,
L. Frappart, and
W. Hittelman,
“Dysplasies du col utérin: étude des expressions des gènes Rb et p53, et corrélation avec l’activité mitotique,”
Gynecologie, Obstetrique & Fertilité, 28
(1), 44
–50
(2000). Google Scholar
D. M. Shin,
I. B. Gimenez,
J. S. Lee,
K. Nishioka,
M. J. Wargovich,
S. Thacher,
R. Lotan,
T. J. Slaga, and
W. K. Hong,
“Expression of epidermal growth factor receptor, polyamine levels, ornithine decarboxylase activity, micronuclei, and transglutaminase I in a 7,12-diemthylbenz(a)anthracene-induced hamster buccal pouch carcinogenesis model,”
Cancer Res., 50
(8), 2505
–2510
(1990). 0008-5472 Google Scholar
D. S. Lidke,
P. Nagy,
R. Heintzmann,
D. J. Arndt-Jovin,
J. N. Post,
H. E. Grecco,
E. A. Jares-Erijman, and
T. M. Jovin,
“Quantum dot ligands provide new insights into erbB/HER receptor-mediated signal transduction,”
Nat. Biotechnol., 22
(2), 198
–203
(2004). https://doi.org/10.1038/nbt929 1087-0156 Google Scholar
M. Horisberger,
“Colloidal gold: a cytochemical marker for light and fluorescent microscopy and for transmission and scanning electron microscopy,”
Scan Electron Microsc., 2 9
–31
(1981). 0586-5581 Google Scholar
W. D. Geoghegan and
G. A. Ackerman,
“Adsorption of horseradish peroxidase, ovomucoid, and antiimmunoglobulin to colloidal gold for the indirect detection of concanavalin A, wheat germ agglutinin, and goat antihuman immunoglobulin G on cell surfaces at the electron microscopic level: a new method, theory, and application,”
J. Histochem. Cytochem., 25
(11), 1187
–1200
(1977). 0022-1554 Google Scholar
J. R. Dell and
C. L. Parsons,
“Multimodal therapy for interstitial cystitis,”
J. Reprod. Med., 49
(Suppl. 3), 243
–252
(2004). 0024-7758 Google Scholar
L. R. Hirsch,
R. J. Stafford,
J. A. Bankson,
S. R. Sershen,
B. Rivera,
R. E. Price,
J. D. Hazle,
N. J. Halas, and
J. L. West,
“Nanoshell-mediated near-infrared thermal therapy of tumors under magnetic resonance guidance,”
Proc. Natl. Acad. Sci. U.S.A., 100
(23), 13549
–13554
(2003). https://doi.org/10.1073/pnas.2232479100 0027-8424 Google Scholar
R. Schwarz,
A. D. Arifler,
K. Chang Sung,
I. Pavlova,
A. Hussain Insiya,
V. Mack,
B. Knight,
R. Richards-Kortum, and
M. Gillenwater Ann,
“Ball lens coupled fiber-optic probe for depth-resolved spectroscopy of epithelial tissue,”
Opt. Lett., 30
(10), 1159
–1161
(2005). https://doi.org/10.1364/OL.30.001159 0146-9592 Google Scholar
T. Collier,
A. Lacy,
R. Richards-Kortum,
A. Malpica, and
M. Follen,
“Near real-time confocal microscopy of amelanotic tissue: detection of dysplasia in ex vivo cervical tissue,”
Acad. Radiol., 9
(5), 504
–512
(2002). 1076-6332 Google Scholar
J. I. Goldstein,
D. E. Newbury,
P. Echlin,
D. C. Joy,
A. D. Romig,
C. E. Lyman, and
E. L. C. Fiori, Scanning Electron Microscopy and X-Ray Microanalysis, Plenum, New York (1992). Google Scholar
C. S. Johnson and
D. A. Gabriel, Laser Light Scattering, Dover, Mineola, NY (2002). Google Scholar
H. C. van de Hulst, Light Scattering by Small Particles, Dover, Mineola, NY (1981). Google Scholar
U. Kreibig and
M. Volmer, Optical Properties of Metal Clusters, Springer, Berlin (1995). Google Scholar
H. C. Gooi,
E. F. Hounsell,
I. Lax,
R. M. Kris,
T. A. Libermann,
J. Schlessinger,
J. D. Sato,
T. Kawamoto,
J. Mendelsohn, and
T. Feizi,
“The carbohydrate specificities of the monoclonal antibodies 29.1, 455, and 3C1B12 to the epidermal growth factor receptor of A431 cells,”
Biosci Rep., 5
(1), 83
–94
(1985). 0144-8463 Google Scholar
J. Schlessinger,
“Cell signaling by receptor tyrosine kinases,”
Cell, 103
(2), 211
–225
(2000). 0092-8674 Google Scholar
I. V. Boiko,
M. F. Mitchell,
W. Hu,
D. K. Pandey,
P. Mathevet,
A. Malpica, and
W. N. Hittelman,
“Epidermal growth factor receptor expression in cervical intraepithelial neoplasia and its modulation during an a-difluoromethylornithine chemoprevention trial,”
Clin. Cancer Res., 4
(6), 1383
–1391
(1998). 1078-0432 Google Scholar
J. C. Zenklusen,
S. L. Stockman,
S. M. Fischer,
C. J. Conti, and
I. B. Gimenez-Conti,
“Transforming growth factor-b1 expression in Syrian hamster cheek pouch carcinogenesis,”
Mol. Carcinog., 9
(1), 10
–16
(1994). 0899-1987 Google Scholar
R. Elghanian,
J. J. Storhoff,
R. C. Mucic,
R. L. Letsinger, and
C. A. Mirkin,
“Selective colorimetric detection of polynucleotides based on the distance-dependent optical properties of gold nanoparticles,”
Science, 277
(5329), 1078
–1080
(1997). https://doi.org/10.1126/science.277.5329.1078 0036-8075 Google Scholar
J. J. Storhoff,
A. D. Lucas,
V. Garimella,
Y. P. Bao, and
U. R. Mueller,
“Homogeneous detection of unamplified genomic DNA sequences based on colorimetric scatter of gold nanoparticle probes,”
Nat. Biotechnol., 22
(7), 883
–887
(2004). https://doi.org/10.1038/nbt977 1087-0156 Google Scholar
V. P. Zharov,
E. N. Galitovskaya,
C. Johnson, and
T. Kelly,
“Synergistic enhancement of selective nanophotothermolysis with gold nanoclusters: potential for cancer therapy,”
Lasers Surg. Med., 37
(3), 219
–226
(2005). https://doi.org/10.1002/lsm.20223 0196-8092 Google Scholar
N. S. Soukos,
M. R. Hamblin,
S. Keel,
R. L. Fabian,
T. F. Deutsch, and
T. Hasan,
“Epidermal growth factor receptor-targeted immunophotodiagnosis and photoimmunotherapy of oral precancer in vivo,”
Cancer Res., 61
(11), 4490
–4496
(2001). 0008-5472 Google Scholar
V. Ntziachristos,
C.-H. Tung,
C. Bremer, and
R. Weissleder,
“Fluorescence molecular tomography resolves protease activity in vivo,”
Nat. Med., 8
(7), 757
–761
(2002). 1078-8956 Google Scholar
C. Woffendin,
U. Ranga,
Z.-Y. Yang,
L. Xu, and
G. J. Nabel,
“Expression of a protective gene prolongs survival of cells in human immunodeficiency virus-infected patients,”
Proc. Natl. Acad. Sci. U.S.A., 93
(7), 2889
–2894
(1996). 0027-8424 Google Scholar
E. B. Leof,
“Growth factor receptor signalling: location, location, location,”
Trends Cell Biol., 10
(8), 343
–348
(2000). 0962-8924 Google Scholar
K. Roy,
H. Q. Mao,
S. K. Huang, and
K. W. Leong,
“Oral gene delivery with chitosan—DNA nanoparticles generates immunologic protection in a murine model of peanut allergy,”
Nat. Med., 5
(4), 387
–391
(1999). 1078-8956 Google Scholar
S. D. Larson,
C. G. Plopper,
G. Baker,
B. K. Tarkington,
K. C. Decile,
K. Pinkerton,
J. K. Mansoor,
D. M. Hyde, and
E. S. Schelegle,
“Proximal airway mucous cells of ovalbumin-sensitized and -challenged Brown Norway rats accumulate the neuropeptide calcitonin gene-related peptide,”
Am. J. Physiol., 287
(2, Pt. 1), L286
–L295
(2004). 0002-9513 Google Scholar
W. A. See and
Q. Xia,
“Regional chemotherapy for bladder neoplasms using continuous intravesical infusion of doxorubicin: impact of concomitant administration of dimethyl sulfoxide on drug absorption and antitumor activity,”
J. Natl. Cancer Inst., 84
(7), 510
–515
(1992). 0027-8874 Google Scholar
F. S. De Rosa,
J. M. Marchetti,
J. A. Thomazini,
A. C. Tedesco, and
M. V. L. B. Bentley,
“A vehicle for photodynamic therapy of skin cancer: influence of dimethylsulfoxide on 5-aminolevulinic acid in vitro cutaneous permeation and in vivo protoporphyrin IX accumulation determined by confocal microscopy,”
J. Controlled Release, 65
(3), 359
–366
(2000). 0168-3659 Google Scholar
D. Sharma,
T. P. Chelvi,
J. Kaur,
K. Chakravorty,
T. K. De,
A. Maitra, and
R. Ralhan,
“Novel Taxol formulation: polyvinylpyrrolidone nanoparticle-encapsulated Taxol for drug delivery in cancer therapy,”
Oncol. Res., 8
(7/8), 281
–286
(1996). 0965-0407 Google Scholar
N. S. Templeton,
D. D. Lasic,
P. M. Frederik,
H. H. Strey,
D. D. Roberts, and
G. N. Pavlakis,
“Improved DNA: liposome complexes for increased systemic delivery and gene expression,”
Nat. Biotechnol., 15
(7), 647
–652
(1997). 1087-0156 Google Scholar
|


