
|
|
1.IntroductionFluorescence spectroscopy can be utilized to quantify relationships between abnormal and normal tissue in vivo, thus providing a means to detect pathological lesions in real time. The intensity and line shape of the emitted light is a function of both the excitation and emission wavelength due to the presence of chromophores within tissue. Fluorophores such as NADH, FAD, keratin, tryptophan, elastin, and collagen are present in tissue and their concentration changes with disease.1, 2, 3 Tissue fluorescence can be characterized by acquiring an excitation-emission matrix (EEM), which contains the intensity as a function of both the excitation and emission wavelength. Diffuse reflectance spectroscopy can also be used to distinguish and characterize normal and abnormal tissue. In reflectance spectroscopy, light transmitted into the tissue undergoes a combination of elastic scattering and absorption. Differences in tissue refractive index affect scattering, thus providing insight into tissue characteristics such as the shape, structure, size, and scattering particle concentration. Meanwhile, absorption properties of tissue are mainly affected by hemoglobin concentration and oxygenation levels.4, 5, 6 Reflected light is also dependant on the source detector separation (SDS) between the excitation and collection fibers. Each SDS can target specific depths of tissue, such as the epithelium and stroma, and provide spatially resolved information.7 When reflectance data are combined with fluorescence spectroscopy, the diagnostic capabilities have been shown to improve.8, 9 Several groups are studying fluorescence and reflectance spectroscopy to discriminate normal and precancerous tissue in the lung,10 bladder,11 oral cavity,12 esophagus,8 skin,13 gastrointestinal tract,5 and ovary.14 The cervix has also been studied extensively with fluorescence and reflectance spectroscopy using different techniques to image small or entire areas of the cervix. 15, 16, 17, 18 Polartechnics and our group have used a point probe to evaluate normal and abnormal areas of the cervix in phase I and II trials.19, 20 Medispectra and SpectRx use an approach that visualizes the entire cervix and have reported phase II clinical findings.16, 21 Over the course of our spectroscopy research from pilot studies to the current phase II trial, three devices (FastEEM1, FastEEM2, and FastEEM3) were designed to measure fluorescence and diffuse reflectance spectroscopy of cervical tissue in vivo. The FastEEM systems are spectrographic devices that illuminate the tissue via a fiber optic point probe. The consensus histopathology diagnosis of the biopsy from each illuminated site provides the gold standard for interpreting the imaging data. FastEEM1 was used only in the laboratory and has been previously described in detail.22 One FastEEM2 device was developed at the beginning of the phase II trial, while three FastEEM3 devices were developed for each clinical site as the trial progressed. In total, four devices and four probes have been constructed. Herein, we report patient recruitment data and histopathology results from large screening and diagnostic phase II trials with 1000 and 850 patients, respectively. We also describe the instrumentation used throughout the trial along with the data processing. We explored interdevice consistencies and similarities using fully processed spectroscopic data. While intradevice and interdevice variability has been analyzed in a previous study, we are identifying consistencies across all device and probe combinations in the phase II trial.23 Variables that lead to differences in fluorescence and spectra are also explored. 2.Materials and Methods2.1.PatientsAfter Internal Review Board approval at each site, the trials were conducted at three clinical sites: the University of Texas M. D. Anderson Cancer Center, Houston, Texas (MDA); the Lyndon Baines Johnson Harris County Hospital District Hospital, Houston, Texas (LBJ); and the British Columbia Cancer Center, Vancouver, British Columbia (BCCA). Each site attracts patients of different ethnicities and educational backgrounds, enhancing our ability to generalize the findings of the study to many populations of women. Patients were recruited from the colposcopy clinics of all three sites for the diagnostic study. Each patient was referred with an abnormal Papanicolaou smear. In the screening trial, patients were self-referred and had a history of only normal Papanciolaou smears. Patients in both studies underwent a history and complete physical exam, repeat Papanicolaou smears, Virapap testing (DiGene, Bethesda, Maryland), chlamydia and gonorrhea cultures, human papillomavirus (HPV) DNA and messenger RNA (mRNA) sampling, and colposcopy of the vulva, vagina, and cervix. Colposcopically normal and abnormal sites were identified by the provider, either nurse practitioner or physician. Two abnormal and two normal sites were identified, measured with spectroscopy, and biopsied. Both squamous and columnar epithelia were sampled. 2.2.Clinical MeasurementsAfter the application of acetic acid, the provider identified imaging sites on the cervix with a colposcope. The point probe was then placed flush at each site and measured with fluorescence and reflectance spectroscopy. In a previous study (data not shown), we determined that the placement of the probe either before or after the application of acetic acid does not result in statistically significant variances of the fluorescent measurements. Biopsies of every measured cervical site, including colposcopic normal sites, were collected and taken to pathology for histopathologic review. 2.2.1.Histologic measurementsEach sample was reviewed by the pool of clinical cytologists or histopathologists at the two cancer centers: the MDA and the BCCA. This review was followed with a blinded review by the study pathologists at each site; each site had one expert in cytology and one expert in cervical histopathology. A third review was conducted if there was disagreement between reviews 1 and 2. Approximately 20% of biopsies went on to third review, while for 80% there was agreement between the first and second reviews. The final consensus diagnosis was used as the gold standard for each spectroscopy measurement. We conducted multiple analyses of the interpathologist and intrapathologist readings as well as the interinstitutional and intrainstitutional readings. Clinical comparisons are often made using the kappa statistic for which there is a clinical scale. The kappa statistic demonstrates agreement above the level of chance. The kappa scale shows values: 0 agreement due to chance alone, 0 to 0.2 slight agreement, 0.2 to 0.4 fair agreement, 0.4 to 0.6 moderate agreement, 0.6 to 0.8 substantial agreement, and 0.8 to 1.0 almost perfect agreement. Kappas can be calculated using exact agreement (unweighted kappa) and agreement within a well-defined diagnosis above and below the exact diagnosis (weighted kappa). We also conducted studies of randomly selected slides, and had them reviewed at the other cancer center and by an outside expert pathologist at the Brigham and Women’s Hospital in Boston. The summary of these data shows substantial agreement between institutions (0.658). Each study pathologist, when compared to themselves, also had moderate to substantial agreement (0.652, 0.571, and 0.464 unweighted kappas; 0.718. 0.731, and 0.653 weighted kappas). Further detailed results of the histopathologic review and detailed assessment of agreement among the study pathologist readings can be found in Malpica 24 2.3.Spectrographic InstrumentationThe components of both the FastEEM2 and FastEEM3 for in vivo measurement of fluorescence and reflectance spectroscopy vary slightly in design and differ on the mechanism of the illumination and collection of light. Table 1 outlines the specifications of each system, Fig. 1 shows diagrams of each device, and Fig. 2 displays the systems at each clinical site. Comparison between the two systems was made possible through analysis done by Bueeler to optimize design specifications.25 Fig. 1Diagrams of (a) FastEEM2 and (b) FastEEM3 used to measure fluorescence and diffuse reflectance.  Table 1Specifications of each spectroscopic device developed and utilized in the clinical trial for cervical tissue measurement.
2.3.1.Illumination componentsIn both FastEEM systems, an arc lamp provides quasimonochromatic light for fluorescence measurements and broadband excitation light for reflectance measurements. Xenon arc lamps were used as the light source because a xenon light can produce wavelengths that range from 250 to . Shutters control the exposure time of light that is directed toward the tissue. Reflectance spectra were measured after fluorescence spectroscopic measurements were acquired. Fluorescence excitation light for the FastEEM2 originated from a 150-W xenon arc lamp where light output was focused into a step driven monochromator. A monochromator relies on a grating to disperse light spectrally, and a controlled stepper motor selects the wavelength in 10-nm increments from 300 to for fluorescence measurements. In the FastEEM2, the lamp source housing has a separate port to direct white into the illumination fiber and bypasses the monochromator to take reflectance measurements. A shutter switches the port on or off according to which spectroscopic measurement is taken. The diffuse reflectance light passes through a rotating filter wheel containing three long-pass filters that are coated to transmit 50% of the broadband light intensity. In the FastEEM3, a 75-W xenon arc lamp served as the light source where the output was directed through bandpass filters. Bandpass filters in the FastEEM3 are placed on a triple filter wheel assembly in which each wheel is individually rotated according to the excitation wavelength selected. Less power was needed from the FastEEM3 light source because bandpass filters were used to produce monochromatic light, which increases light intensity approximately 6 times relative to a monochromator. A cold mirror reflected from the lamp output ensures that unwanted IR light does not pass through the filter wheel assembly. Excitation wavelength ranging from 290 to in increments of are delivered through excitation fibers in the fiber optic probe. The FastEEM3 light used for reflectance originates from the same lamp as the fluorescence excitation light. In the reflectance measurements, though, neutral density filters are also contained in the filter wheel assembly that only allow a certain percentage of light intensity to pass (10, 20, or 50%). The fluorescence and reflectance illumination fibers are located on a multiport translational stage, which moves with respect to the fixed light source depending on the type of illumination. 2.3.2.Fiber optic probesThe fiber optic probe is used as a conduit for light to excite and collect an area of tissue for both fluorescence and reflectance spectroscopy.26 The probes used in these studies were about the size of a pencil and illuminated an area of the cervix that was approximately in diameter. The fluorescent illumination light travels through a bundle of excitation fibers, which is coupled to a mixing element. A mixing element enables uniform illumination and collection of light from the same area, specifically, in diameter, on the tissue surface. The remitted light travels through the mixing element to the collection fibers. The excitation and collection fibers are randomly distributed across the mixing element. Reflectance measurements were made at different source detector separations where the illumination fiber is located at various distances from the collection fiber. Each fiber is in diameter with a numerical aperture of 0.2, while the entire probe is approximately in diameter. The probe is surrounded by stainless steel tubing that is approximately long. A protective coating surrounds the fiber bundle to guard against excessive bending and mechanical damage. Figure 3 provides an illustration of the general characteristics for each system probe. Fig. 3Fiber optic probe schematic for (a) FastEEM2 and (b) FastEEM3 and (c) the illuminated FastEEM3 probe. 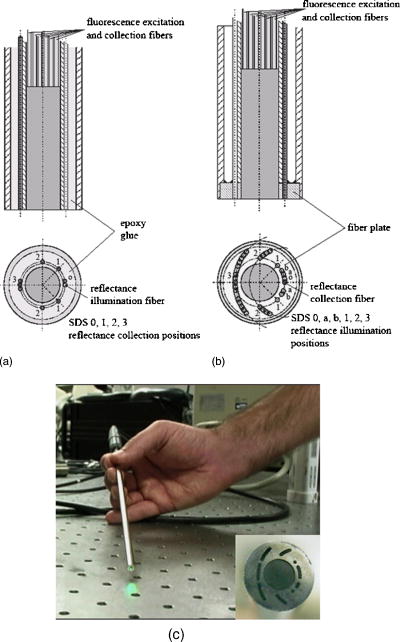 In the FastEEM2 probes, a fluorescence bundle is surrounded by a circular arrangement of reflectance fibers. A total of eight reflectance collection fibers at four different SDSs are located away from one illumination fiber. The separations are notated as 0, 1, 2, 3 and are located 0.25, 1.16, 2.13, and , respectively, away from the illumination fiber. Epoxy glue stabilizes the fibers at the four SDSs. The fluorescence bundle fibers are located inside of the reflectance assembly and are collectively glued with optical grade epoxy to a quartz mixing element. In the FastEEM3 probe design, a fiber disk composed of stainless steel precisely aligned the reflectance fibers and the fluorescence bundle, thereby diminishing the necessity for epoxy glue at the distal end of the probe. The metal disk also provides protection for the mixing element and reflectance fibers in case of mechanical impact. For diffuse reflectance spectroscopy in the FastEEM3, many illumination fibers at six source detector separations surround one collection fiber. In between the 0 and 1 positions, two additional source detector separations were added in the FastEEM3 probe and are located 0.5 and away from the detector fiber, respectively. 2.3.3.Collection componentsThe remitted light from fluorescence measurements travels through the collection fibers of the fiber optic probe and passes through long-pass filters. Long-pass filters enable wavelengths above a chosen cut-on wavelength to be transmitted, depending on the excitation wavelength selected. They remove the excitation light and enable the fluorescent light to continue to the camera. These filters are located on a wheel that is placed in front of the imaging spectrograph. Long-pass-filtered light is then sent into an imaging spectrograph, where it is dispersed by a grating. The long-pass filters we used had cut-on wavelengths of approximately longer than the excitation light; wavelengths are selected between 300 and . The imaging spectrograph is coupled to a CCD camera, which records light intensity. In general, the camera was thermoelectrically cooled to approximately to reduce dark current noise from thermally generated electrons. Reflectance light remitted from the tissue is collected in the equivalent manner as fluorescence emission, except that light travels through reflectance collection fibers of the fiber optic probe and did not pass through long pass filters. The main difference in the collection subsystem between the two FastEEM devices was the imaging spectrograph. In FastEEM2, the imaging spectrograph contains a movable diffraction grating to maximize the area of illumination on the CCD. The FastEEM3 utilizes a fixed grating in the spectrograph because the moving grating in the FastEEM2 was subjected to wear from heat and age, potentially reducing the accuracy of the wavelength calibration. 2.4.Calibration StandardsTimely measurements of a comprehensive set of standards ensure that the data are properly calibrated for intensity, optical transfer, and wavelength.27 The standard measurements also provide a means to correct for the different systems that were used throughout the study as well as to minimize variations that may have arisen within each system. Standards of known optical response are referred to as positive standards and are compared with the measured output. Standards with little expected optical signals are referred to as negative standards and are primarily used to check for instrumentation autofluorescence in the probe as well as light leakage and contamination. The positive, negative, and calibration standards are outlined for each device in Table 1. Briefly, the positive standards for the fluorescence measurements include coumarin, exalite, and rhodamine. The negative standards for fluorescence include a frosted quartz cuvette and doubly distilled deionized water. Reflectance positive standards include Teflon, 99% reflective Spectralon, and a suspension of polystyrene microspheres. Negative standards for reflectance include 2% reflective Spectralon along with the distilled water. Standards for both systems such as powermeter, mercury, and tungsten were used for calibration. Marin 27 examined in detail the use and analysis of standards for fluorescence spectroscopy, and Utzinger 14 discussed the processing of reflectance standards. 2.5.Quality Assurance and Data ProcessingData from standards and in vivo tissue measurements were collected using a series of quality assurance procedures. The standards significantly improved the ability to identify and address equipment and operator problems on a timely manner as the trials developed. This was done with software that automates the collection of positive and negative standards, tissue measurement, data processing, and tissue analysis. Both FastEEM systems use LabView software (National instruments, Austin, Texas) and MATLAB (Math Works, Natick, Massachusetts) for acquisition and processing standards data, respectively. The acquired patient data are processed to subtract background noise, compensate for probe output power, and calibrate for wavelength and system response. Correction factors are applied to standardize the data for all machine and fiber optic probe combinations. Once data has been processed, blinded analysis of the spectra is reviewed for artifacts or errors. 2.5.1.Fluorescence quality assurance and data processingFluorescence data from each measurement is reported as an EEM that represents fluorophores such as NADH, FAD, collagen, elastin, and hemoglobin. These fluorophores change in concentration as lesions advance from normal to low-grade to high-grade to cancer. Biologic plausibility studies confirm that not only is neoplasia important, but also biographical variables (such as menopausal status) and tissue type (the cervix has both columnar and squamous tissue). Each EEM underwent 10 reviews by the two senior engineers, the senior statisticians, and the principal investigator over a 2-y period. A forthcoming paper will describe agreement among these reviews. Approximately 5000 spectra were reviewed from both studies, and 20% were eliminated due to autofluorescence of one probe. We are working to restore those measurements, thus we show these data as a preliminary analysis in which we hope to demonstrate that each device/probe combination is able to separate those categories that influence the EEM such as neoplasia, tissue type, and menopausal status. These multidimensional data are reduced through a principal component analysis followed by binary classification using Mahalanobis distance. Further analyses using other statistical methods are ongoing at the time of this paper. 2.5.2.Reflectance quality assurance and data processingEach reflectance matrix was similarly quality assured in the aforementioned process. The data from each source detector separation can be represented by a matrix containing calibrated reflectance intensity as a function of the emission wavelength and the SDS distance. While less biologic plausibility studies have been performed on the reflectance data, mathematical modeling and analyses of patient data demonstrate differences among hemoglobin absorption, oxygen saturation, strength of stromal scattering, spectral shape of stromal scattering, collagen absorption, collagen concentration, keratin concentration, NADH concentration, FAD concentration, and epithelial scattering coefficients. In this analysis, we examine only SDS 1 or . Chang 9 discusses the data processing and analysis of both fluorescence and reflectance data in more detail. 3.Results3.1.Clinical SitesThe trials were conducted at three clinical sites. Patients 18 and older were recruited. Selected patient demographics are outlined in Table 2 and include age, menopausal status, and hormonal use. The final histopathology classification presented in this paper was categorized according to the Bethesda system where biopsy samples are diagnosed as normal, inflammation or atypia, low grade (encompasses the histologic diagnosis of HPV associated changes and cervical intraepithelial neoplasia grade 1), high grade (encompasses the diagnoses of cervical intraepithelial neoplasia grades 2 and 3 and the diagnosis of carcinoma in situ), or carcinoma (includes only invasive carcinomas of the squamous or adenomatous types). 3.2.Fluorescence and Reflectance ResultsIn this “per site” analysis, consistencies among the device and probe combinations stratified by histopathologic diagnosis, menopausal status, and tissue type were explored. Later analyses will include “per patient” analyses, not described here. Fully processed, quality assured fluorescence and reflectance measurements were available from the diagnostic trial. There were 4846 fluorescence measurements and 4844 reflectance measurements that were quality assured. The final number of fluorescence measurements was 3612 and reflectance was 3392; there were 2896 sites where both fluorescence and reflectance were available. The mean calibrated intensity was calculated and stratified for each device and probe combination. Reflectance measurements at 1-mm SDS were normalized by the solid Teflon block standard, and the fluorescence measurements differed in excitation wavelengths depending on the grouping of the data. In each plot, the device and probe combination is denoted. MDA1 is representative of the measurements made using the MDA FastEEM2 device with probe 1. MDA2 and MDA 3 denote the MDA FastEEM3 device with probes 2 and 3, respectively, while the LBJ3 is the same FastEEM2 device with probe 3 at the LBJ clinical site. BCCA represents the BCCA FastEEM3 device with the BCCA probe. The numbers included in each plot may not be equal between the fluorescence and reflectance measurements (all else equal) since the quality control process was independent of the type of measurement performed. The plots were organized so that fluorescence measurements are displayed with their corresponding reflectance measurements. Figures 4 to 6 display the results from the analysis to show consistencies among all device and probe combinations. Fig. 4Mean intensity values of measurements made in the cervix for which the consensus read histopathology showed normal (N) and high grade (HG) lesions. This figure is limited to only squamous tissue in (a) fluorescence and (b) reflectance measurements. The spectrometer-fiber optic probe combinations, for which there are five (described in Sec. 3.4), is given above each plot with the sample size of sites measured for each diagnosis given in the upper corner. The excitation wavelength for the fluorescence data is , while the reflectance source detection separation is normalized to the spectra of a solid Teflon block.  Fig. 6Mean intensity values of measurements made in the cervix for which the consensus-read histopathology showed of normal tissue for squamous, columnar, and mixed tissue (containing both squamous and columnar) types in (a) fluorescence and (b) reflectance measurements. The spectrometer-fiber optic probe combinations, totaling five, is given above each plot with sample size for each site measured from the tissue type given in the upper corner. The excitation wavelength for the fluorescence data is , while the reflectance source detection separation is normalized to the spectra of a solid Teflon block.  Figure 4 shows the differences between normal and high-grade diagnoses mean intensities for the fluorescence measurements at a excitation wavelength and the reflectance measurements at a 1-mm SDS. All measurements in the plots are of squamous tissue only. This figure clearly denotes the consistencies across all device and probe combinations where the normal diagnosis has a higher intensity than the high-grade dysplasia diagnosis. These findings agree with all our previously published results from pilot and phase I studies as well as fresh tissue slices that were analyzed. Figure 5 displays the mean intensity differences based on the pre-, peri-, and postmenopausal statuses for fluorescence measurements at a 450-nm excitation and reflectance measurements at a 1-mm SDS. Only normal, squamous tissue was used in these plots. Again, it is consistent across all device and probe combinations that premenopausal status is always at a lower intensity than the postmenopausal status. The intensity for the perimenopausal images fluctuates between pre- and postmenopausal status, which may be due to a small sample size. Overall, intensity separation between pre- and postmenopausal status may be attributed to tissue levels of estrogen, yet more work must be done to separate the effects of age and menopausal status. These findings agree with our analyses of biographical variables from pilot and phase I studies and with data obtained in fresh tissue slices. Fig. 5Mean intensity values of measurements made in the cervix for which the consensus-read histopathology showed normal, squamous tissue for pre-, peri-, and postmenopausal status as determined by the clinician in (A) fluorescence and (B) reflectance measurements. The spectrometer-fiber optic probe combinations, a total of five, is given above each plot with the sample size for each site from patients in three phases of pre-, peri-, and post menopause. The sample size for each site measured from the respective menopause phase is given in the upper corner. The excitation wavelength for the fluorescence data is , while the reflectance source detection separation is normalized to the spectra of a solid Teflon block.  Table 2Patient recruitment data for each protocol within the clinical trial.
Figure 6 displays the mean intensities of normal squamous, normal columnar, and normal mixed (squamous and columnar) tissue types for fluorescence measurements at a 400-nm excitation and reflectance measurements at a 1-mm SDS. Squamous tissue always has a higher intensity than columnar tissue across all the combinations. Mixed tissue types have intensity levels that are between the squamous and columnar intensities. We are currently categorizing the mixed classification to include the relative amounts of squamous and columnar tissue. Columnar tissue intensity has been shown to be low, and these measurements could be confounded with the diagnosis of high-grade dysplasia, making the tissue type important in the diagnostic algorithm. These data agree with findings published as pilot and phase I studies from our group and other groups. 4.DiscussionIn this analysis, we explored the interdevice consistencies from the entire diagnostic population set of our phase II clinical trial. We are engaged in analyses of many variables that could confound the spectroscopic findings. We are studying the devices, the probes, their combinations, their performance over time in years, their performance in repeated measures, their performance over the course of 1 and 2 days, and repeated performance at the three sites. We have collected data on many biographical features of the patients; some are the well-established risk factors for cervical neoplasia and others are data on educational status, number of births, ethnicity, age, and menopause. We hope to include and control for all sources of variability in our algorithm. Since the instrumentation has changed throughout the progression of the trial, systematic differences between the FastEEM2 and FastEEM3 spectrographic devices along with design differences among the system probes are explored. A previous study by Lee 23 established that each spectrometer and the fiber optic probe contribute significantly to variability, yet data processing based on known optical standards minimizes the variability. It was important to establish in this analysis that consistencies can be identified throughout the entire phase II trial despite the use of different devices and probes. To identify consistencies, we grouped measurements based on the diagnosis, tissue type, menopausal status, and type of measurement (fluorescence or reflectance) across all device and probe combinations used throughout the diagnostic trial. The results not only confirm that differences between diagnosis, tissue type, and menopausal status exist, but also that instrumentation variability has been effectively minimized. We showed that, all else being equal, normal tissue sites consistently have a higher intensity than high-grade tissue sites. It was also shown that intensity values are higher in squamous tissue than in columnar tissue. The finding that seems to have the most importance in this analysis is that spectroscopy can also differentiate between pre- and postmenopausal status. Tissue measurements from postmenopausal women were always higher in intensity than women who were premenopausal when all else is equal. Intensity values from the measurements of perimenopausal women jump between the pre- and postmenopausal status. In a study done on preliminary data from this phase II trial, it was already shown that biographical variables such as menopausal status affect the fluorescence spectra.28 This analysis, though, encompasses the entire diagnostic trial data set for both fluorescence and reflectance, providing more evidence that menopausal status should be considered when processing data and formulating an algorithm. Some difficulties have arisen in attempting to combine all of the instrumentation while minimizing variability. We are still identifying better methods to account for these differences such as the application of chemometrics as well as the data-processing techniques. We are also exploring many methods to determine the performance of both fluorescence and reflectance spectroscopy. The analysis in this paper identifies consistencies across all device and probe combinations, but it does not provide a statistical basis for the differences in diagnosis, tissue type, and menopausal status. We must first understand and evaluate instrumentation variability to fully evaluate biographical variable and risk factor significance. Such understandings will considerably enhance the modeling of spectroscopy data and provide a more robust algorithm to increase the sensitivity and specificity performance. AcknowledgmentsThis research was supported by National Institutes of Health-National Cancer Institute (NIH-NCI) Program Project Grants PO1-CA82710 and R25 CA57730. Special thanks to all the patients who participate in these trials and Karen Rabel, Trey Kell, Nan Earle, and Senthilnathan Nakappan at the University of Texas M. D. Anderson Cancer Center in Houston. ReferencesR. Richards-Kortum and
E. Sevick-Muraca,
“Quantitative optical spectroscopy for tissue diagnosis,”
Annu. Rev. Phys. Chem., 47 555
–606
(1996). https://doi.org/10.1146/annurev.physchem.47.1.555 0066-426X Google Scholar
R. Drezek,
K. Sokolov,
U. Utzinger,
I. Boiko,
A. Malpica,
M. Follen, and
R. Richards-Kortum,
“Understanding the contributions of NADH and collagen to cervical tissue fluorescence spectra: modeling, measurements, and implications,”
J. Biomed. Opt., 6
(4), 385
–396
(2006). https://doi.org/10.1117/1.1413209 1083-3668 Google Scholar
I. Georgakoudi,
B. C. Jacobson,
M. G. Muller,
E. E. Sheets,
K. Badizadegan,
D. L. Carr-Locke,
C. P. Crum,
C. W. Boone,
R. R. Dasari,
J. Van Dam, and
M. S. Feld,
“NAD(P)H and collagen as in vivo quantitative fluorescent biomarkers of epithelial precancerous changes,”
Cancer Res., 62
(3), 682
–687
(2002). 0008-5472 Google Scholar
V. Backman,
M. B. Wallace,
L. T. Perelman,
J. T. Arendt,
R. Gurjar,
M. G. Muller,
Q. Zhang,
G. Zonios,
E. Kline, and
J. A. McGilligan,
“Detection of preinvasive cancer cells,”
Nature (London), 406
(6791), 35
–36
(2000). https://doi.org/10.1038/35017638 0028-0836 Google Scholar
G. Zonios,
L. T. Perelman,
V. M. Backman,
R. Manoharan,
M. Fitzmaurice,
J. Van Dam, and
M. S. Feld,
“Diffuse reflectance spectroscopy of human adenomatous colon polyps in vivo,”
Appl. Opt., 38
(31), 6628
–6637
(1999). 0003-6935 Google Scholar
R. Drezek,
M. Guillaud,
T. Collier,
I. Boiko,
A. Malpica,
C. Macaulay,
M. Follen, and
R. Richards-Kortum,
“Light scattering from cervical cells throughout neoplastic progression: influence of nuclear morphology, DNA content, and chromatin texture,”
J. Biomed. Opt., 8
(1), 7
–16
(2003). https://doi.org/10.1117/1.1528950 1083-3668 Google Scholar
D. Arifler,
R. A. Schwarz,
S. K. Chang, and
R. Richards-Kortum,
“Reflectance spectroscopy for diagnosis of epithelial precancer: model-based analysis of fiber-optic probe designs to resolve spectral information from epithelium and stroma,”
Appl. Opt., 44
(20), 4291
–4305
(2005). https://doi.org/10.1364/AO.44.004291 0003-6935 Google Scholar
I. Georgakoudi and
M. S. Feld,
“The combined use of fluorescence, reflectance, and light-scattering spectroscopy for evaluating dysplasia in Barrett’s esophagus,”
Gastrointest Endosc Clin. N. Am., 14
(3), 519
–537
(2004). 1052-5157 Google Scholar
S. K. Chang,
Y. N. Mirabal,
E. N. Atkinson,
D. Cox,
A. Malpica,
M. Follen, and
R. Richards-Kortum,
“Combined reflectance and fluorescence spectroscopy for in vivo detection of cervical pre-cancer,”
J. Biomed. Opt., 10
(2), 024031
(2005). https://doi.org/10.1117/1.1899686 1083-3668 Google Scholar
S. Lam,
C. Macaulay,
J. C. leRiche, and
B. Palcic,
“Detection and localization of early lung cancer by fluorescence bronchoscopy,”
Cancer, 89
(11), 2468
–2473
(2000). 0008-543X Google Scholar
W. Zheng,
W. Lau,
C. Cheng,
K. C. Soo, and
M. Olivo,
“Optimal excitation-emission wavelengths for autofluorescence diagnosis of bladder tumors,”
Int. J. Cancer, 104
(4), 477
–481
(2003). https://doi.org/10.1002/ijc.10959 0020-7136 Google Scholar
D. L. Heintzelman,
U. Utzinger,
H. Fuchs,
A. Zuluaga,
K. Gossage,
A. M. Gillenwater,
R. Jacob,
B. Kemp, and
R. R. Richards-Kortum,
“Optimal excitation wavelengths for in vivo detection of oral neoplasia using fluorescence spectroscopy,”
Photochem. Photobiol., 72
(1), 103
–113
(2000). https://doi.org/10.1562/0031-8655(2000)072<0103:OEWFIV>2.0.CO;2 0031-8655 Google Scholar
H. Zeng,
C. Macaulay,
D. I. McLean,
B. Palcic, and
H. Lui,
“The dynamics of laser-induced changes in human skin autofluorescence—experimental measurements and theoretical modeling,”
Photochem. Photobiol., 68
(2), 227
–236
(1998). https://doi.org/10.1562/0031-8655(1998)068<0227:TDOLIC>2.3.CO;2 0031-8655 Google Scholar
U. Utzinger,
M. Brewer,
E. Silva,
D. Gershenson,
R. C. Blast,
M. Follen, and
R. Richards-Kortum,
“Reflectance spectroscopy for in vivo characterization of ovarian tissue,”
Lasers Surg. Med., 28
(1), 56
–66
(2001). https://doi.org/10.1002/1096-9101(2001)28:1<56::AID-LSM1017>3.0.CO;2-L 0196-8092 Google Scholar
I. Georgakoudi,
E. E. Sheets,
M. G. Muller,
V. Backman,
C. P. Crum,
K. Badizadegan,
R. R. Dasari, and
M. S. Feld,
“Trimodal spectroscopy for the detection and characterization of cervical precancers in vivo,”
Am. J. Obstet. Gynecol., 186
(3), 374
–382
(2002). https://doi.org/10.1067/mob.2002.121075 0002-9378 Google Scholar
W. K. Huh,
R. M. Cestero,
F. A. Garcia,
M. A. Gold,
R. S. Guido,
K. McIntyre-Seltman,
D. M. Harper,
L. Burke,
S. T. Sum,
R. F. Flewelling, and
R. D. Alvarez,
“Optical detection of high-grade cervical intraepithelial neoplasia in vivo: results of a 604-patient study,”
Am. J. Obstet. Gynecol., 190
(5), 1249
–1257
(2004). https://doi.org/10.1016/j.ajog.2003.12.006 0002-9378 Google Scholar
R. J. Nordstrom,
L. Burke,
J. M. Niloff, and
J. F. Myrtle,
“Identification of cervical intraepithelial neoplasia (CIN) using UV-excited fluorescence and diffuse-reflectance tissue spectroscopy,”
Lasers Surg. Med., 29
(2), 118
–127
(2001). https://doi.org/10.1002/lsm.1097 0196-8092 Google Scholar
N. Ramanujam,
M. F. Mitchell,
A. Mahadevan,
S. Warren,
S. Thomsen,
E. Silva, and
R. Richards-Kortum,
“In vivo diagnosis of cervical intraepithelial neoplasia using 337-nm-excited laser-induced fluorescence,”
Proc. Natl. Acad. Sci. U.S.A., 91
(21), 10193
–10197
(1994). https://doi.org/10.1073/pnas.91.21.10193 0027-8424 Google Scholar
A. Nath,
K. Rivoire,
S. Chang,
L. West,
S. B. Cantor,
K. Basen-Engquist,
K. Adler-Storthz,
D. D. Cox,
E. N. Atkinson,
G. Staerkel,
C. Macaulay,
R. Richards-Kortum, and
M. Follen,
“A pilot study for a screening trial of cervical fluorescence spectroscopy,”
Int. J. Gynecol. Cancer, 14
(6), 1097
–1107
(2004). Google Scholar
A. Singer,
M. Coppleson,
K. Canfell,
V. Skladnev,
G. Mackellar,
N. Pisal, and
A. Deery,
“A real time optoelectronic device as an adjunct to the Pap smear for cervical screening: a multicenter evaluation,”
Int. J. Gynecol. Cancer, 13
(6), 804
–811
(2003). Google Scholar
D. G. Ferris,
R. A. Lawhead,
E. D. Dickman,
N. Holtzapple,
J. A. Miller,
S. Grogan,
S. Bambot,
A. Agrawal, and
M. L. Faupel,
“Multimodal Hyperspectral Imaging for the noninvasive diagnosis of cervical neoplasia,”
J. Low. Genit. Tract Dis., 5
(2), 65
–72
(2001). Google Scholar
A. F. Zuluaga,
U. Utzinger,
A. Durkin,
H. Fuchs,
A. Gillenwater,
R. Jacob,
B. Kemp,
J. Fan, and
R. Richards-Kortum,
“Fluorescence excitation emission matrices of human tissue: a system for in vivo measurement and method of data analysis,”
Appl. Spectrosc., 53
(3), 302
–311
(1999). https://doi.org/10.1366/0003702991946695 0003-7028 Google Scholar
J. S. Lee,
O. Shuhatovich,
R. Price,
B. Pikkula,
M. Follen,
N. McKinnon,
C. Macaulay,
B. Knight,
R. Richards-Kortum, and
D. D. Cox,
“Design and preliminary analysis of a study to assess intra-device and inter-device variability of fluorescence spectroscopy instruments for detecting cervical neoplasia,”
Gynecol. Oncol., 99
(3), S98
–111
(2005). 0090-8258 Google Scholar
A. Malpica,
J. P. Matisic,
D. V. Niekirk,
C. P. Crum,
G. A. Staerkel,
J. M. Yamal,
M. H. Guillaud,
D. D. Cox,
E. N. Atkinson,
K. Adler-Storthz,
N. M. Poulin,
C. A. Macaulay, and
M. Follen,
“Kappa statistics to measure interrater and intrarater agreement for 1790 cervical biopsy specimens among twelve pathologists: qualitative histopathologic analysis and methodologic issues,”
Gynecol. Oncol., 99
(3), S38
–S52
(2005). 0090-8258 Google Scholar
M. Bueeler,
“Design optimization and quality control of a fluorescence and reflectance spectroscopy system,”
Swiss Federal Institute of Technology,
(2000). Google Scholar
U. Utzinger and
R. R. Richards-Kortum,
“Fiber optic probes for biomedical optical spectroscopy,”
J. Biomed. Opt., 8
(1), 121
–147
(2003). https://doi.org/10.1117/1.1528207 1083-3668 Google Scholar
N. M. Marin,
N. Mackinnon,
C. Macaulay,
S. K. Chang,
E. N. Atkinson,
D. Cox,
D. Serachitopol,
B. Pikkula,
M. Follen, and
R. Richards-Kortum,
“Calibration standards for multicenter clinical trials of fluorescence spectroscopy for in vivo diagnosis,”
J. Biomed. Opt., 11
(1), 014010
(2006). https://doi.org/10.1117/1.2166389 1083-3668 Google Scholar
C. Brookner,
U. Utzinger,
M. Follen,
R. Richards-Kortum,
D. Cox, and
E. N. Atkinson,
“Effects of biographical variables on cervical fluorescence emission spectra,”
J. Biomed. Opt., 8
(3), 479
–483
(2003). https://doi.org/10.1117/1.1578642 1083-3668 Google Scholar
|
|||||||||||||||||||||||||||||||||||||||||||||||||||||||||||||||||||||||||||||||||||||||||||||||||||||||||||||||||||||||||||||||||||||||


