
|
|
1.IntroductionAfter intravenous injection, the fate of contrast agents is influenced by factors such as pharmacokinetics, biodistribution, and compound stability.1, 2, 3, 4 Contrast agents used in computed tomography (CT), positron emission tomography (PET), and magnetic resonance imaging (MRI) are usually administered singly,5, 6 since current technologies can track only one contrast agent at a time. However, it would be desirable to track the biodistribution of specific contrast agents simultaneously to distinguish their individual pharmacokinetics after intravenous injection. This may be particularly useful during drug development where the pharmacokinetics of a candidate drug are still unknown. Spectrally resolved optical imaging offers the opportunity to track two separate proteins, each labeled with a different fluorophore emitting at a different wavelength. In this manner, the relative pharmacokinetics of two proteins could be directly compared. Asialoglycoprotein receptor is a cell surface receptor specific for galactose-terminated glycoprotein and is found on the mammalian hepatocyte.7, 8 When galactosylated substrates, such as galactosylated serum albumin or avidin, are administered intravenously, they specifically bind to the asialoglycoprotein receptors and rapidly accumulate within hepatocytes.9, 10, 11, 12, 13 This unique property of the asialoglycoprotein receptor has been exploited for evaluating hepatic functional reserve in hepatocellular carcinoma patients14, 15 and experimentally for clearing intravascular contrast agents from the circulation.11, 12, 13 To date, optical imaging probes that bind the asialoglycoprotein receptor have been injected singly. However, with spectrally resolved optical imaging, it is now possible to track two separate probes, one that binds to the asialoglycoprotein and one of comparable size and charge that does not bind. To further investigate the molecular and pathophysiological events during asialoglycoprotein receptor imaging, two-color dynamic optical imaging was performed using a camera capable of spectrally resolving two ligands labeled with two separate near-infrared (NIR) fluorophores. First, we performed two-color dynamic contrast-enhanced imaging after the coinjection of a mixed solution of bovine serum albumin (BSA) and galactosamine-conjugated bovine serum albumin (GmSA) conjugated with different NIR fluorophores. Next, we performed two-color dynamic contrast-enhanced imaging after the sequential injection of biotinylated BSA (b-BSA)–conjugated NIR contrast agent and nonbiotinylated BSA-conjugated NIR contrast agent followed by an injection of avidin to clear the avidin–b-BSA complex from the circulation to the liver (avidin “chase”). These experiments demonstrate the feasibility of simultaneously imaging two separate optically labeled probes in vivo. 2.Materials and Methods2.1.ChemicalsBSA and GmSA, which contained 23 galactosamine molecules on a single albumin molecule, were purchased from Sigma Chemical (St. Louis, Missouri). Amine-reactive biotin, succinimidyl-6-(biotin-amido)hexanoate (NHS-LC-Biotin), and avidin were purchased from Pierce (Rockford, Illinois). Amine-reactive Cy5.5 (peak emission wavelength at ) and Cy7 (peak emission wavelength at ) were purchased from GE Healthcare Limited (Piscataway, NJ). 2.2.Synthesis of BSA- and GmSA-Conjugated Near-Infrared Contrast AgentsAt room temperature, of GmSA or of BSA in of was incubated with of Cy5.5 or Cy7 in dimethyl sulfoxide (DMSO) at pH 8.5 for . The mixture was purified with Sephadex G50 (PD-10; GE Healthcare, Milwaukee, Wisconsin). All conjugated samples were concentrated with a Centricon 30 (Millipore Co., Billerica, Massachusetts), and concentration was adjusted to in phosphate buffered saline (PBS) at pH 7.4. GmSA-conjugated Cy5.5 and Cy7 (GmSA-Cy5.5 and GmSA-Cy7, respectively) and BSA-conjugated Cy5.5 and Cy7 (BSA-Cy5.5 and BSA-Cy7, respectively) samples were refrigerated at . The protein concentration of GmSA-Cy5.5, GmSA-Cy7, BSA-Cy5.5, and BSA-Cy7 samples was determined with a Coomassie Plus protein assay kit (Pierce Chem Co., Rockford, Illinois) by measuring the absorption at with a UV-Vis system (8453 Value UV-Bis system, Agilent Technologies, Palo Alto, California) using standard solutions of known concentrations of GmSA or BSA (100, 200, and ). The concentration of Cy5.5 and Cy7 was then measured by the absorption at 679 and , respectively, with a UV-Vis system (8453 Value UV-Bis system, Agilent Technologies) to confirm the number of fluorophore molecules conjugated with each GmSA or BSA molecule. The number of fluorophore molecules per GmSA or BSA was 2.0 for Cy5.5 and 2.5 for Cy7, respectively. 2.3.Synthesis of Biotinylated BSA-Conjugated Near-Infrared Contrast AgentsAt room temperature, NHS-LC-Biotin dissolved in DMSO was added to of BSA in of and incubated for . Then of Cy5.5 or Cy7 in DMSO at pH 8.5 was added and incubated for . Unreacted biotin and Cy5.5 or Cy7 were separated from the protein by gel filtration using a Sephadex G50 (PD-10; GE Healthcare). All conjugated samples were concentrated with a Centricon 30 (Millipore Co.) and adjusted to a concentration of in PBS pH 7.4. Biotinylated BSA conjugated to Cy5.5 and Cy7 (b-BSA-Cy5.5 and b-BSA-Cy7, respectively) samples were refrigerated at . The protein concentration of b-BSA-Cy5.5 and b-BSA-Cy7 samples was determined with a Coomassie Plus protein assay kit (Pierce Chem Co.) by measuring the absorption at with a UV-Vis system (8453 Value UV-Bis system, Agilent Technologies) using standard solutions of known concentrations of BSA (100, 200, and ). The concentration of Cy5.5 and Cy7 was then measured by the absorption at 679 and , respectively with a UV-Vis system (8453 Value UV-Bis system, Agilent Technologies) to confirm the number of fluorophore molecules conjugated with each BSA molecule. The number of fluorophore molecules per BSA was 1.8 for Cy5.5 and 2.2 for Cy7, respectively. The biotin labeling ratio was determined by the HABA assay (Pierce Chem. Co.), and of avidin and of HABA were added to of PBS (HABA/Avidin solution). The HABA/Avidin solution was put in a cuvette, and the absorbance of this solution was measured at and recorded as the HABA/Avidin. Then, of b-BSA-Cy5.5 or b-BSA-Cy7 was added to the HABA/Avidin solution, and the absorbance at was measured and recorded as the HABA/Avidin/Biotin. The number of biotin conjugated per BSA was calculated based on the Beer Lambert law: where is the absorbance of the sample at a particular wavelength , is the absorptivity or extinction coefficient at , is the cell path length , and is the concentration of the sample. This measurement procedure was repeated twice, and the average number of biotin molecules per molecule of BSA was determined by dividing the concentration of biotin by the concentration of BSA used in the assay. The number of biotin molecules conjugated to BSA was 8 for both b-BSA-Cy5.5 and b-BSA-Cy7.2.4.Two-Color Wavelength-Resolved Contrast-Enhanced Dynamic Optical ImagingAll in vivo procedures were carried out in compliance with the Guide for the Care and Use of Laboratory Animal Resources (1996), National Research Council, and approved by the Animal Care and Use Committee. Twelve-week-old normal athymic mice were anesthetized with intraperitoneal injection of sodium pentobarbital (Dainabot, Osaka, Japan). The tail vein was then cannulated with a 30-gauge needle, and in vivo contrast-enhanced dynamic imaging study was performed. This in vivo dynamic contrast-enhanced study consists of two protocols:
For the one-shot injection study, mixed solution of BSA-Cy5.5 and GmSA-Cy7 or mixed solution of GmSA-Cy5.5 and BSA-Cy7 was injected as a mixture. Mice were placed in the supine position, and wavelength-resolved spectral fluorescence imaging was carried out (Maestro In-Vivo Imaging System, CRi Inc., Woburn, Massachusetts). For before and after injection, the contrast agent mixture (either BSA-Cy5.5 and GmSA-Cy7 or GmSA-Cy5.5 and BSA-Cy7), spectral fluorescence imaging was performed every . At after injection, images were obtained every for another . For the multi-injection study, three sequential injections of b-BSA-Cy7 , BSA-Cy5.5 , and avidin in PBS or b-BSA-Cy5.5 , BSA-Cy7 , and avidin in PBS were administered at intervals. Spectral fluorescence imaging was performed every starting before and after the initial injection (b-BSA-Cy7 or b-BSA-Cy5.5). The excitation bandpass filter of was used. The tunable filter within the camera was automatically stepped in increments from maintaining the same exposure time for images captured at each wavelength. Collected images were analyzed by the Maestro software, which uses spectral unmixing algorithms to separate the fluorescence from each of the NIR contrast agents and from background autofluorescence. Then composite images consisting of two spectrally unmixed images representing the distribution of the two optically labeled probes were made. All experiments were performed in triplicate. 2.5.Image AnalysisFor the one-shot injection study, regions of interest (ROIs) were drawn over the liver and a superficial vessel. ROIs were selected based on regions with the least movement and the lowest background signal during the course of the dynamic series of scans, and then the liver-to-vessel signal intensity ratio (SIR) was calculated as the signal intensity of the liver divided by the signal intensity of the vessel using ImageJ software (http://rsb.info.nih.gov/ij/plugins/mri-analysis.html). The dynamics of SIR on the spectrally unmixed images of the two different contrast agents were compared by plotting the SIR values as a function of the time. For the avidin chase study, ROIs were drawn over the liver and a superficial vessel, and the liver-to-vessel SIR was calculated as the signal intensity of the liver divided by the signal intensity of the vessel in spectrally unmixed images corresponding to the two contrast agents. The SIR values were plotted from before avidin injection to after avidin injection. A comparison of SIR kinetics after avidin injection was made between the GmSA and BSA labeled probes. 3.Results3.1.Spectrally Resolved Two-Color Dynamic Contrast-Enhanced Imaging Simultaneously Visualizes Two Different Protein ConjugatesSpectrally resolved two-color dynamic contrast-enhanced optical imaging was performed after intravenous injection of a mixed solution consisting of BSA-Cy5.5 and GmSA-Cy7. At after injection, the spectrally unmixed BSA-Cy5.5 image and GmSA-Cy7 image demonstrated enhancement of the skin and the superficial vessels [Fig. 1a ]. The BSA-Cy5.5 unmixed images demonstrated enhancement of the skin and the vessels for up to after injection, but the liver was not enhanced [Fig. 1a]. The spectrally unmixed images after GmSA-Cy7 injection likewise demonstrated strong enhancement of the skin and the superficial vessels after injection, but the enhancement of the skin and the vessels substantially decreased over time. Meanwhile, the liver had enhanced significantly by . Fig. 1Biodistribution of optically labeled BSA and GmSA following intravenous injection. (a) Sequential spectral two-color dynamic contrast-enhanced optical images after BSA-Cy5.5 and GmSA-Cy7. At after injection, the superficial vessels were (arrowheads) enhanced on the spectrally unmixed BSA-Cy5.5 and GmSA-Cy7 images. The liver signal (arrows) gradually increases while the enhancement of the vessels decreases on the unmixedGmSA-Cy7 images. Spectrally unmixed BSA-Cy5.5 images showed minimal enhancement of the liver, while the enhancement of the skin and the vessels persisted for at least after injection. (b) Sequential optical images after coinjection of GmSA-Cy5.5 and BSA-Cy7. At after injection, the superficial vessels (arrowheads) were enhanced on both spectrally unmixed GmSA-Cy5.5 and BSA-Cy7 images. The liver (arrows) was slightly enhanced at in the BSA-Cy7 image, but the enhancement of the liver decreased at . Conversely, the GmSA-Cy5.5 images demonstrated gradual enhancement of the liver while the vascular enhancement substantially decreased by .  The optical labels were then switched (BSA-Cy7 and GmSA-Cy5.5). Using these agents, the unmixed images at after coinjection demonstrated the enhancement of the skin and the superficial vessels [Fig. 1b]. The unmixed images of BSA-Cy7 demonstrated enhancement of the skin and the vessels for up to after injection, but the liver demonstrated only slight enhancement. By , the skin and the vascular enhancement remained high. However, on unmixed images of GmSA-Cy5.5, the skin and the vascular enhancement substantially decreased over time, while liver uptake increased substantially [Fig. 1b]. Thus, the biodistribution of the optical probes was dictated by the protein and not by the NIR fluorophore. To semiquantitatively assess the biodistribution differences between BSA and GmSA labeled with NIR fluorophores, ROIs were drawn on the liver and a superficial vessel, and liver-to-vessel SIR was calculated by ImageJ software (http://rsb.info.nih.gov/ij/plugins/mri-analysis.html) as the signal intensity of the liver divided by the signal intensity of a superficial vessel in spectrally unmixed images (BSA-Cy5.5 and GmSA-Cy7 or BSA-Cy7 and GmSA-Cy5.5). Immediately after coinjection of BSA-Cy5.5 and GmSA-Cy7, the SIR of BSA-Cy5.5 slightly increased but remained practically stable for up to after injection, while the SIR of GmSA-Cy7 gradually increased, doubling by (Fig. 2 ). Similar findings were observed when the optical NIR fluorophores were switched and the injected solution contained GmSA-Cy5.5 and BSA-Cy7. Immediately after coinjection of BSA-Cy7 and GmSA-Cy5.5, the SIR of BSA-Cy7 slightly increased but then decreased during the observation period, while the SIR of GmSA-Cy5.5 consistently increased, ultimately increasing tenfold by after injection (Fig. 2). The liver signal intensity of BSA-Cy7 was higher than BSA-Cy5.5 probably because of better tissue penetration of Cy7 leading to consistently higher liver-to-blood SIRs for BSA-Cy7 compared to BSA-Cy5.5. These findings were consistent among all three mice in each group, in which the same combination of agents was injected. Fig. 2Semiquantitative assessment of the biodistribution of BSA and GmSA shows unique behavior. Regions of interest were drawn over the liver and a superficial vessel (left panels; images taken after coinjection of agents), and the liver-to-vessel signal intensity ratio (SIR) was calculated as the signal intensity of the liver divided by the signal intensity of the vessel on each of the images obtained after injection of a mixture of either BSA-Cy5.5 and GmSA-Cy7 or GmSA-Cy5.5 and BSA-Cy7. The SIRs of BSA-Cy5.5 and BSA-Cy7 demonstrated a slight increase immediately after injection that gradually decreased over . Conversely, the SIRs of GmSA-Cy7 and GmSA-Cy5.5 demonstrated a gradual increase over , indicating abundant liver uptake of GmSA-Cy7 and GmSA-Cy5.5. 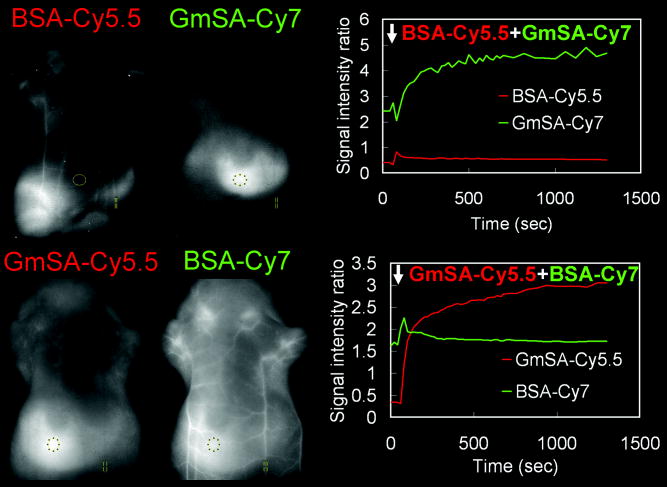 3.2.Spectrally Resolved Two-Color Dynamic Optical Imaging Tracks the Fate of Two Optical Probes After Avidin ChaseAt after the injection of biotinylated-BSA-Cy7 (b-BSA-Cy7) and nonbiotinylated BSA-Cy5.5, an injection of avidin was administered to clear the b-BSA-Cy7 from the circulation and deposit it in the liver. At after b-BSA-Cy7 and BSA-Cy5.5 injection (prior to avidin), the skin and the superficial vessels were enhanced on the spectrally unmixed images [Fig. 3a ]. At after injection, avidin was administered to selectively remove b-BSA-Cy7 from the circulation and have it bind to the liver (also known as an avidin “chase”). At after avidin injection, the signal intensity of the superficial vessels decreased on the b-BSA-Cy7 image but not the BSA-Cy5 image, while the signal intensity of the liver slightly increased on the b-BSA-Cy7 image. At after avidin injection, the superficial vessels were almost undetectable, while the liver and the spleen were strongly enhanced on the b-BSA-Cy7 images. The signal intensity changes on the BSA-Cy5.5 images were not changed by the avidin chase [Fig. 3a]. Fig. 3The biodistribution of b-BSA and BSA was imaged before and after an avidin chase. Sequential injections of biotinylated BSA (b-BSA) and nonbiotinylated BSA-conjugated with either Cy5.5 or Cy 7 (BSA-Cy5.5 or BSA-Cy7, respectively) were performed, followed by an avidin injection to “chase” the b-BSA complex. (a) Sequential injections of b-BSA-Cy7, BSA-Cy5.5, and avidin were performed at intervals of . At after injection of b-BSA-Cy7, superficial vessels (arrowhead) and the liver (arrow) were visualized only on the b-BSA-Cy7 image. At after the subsequent injection of BSA-Cy5.5, the superficial vessels were visualized on both the b-BSA-Cy7 image and the BSA-Cy5.5 image. The liver was almost undetectable on both b-BSA-Cy7 images and BSA-Cy5.5 images. At after the injection of avidin, the liver was slightly enhanced while the enhancement of the superficial vessels slightly decreased on the b-BSA-Cy7 image. However, by after injection with avidin, the liver demonstrated marked enhancement, while the superficial vessels were almost undetectable on the b-BSA-Cy7 image. The liver was never visualized on the BSA-Cy5.5 image. The persistent enhancement (yellow arrows) noted on both the BSA-Cy5.5 image and the b-BSA-Cy7 image were due to extravasation of the contrast agents. (b) Sequential injection of b-BSA-Cy5.5, BSA-Cy7, and avidin was performed at intervals of . At after injection of b-BSA-Cy5.5, several superficial vessels (arrowheads) and the liver (arrows) were visualized only on the b-BSA-Cy5.5 image. At after injection of BSA-Cy7, the superficial vessels were visualized on both the b-BSA-Cy5.5 image and the BSA-Cy7 image. The liver was barely detectable on the b-BSA-Cy7 image and the BSA-Cy5.5 image. However, at after injection of avidin, the liver became increasingly higher in signal on the b-BSA-Cy7 image, while the enhancement of the superficial vessels diminished. At after avidin injection, the liver was strongly enhanced, while the superficial vessels were almost undetectable on the b-BSA-Cy7 image. The enhancement of the liver and the skin were minimally changed on the BSA-Cy7 image.  To confirm the independence of the NIR fluorophores labeled to the proteins, Cy5.5-labeled b-BSA (b-BSA-Cy5.5) and Cy7-labeled BSA (BSA-Cy7) were synthesized and the experiment was repeated. At after b-BSA-Cy5.5 injection, the skin and superficial vessel enhancement was noted [Fig. 3b]. At after the additional injection of BSA-Cy7, the enhancement of the skin and the superficial vessels was noted on both spectrally unmixed b-BSA-Cy5.5 and BSA-Cy7 images [Fig. 3b]. Avidin was injected after the BSA-Cy7 injection to clear the b-BSA-Cy5.5 from the circulation. At after avidin injection, the signal intensity of the superficial vessels decreased on the b-BSA-Cy5.5 image and the signal intensity of the liver slightly increased. By , the superficial vessels were undetectable but the signal intensity of the liver markedly increased on the unmixed b-BSA-Cy5.5 images. The signal intensity changes on the BSA-Cy7 images were minimal during the same time period [Fig. 3b]. Thus, the avidin chase removed b-BSA from the circulation and led to its deposition in the liver, a process that could be monitored by in vivo spectral imaging. These findings were consistent within each group ( animals/group), in which the same combination of agents was injected. To semiquantitatively assess the differences between b-BSA and BSA biodistribution during avidin chase, ROIs were drawn over the liver and a superficial vessel, and the liver-to-vessel SIR was calculated as the signal intensity of the liver divided by the signal intensity of the vessel on spectrally unmixed images using ImageJ software (http://rsb.info.nih.gov/ij/plugins/mri-analysis.html). After avidin injection, the SIR on the unmixed b-BSA-Cy7 image gradually increased, while the SIR on the unmixed BSA-Cy5.5 slightly decreased over the same (Fig. 4 ). Similar results were observed when the fluorophores were switched to b-BSA-Cy5.5 and BSA-Cy7: the SIR on the unmixed b-BSA-Cy5.5 image increased, while the SIR on the unmixed BSA-Cy7 image slightly decreased over the after avidin injection (Fig. 4). Fig. 4Semiquantitative assessment of the SIR demonstrates that b-BSA and BSA exhibit different biodistributions after an avidin chase. Sequential injections of b-BSA-Cy7 and BSA-Cy5.5 or b-BSA-Cy5.5 and BSA-Cy7 were performed in two animals followed by an avidin chase. Regions of interest were drawn over the liver and a superficial vessel (left panels; images obtained after avidin injection), and then the liver-to-vessel SIR was calculated. The SIRs of BSA-Cy5.5 and BSA-Cy7 demonstrated a gradual decrease after avidin injection, while the SIRs of b-BSA-Cy7 and b-BSA-Cy5.5 demonstrated a gradual increase over after avidin injection, indicating that b-BSA-Cy7 and b-BSA-Cy5.5 were accumulating in the liver after the avidin chase.  4.DiscussionIn this study, we demonstrate a method to optically resolve the pharmacokinetics of two distinct proteins labeled with NIR optical fluorophores using spectrally resolved imaging. Using this technique, the two proteins could be tracked simultaneously and separately using a time resolution of approximately . For this experiment, one protein was chosen because of its known binding to asialoglycoprotein receptors (GmSA, b-BSA/avidin). The other agent, BSA, is a blood pool agent that does not have specific binding characteristics. Thus, we were able to compare a highly targeted and a nontargeted protein in the same mouse at the same time. This noninvasive in vivo imaging technique can potentially applied to a wide variety of proteins, cells, or chemicals and could be useful for assessing drug candidates. Substantial progress has been recently made in the number of in vitro optical probes and the capabilities of imaging instrumentation. This has made it possible to simultaneously detect as many as 17 cell-surface proteins, each matched to a unique fluorophore.16 Multicolor in vivo fluorescence imaging has been reported with endogenous fluorescence proteins such as green, red, yellow, and magenta fluorescence proteins, which are expressed from genetically transfected cells or transgenic animals.17 However, multicolor in vivo fluorescence imaging with exogeneous fluorescent protein probes has received less attention.18, 19 By using NIR contrast agents, which have a relatively good depth of photon penetration within the tissue, in combination with a spectrally resolved optical imaging camera (Maestro, CRi, Woburn, Massachosetts), it was possible to determine the biodistribution of two different optically labeled proteins with approximately time resolution. This type of multicolor dynamic contrast-enhanced imaging could be a potential tool to evaluate the pharmacokinetics of new drugs, organ function, receptor expression, and cell migration. A limitation of this study was the respiratory or physical movement. This resulted in some noise within the signal intensity time-course. Tighter fixation of the mouse body or controlled respiration might improve the consistency of signal changes in each ROI; however, this must be balanced against the risk of respiratory compromise during the experiment. Another limitation of this study was that the results were only semiquantitative. The next generation of optical imagers based on transmission scanning will allow tighter control of the amplitude of excitation and emission light combined with better modeling of skin and soft tissue absorption and will lead to better quantitation. Fluorescence tomographic optical imaging systems are another promising technique for better quantitation of NIR fluorescent dyes.20 We chose two common NIR fluorophores, Cy5.5 and Cy7, in these experiments. The advantages of Cy7 are that the signal contamination from autofluorescence is minimal and that the penetration in tissue is better than Cy5.5. However, the extinction coefficient of Cy7 is lower ( for Cy7 versus, for Cy5.5). Moreover, in order to excite both fluorophores, a bandpass filter that excludes wavelengths less than is used, which favors Cy5.5 because the excitation efficiency will be higher than Cy7 with this bandpass filter. Therefore, we used a twofold injected dose of each Cy7 labeled protein compared with that of the Cy5.5 labeled counterpart. In theory, Cy5.5 is preferred for imaging superficial structures such as skin and superficial vessels, while Cy7 is more suitable for imaging deeper organs such as the liver; however, light scattering from deeper structures reduces imaging resolution. Thus, in practice, both dyes are well suited for surface and subsurface imaging in biomedical applications. In conclusion, our study shows that the two-color dynamic contrast-enhanced spectrally resolved optical imaging can visualize and track multiple proteins simultaneously, thus allowing near-real-time semiquantitative assessment of pharmacokinetics of optically labeled probes. AcknowledgmentsThis research was supported by the Intramural Research Program of the NIH, National Cancer Institute, Center for Cancer Research. ReferencesJ. W. Bulte and
D. L. Kraitchman,
“Iron oxide MR contrast agents for molecular and cellular imaging,”
NMR Biomed., 17
(7), 484
–499
(2004). https://doi.org/10.1002/nbm.924 0952-3480 Google Scholar
A. R. Wafelman,
C. A. Hoefnagel,
R. A. Maes, and
J. H. Beijnen,
“Radioiodinated metaiodobenzylguanidine: a review of its biodistribution and pharmacokinetics, drug interactions, cytotoxicity and dosimetry,”
Eur. J. Nucl. Med., 21
(6), 545
–559
(1994). https://doi.org/10.1007/BF00173043 0340-6997 Google Scholar
N. Hylton,
“Dynamic contrast-enhanced magnetic resonance imaging as an imaging biomarker,”
J. Clin. Oncol., 24
(20), 3293
–3298
(2006). 0732-183X Google Scholar
M. van Vliet,
C. F. van Dijke,
P. A. Wielopolski,
T. L. ten Hagen,
J. F. Veenland,
A. Preda,
A. J. Loeve,
A. M. Eggermont, and
G. P. Krestin,
“MR angiography of tumor-related vasculature: from the clinic to the micro-environment,”
Radiographics, 25
(1), S85
–S98
(2005). 0271-5333 Google Scholar
G. Antoch,
L. S. Freudenberg,
T. Beyer,
A. Bockisch, and
J. F. Debatin,
“To enhance or not to enhance? 18F-FDG and CT contrast agents in dual-modality 18F-FDG PET/CT,”
J. Nucl. Med., 45
(1), 56S
–65S
(2004). 0161-5505 Google Scholar
R. C. Semelka and
T. K. Helmberger,
“Contrast agents for MR imaging of the liver,”
Radiology, 218
(1), 27
–38
(2001). 0033-8419 Google Scholar
A. G. Morell,
R. A. Irvine,
I. Sternlieb,
I. H. Scheinberg, and
G. Ashwell,
“Physical and chemical studies on ceruloplasmin. V. metabolic studies on sialic acid-free ceruloplasmin in vivo,”
J. Biol. Chem., 243
(1), 155
–159
(1968). 0021-9258 Google Scholar
R. J. Stockert,
“The asialoglycoprotein receptor: relationships between structure, function, and expression,”
Physiol. Rev., 75
(3), 591
–609
(1995). 0031-9333 Google Scholar
N. Kokudo,
D. R. Vera, and
M. Makuuchi,
“Clinical application of TcGSA,”
Nucl. Med. Biol., 30
(8), 845
–849
(2003). https://doi.org/10.1016/S0969-8051(03)00113-6 0969-8051 Google Scholar
D. R. Vera,
K. A. Krohn,
R. C. Stadalnik, and
P. O. Scheibe,
“Tc-99m-galactosyl-neoglycoalbumin: in vivo characterization of receptor-mediated binding to hepatocytes,”
Radiology, 151
(1), 191
–196
(1984). 0033-8419 Google Scholar
H. Kobayashi,
S. Kawamoto,
R. A. Star,
T. A. Waldmann,
M. W. Brechbiel, and
P. L. Choyke,
“Activated clearance of a biotinylated macromolecular MRI contrast agent from the blood pool using an avidin chase,”
Bioconjugate Chem., 14
(5), 1044
–1047
(2003). https://doi.org/10.1021/bc034064l 1043-1802 Google Scholar
H. Kobayashi,
H. Sakahara,
M. Hosono,
Z. S. Yao,
S. Toyama,
K. Endo, and
J. Konishi,
“Improved clearance of radiolabeled biotinylated monoclonal antibody following the infusion of avidin as a ‘chase’ without decreased accumulation in the target tumor,”
J. Nucl. Med., 35
(10), 1677
–1684
(1994). 0161-5505 Google Scholar
H. Dafni,
A. Gilead,
N. Nevo,
R. Eilam,
A. Harmelin, and
M. Neeman,
“Modulation of the pharmacokinetics of macromolecular contrast material by avidin chase: MRI, optical, and inductively coupled plasma mass spectrometry tracking of triply labeled albumin,”
Magn. Reson. Med., 50
(5), 904
–914
(2003). https://doi.org/10.1002/mrm.10638 0740-3194 Google Scholar
A. H. Kwon,
S. K. Ha-Kawa,
S. Uetsuji,
T. Inoue,
Y. Matsui, and
Y. Kamiyama,
“Preoperative determination of the surgical procedure for hepatectomy using technetium-99m-galactosyl human serum albumin (99mTc-GSA) liver scintigraphy,”
Hepatology (Philadelphia, PA, U. S.), 25
(2), 426
–429
(1997). 0270-9139 Google Scholar
Y. Hama,
S. Kosuda,
Y. Iwasaki,
T. Kaji, and
S. Kusano,
“Technetium Tc 99m DTPA galactosyl human serum albumin to measure changes in hepatic functional reserve after transcatheter arterial embolization of the liver,”
Can. Assoc. Radiol. J., 52
(6), 399
–403
(2001). Google Scholar
P. K. Chattopadhyay,
D. A. Price,
T. F. Harper,
M. R. Betts,
J. Yu,
E. Gostick,
S. P. Perfetto,
P. Goepfert,
R. A. Koup,
S. C. De Rosa,
M. P. Bruchez, and
M. Roederer,
“Quantum dot semiconductor nanocrystals for immunophenotyping by polychromatic flow cytometry,”
Nat. Med., 12
(8), 972
–977
(2006). 1078-8956 Google Scholar
R. M. Hoffman,
“The multiple uses of fluorescent proteins to visualize cancer in vivo,”
Nat. Rev. Cancer, 5
(10), 796
–806
(2005). https://doi.org/10.1038/nrc1717 1474-175X Google Scholar
M. A. Funovics,
H. Alencar,
H. S. Su,
K. Khazaie,
R. Weissleder, and
U. Mahmood,
“Miniaturized multichannel near infrared endoscope for mouse imaging,”
Mol. Imaging, 2
(4), 350
–357
(2003). https://doi.org/10.1162/153535003322750691 1535-3508 Google Scholar
Y. Hama,
Y. Urano,
Y. Koyama,
M. Bernardo,
P. L. Choyke, and
H. Kobayashi,
“Simultaneous two-color spectral fluorescence lymphangiography with near infrared quantum dots to map two lymphatic flows from the breast and the upper extremity,”
Breast Cancer Res. Treat., 17
(6), 1426
–1431
(2006). 0167-6806 Google Scholar
V. Ntziachristos,
E. A. Schellenberger,
J. Ripoll,
D. Yessayan,
E. Graves, A. Bogdanov Jr., L. Josephson, and
R. Weissleder,
“Visualization of antitumor treatment by means of fluorescence molecular tomography with an annexin V-Cy5.5 conjugate,”
Proc. Natl. Acad. Sci. U.S.A., 101
(33), 12294
–12299
(2004). https://doi.org/10.1073/pnas.0401137101 0027-8424 Google Scholar
|


