
|
|
1.IntroductionAbsorption of light in human tissues is relatively low in the near-infrared wavelength region. Thus, light from this so-called “biological optical window” can penetrate even several centimeters into the tissue. However, high scattering at these wavelengths causes optical transmission/reflectance measurements to have a limited spatial resolution. On the other hand, different spectral properties of oxy- and deoxyhemoglobin measurements of the tissue absorption at several wavelengths allow for estimation of tissue oxygenation.1, 2 This functional information may be important for clinical assessment of oxygenation of the brain,2, 3, 4 muscles,5, 6 or for detection of breast tumors.7 Recently it has been shown that the spatial resolution of near-infrared spectroscopy (NIRS) can be improved by application of modern measurement techniques. Frequency- and time-domain techniques were developed and applied in many NIRS studies. These methods are based on the emission of intensity modulated light or picosecond light pulses into the tissue. The specific advantage offered by these techniques is that they allow for direct measurement of mean photon pathlength and the estimation of absolute concentrations of chromophores. In the frequency-domain technique, analysis of the phase shift between the initial wave and the light detected on the surface of the tissue is carried out.8 The phase shift is directly related to the mean time of flight of photons. In time-resolved near infrared spectroscopy (TRNIRS), emission of short (picosecond) light pulses and the analysis of the broadening of the pulse during its travel between the points of emission and detection is performed.9, 10 NIRS has been successfully applied in the analysis of brain oxygenation in neonates and infants.11, 12 In such cases the influence of the extracerebral tissue (skin, skull) on the signals measured is small, and it can be neglected. Because of the small size of the head, even the tomographic reconstruction of absorption and the reduced scattering coefficient in the brain tissue can be obtained. 13, 14, 15, 16 Application of frequency- or time-resolved NIRS is beneficial, especially when the head of an adult is examined and a depth-resolved analysis of the hemoglobin concentration changes must be applied to estimate oxygenation of the brain tissue with higher accuracy. Recently, the time-domain method has been shown to allow for evaluation of changes of the optical properties, as well as changes of oxy- and deoxyhemoglobin concentrations with depth discrimination.17, 18 Measurements of brain oxygenation changes caused by neuronal stimulus are often challenging because of the difficulties in determining the location of the focal point of stimulation on the surface of the cortex. In particular, proper positioning of the optode on the surface of the head is important when oxygenation changes are observed in neurophysiological experiments, i.e., during motor or visual stimulations. The NIRS technique has been extensively tested in monitoring changes of brain oxygenation in acute stroke,19 during hypothermic heart surgery,20 and in carotid artery endarterectomy.21 Moreover, NIRS has been applied to estimate brain perfusion by analysis of the inflow and the washout of the optical contrast agent.22, 23, 24 In all these applications, a large number of the emission and detection points located on the surface of the head can be applied. In consequence, the changes of brain oxygenation and/or perfusion can be imaged, and the ischemic areas can be localized. Several optical systems allowing image changes of brain oxygenation have been proposed. Continuous wave,25, 26, 27 frequency-domain,28, 29 and time-domain 30, 31, 32, 33, 34 systems have been reported. We present a time-resolved optical instrument that allows for noninvasive assessment of oxygenation of the brain cortex. The depth-resolved changes in oxy- and deoxyhemoglobin levels can be calculated using the moments of distributions of times of flight of photons (DTOFs) measured at two wavelengths in the near-infrared region. The instrument is equipped with picosecond diode lasers, fast photodetectors, and time-correlated single photon counting electronics. The combination of data from multiple sources that are switched sequentially and detectors distributed on the surface of the head, with the depth-resolved analysis based on the moments of DTOFs, enables imaging of cortex oxygenation. 2.Methods2.1.InstrumentationThe TRNIRS system we developed is shown in Fig. 1 . It consists of two semiconductor diode lasers and eight detection channels with time-correlated single photon counting electronics. Fig. 1Time-resolved NIR topography system for cerebral oxygenation imaging. SEPIA is the laser diode driver, LH1 and LH2 are lasers heads, SW1 and SW2 are 1:9 optical switches, PMT is the photomultiplier tubes, AMP is the preamplifiers and TCSPC is the PCI boards for time-correlated single photon counting. 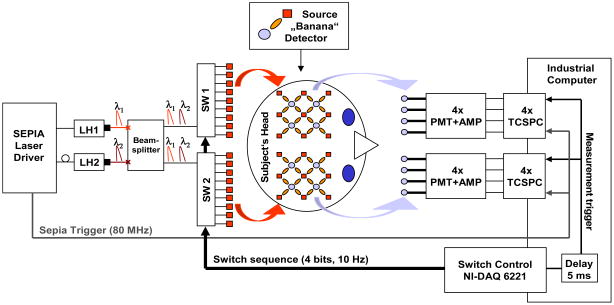 A laser diode driver (PDL 808 Sepia, PicoQuant, Berlin, Germany) and two semiconductor laser heads operating at wavelengths of 832 and were used. Light pulses from both diodes were generated with the repetition rate of . The light pulse trains from both diodes were shifted in time by half of the repetition period. This temporal shift allowed us to analyze distributions of times of flight of photons at both wavelengths. To introduce laser light from the two laser heads into two optical fibers, an adjustable optical setup with a 50:50 glass beam splitter (Thin Film Imaging Technologies, Incorporated, Greenfield, Massachusetts) was constructed. After splitting the beams from the two lasers, the light pulses are delivered sequentially to 18 locations on the head (nine per each hemisphere) by using two optomechanical switches (Piezosystem jena, GmbH, Jena, Germany). The switches are controlled with the PCI board NI-DAQ 6221 (National Instruments, Austin, Texas) at a switching frequency of . The switching time is less than . The tips of the output fibers from the switches are positioned in a array on each hemisphere, and they are located directly on the surface of the head, together with the detecting fiber bundles. An optode holder was constructed using a thermoplastic material (WFR/Aquaplast Corporation, Wyckoff, New Jersey), soft rubber, and Velcro strips [Figs. 2a and 2b ] to fix the source fibers and the detecting bundles. For every source-detector pair, the interoptode distance is . Different sizes of the optode setups allowed us to fix the fibers and bundles on heads of different sizes. Fig. 2Photography of (a) the optode holders of different size fixed on (b) the head of the manniquin.  The diffusely reflected light was delivered to the detectors using 1.5-m-long fiber bundles with a diameter of and (Loptek, Berlin, Germany). Eight photomultiplier tubes (R7400U-02, Hamamatsu Photonics, Japan) were used for detection of the diffusely reflected light. Each photomultiplier was located separately in the electrically shielded box, together with the high voltage unit and preamplifier. The power of the light delivered to photomultipliers was adjusted by the neutral density filters located between the fiber bundles and the detectors. Independent PCI boards with time-correlated single photon counting electronics (SPC-134, Becker and Hickl, Berlin, Germany) were used for acquisition of distribution of times of flight of photons. Recording of DTOFs was triggered by the 10-Hz generator, which synchronously controlled the optomechanical switches. To avoid data acquisition during the switching period, the trigger signal from the generator was delayed by . The software for acquisition of distribution of times of flight of photons was developed in the LabView v.7 environment (National Instruments). The instrumental response function was measured by positioning the source fibers in front of the detecting bundles. The detecting bundles were covered with a sheet of white paper to fill up the whole numerical aperture of the bundle.35 The instrumental response function as measured for every source-detector pair at both wavelengths was not longer than [full width at half maximum (FWHM)]. The measurement system in the presented configuration allows us to record distributions of times of flight of photons for 32 source-detector pairs corresponding to 32 “banana” volumes, forming a array on each hemisphere. The acquisition of DTOFs starts after the switching period is finished, and for every location of the source it is completed within . Parallel acquisition of the two spot maps takes about . 2.2.Data AnalysisFor analysis of the measured data, algorithms based on a mathematical model of the light transport in the turbid media36 and a method of depth discrimination using moments of the DTOFs18 were implemented. To separate information from the extra- and intracerebral layers of the head, so-called sensitivity factors were computed from the model of light propagation in the tissue. These sensitivity factors bind the calculated statistical moments of DTOFs with the changes in the absorption coefficient at different depths in the tissue under investigation.17, 18, 37 The phenomena of light propagation in the turbid medium can be described by the time-dependent diffusion equation.38, 39 The photon fluence rate as a function of time and position in the tissue described by vector depends on the optical properties of the medium: where describes the photon source, is the velocity of the light in the medium, is the diffusion coefficient , is the absorption coefficient of the medium, and is the reduced scattering coefficient.40, 41By solving this equation for the semi-infinite, homogenous medium, assuming a delta Dirac light source pulse, diffuse reflectance can be derived as a function of time and distance between the source and the detector38: Equation 2 describes light propagation in the medium with absorption and the diffusion coefficient distributed homogenously over the whole volume. When a change of absorption coefficient appears in a small inclusion of a sampling volume inside the investigated medium in a location defined by vector , the time-dependent change of diffuse reflectance on the surface of the medium at source-detector separation can be calculated:where means operation of convolution. Function describes the time-dependent fluence rate of photons in the medium at the location . is the escape function, which describes the probability that the photon emitted from location will reach the detector at distance from the source position.36Distributions of times of flight of photons diffusely reflected from the medium with the inclusion located at can be then calculated using the formula: Normalized moment of order of the distribution is defined by:Changes in these moments of theoretical DTOFs caused by local changes of absorption in a sampling volume located at can be calculated using the formulas18: where is the change in attenuation, is the total number of photons, is the mean time of flight of photons, and is the variance of the DTOF. The quantities with index refer to a homogeneous medium.Furthermore, the obtained changes in the moments can be used in the calculation of sensitivity factors describing changes of the moments (attenuation, the mean time of flight, and the variance of the DTOF) caused by changes of absorption in defined small volume indexed by . These sensitivity factors, called the mean partial pathlength (MPP), the mean time sensitivity factor (MTSF), and the variance sensitivity factor (VSF)18 are: For the analysis of the in vivo data, it has been assumed that the medium can be simulated by a layered structure with the sensitivity factors for the layers obtained by summing up , , and in volumes corresponding to extracerebral and brain tissues.Particularly, the medium was divided into voxels of size . The sensitivity factor of the extracerebral tissue was obtained by the integration of five layers of voxels forming the tissue compartment of thickness . The next 15 layers were assumed to correspond to intracerebral tissue, and the sensitivity factors for this layer were calculated by integration of these layers. The proposed method of calculation of the sensitivity factors by using the diffusion approximation is much faster than the Monte Carlo algorithm described in Ref. 18. Unfortunately, this method can only be used to calculate sensitivity factors with the assumption that initially the medium is homogeneous, and it gives significant errors in the vicinity of the source and the detector positions. To provide the background optical properties for calculations of the sensitivity factors used for the analysis of the in vivo data, and were evaluated from the measurement of the DTOFs on the head of the subject. The method of moments42 was used to obtain the optical properties of the medium with the assumption of homogeneity of the tissue under investigation. In Ref. 18 the authors used changes in the moments measured at four interoptode separations for estimation of changes of the absorption coefficient in ten layers of the tissue. Unfortunately, our imaging system does not allow for a multidistance time-resolved measurement. Thus, we used the calculated sensitivity factors together with changes in three moments measured at a single interoptode distance to estimate changes of the absorption coefficient in two layers of the medium (corresponding to extra- and intracranial tissue) according to the algorithm proposed in Ref. 18. A system of equations with two unknowns: in the superficial layer and in the deeper layer, and three knowns represented by changes in three moments of DTOFs, together with their sensitivity factors for each layer, was solved using the least squares method. Changes of absorption coefficient in the two layers (indexed by ) were estimated at two wavelengths. These changes are related to the changes in concentrations of oxy- and deoxyhemoglobin ( and , respectively): where and are the molar extinction coefficients of oxy- and deoxyhemoglobin, respectively. The molar extinction coefficients were taken from spectra published by Wray 43For every measured DTOF, background subtraction and correction for differential nonlinearity of the TCSPC electronics were performed. In calculation of the moments, integration was carried out for that part of the DTOF in which the number of counts dropped below 1% of its maximum value. 3.Results of the Phantom Experiments3.1.Liquid PhantomStability, accuracy, and linearity of the imager were tested. The protocols used were similar to those proposed by the European Network MEDPHOT (optical methods for medical diagnosis and monitoring of diseases).44 For this purpose, the physical, liquid phantom was constructed allowing for simultaneous data acquisition from 32 source-detector pairs. A fish tank was filled with a solution of milk (3.5% fat) and water (3:1), with black ink (Rotring, Germany) added to obtain optical properties in the range of the optical properties typical of living tissue. All the optodes at the two source-detector arrays were placed on the same surface of the phantom to provide measurements in semi-infinite geometry and to obtain the same homogenous conditions for all the measured source-detector pairs. The optodes were located not closer than apart from the walls of the fish tank, which minimized influence of ambient light or interactions of photons with the walls. 3.2.Stability of the Apparatus32 DTOFs corresponding to all source-detector pairs were measured during just after switching on all the subunits of the system. This test was repeated five times on consecutive days, on the liquid phantom described before. Typical time courses of the moments of DTOFs recorded during these experiments are presented in Fig. 3 . Fig. 3Stability of the system, presented as the moment time courses after switching on the system: (a) is the total number of photons, (b) mean time of flight of photons , and (c) variance of the DTOF.  For the total number of detected photons and for variance in Fig. 3, a warm-up time necessary to avoid the low frequency drift was about . After this time, and were stable, and the fluctuations of these signals were not larger than . The mean time of flight of photons presented in line (b) in Fig. 3 demonstrates a drift even after . This effect was caused by the time drift of the laser pulses,44 and it had a relatively low influence on the measured changes in the mean time of flight and the changes of the absorption coefficient in shorter time periods. Unfortunately, this drift caused errors when the optical properties in absolute values were calculated. To minimize this error, the measurements of the absolute values of the absorption and scattering coefficients should be performed after a very long warm-up time when the drift of the mean time of flight did not exceed 10% per 1 . The noise level of the measurement was also evaluated by calculation of the coefficient of variation of the moments of DTOFs for all the source-detector pairs. Coefficients of variations (CV) of the moments of DTOFs (see Fig. 4 ) were defined as the ratios of standard deviation and the mean value: The calculated coefficients of variations of the moments showed that, for a typical range of number of counted photons per second (from 30,000 to 2,000,000), the noise level was lower than 1%. For the variance, the noise level was higher, and it reached a few percent for a low number of the counted photons.Fig. 4Coefficients of variation (CV) of the moments of the DTOFs versus number of photons collected. Statistics for all 32 source-detector pairs are presented: (a) total number of photons , (b) mean time of flight of photons , and (c) variance of the DTOF. Black dots represent a mean value, starlets stand for minimum and maximum values of CV from all source-detector pairs. 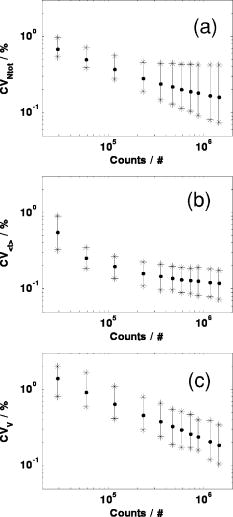 To prove the accuracy and linearity of the imager, phantom experiments were carried out with different absorption coefficients of the liquid. This experiment was carried out after a very long warm-up time period to ensure small errors resulting from the drift of the laser pulses. Statistics of the results of absorption and the reduced scattering coefficients ( and ) measured in 32 source-detector pairs are presented in Fig. 5 . Both coefficients were calculated from the moments of DTOFs with the method described by Liebert 42 The inaccuracy of the measurements of and between all 32 measured spots did not exceed 18% for both coefficients in the worst cases. The error of the measurement increased with the ink concentration in the phantom because of the lower number of detected photons during the 60-s-long data acquisition period. Fig. 5Estimated absorption and reduced scattering coefficients versus concentration of the black ink in a 25% water solution. Mean value, standard deviation, and maximum and minimum values calculated for the full set of 32 source-detector pairs are presented. The rectangles represent standard deviations of calculated coefficients; a horizontal line inside rectangle is the median value; and vertical whiskers represent maximum and minimum levels.  3.3.Depth SensitivityTo validate depth sensitivity of the constructed imager, the local change of the optical properties in the phantom was introduced using a 2-mm-diam plastic black ball immersed into the liquid and fixed using a transparent, thin fishing line (diameter of ). It was assumed that the absorption coefficient of this small inclusion was very high and that the ball did not scatter the light. The surface of the black ball was rough, but it was possible that some light could be reflected from that surface. The depth of the ball immersion in the liquid was changed from 0.5 up to with a step of . The reduced scattering coefficient and the absorption coefficient of the medium were estimated by calculating the moments of the measured DTOFs as it was proposed in Ref. 42. The source-detector distance was thus the whole measurement area was approximately with a pixel resolution. Changes in the moments of DTOFs obtained after immersion of the black ball, at various depths, were related to the measurement in homogenous medium without this inclusion. The results of , , for pixels for six depths are presented in Fig. 6 . Fig. 6Maps of the moments of recorded DTOFs from the liquid phantom with the absorbing inclusion located at various positions in respect to the array of optodes. 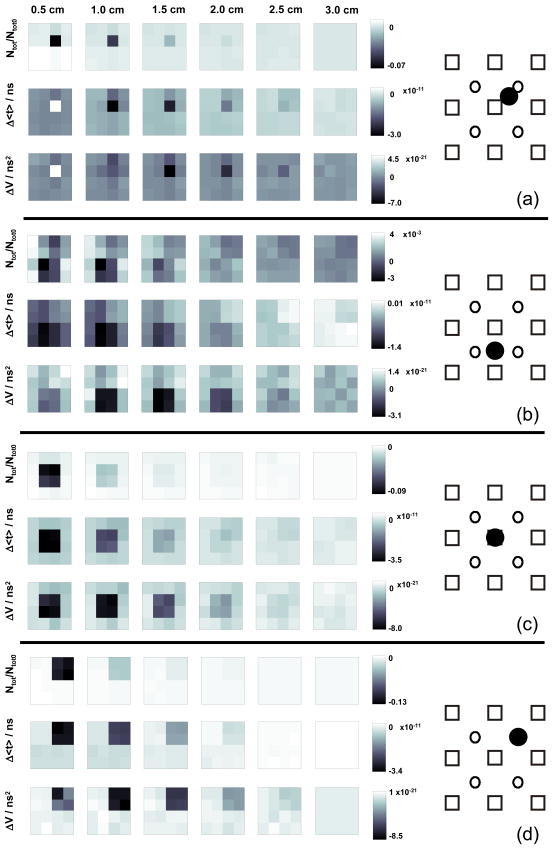 Changes in the moments of DTOFs were visualized for various locations of the ball in respect to the array of the optodes. In a series of experiments, the ball was located directly below the detecting bundle, directly below the source fiber, in a middle position between the two sources and two detectors, and in the middle between the source fiber and the detecting bundle. It should be noted that the contrast in the images rapidly decreases with the depth of the location of the inclusion, whereas the contrast decrease for and is much slower. It can be also pointed out that an inclusion located superficially causes an increase of the mean time of flight and, when the inclusion is located deeper, the decrease of the mean time of flight occurs. A similar effect can be noted on the maps obtained by the analysis of variance of the DTOFs. Additionally, a difference in the size of the inclusion positioned at locations different in respect to the array optodes can be noted. The noted differences in the size and contrast of the inclusion, as provided by the images of the different moments, are related to a higher depth and longitudinal sensitivity of the mean time of flight and variance of DTOF to the changes of the absorption coefficient, as compared to the sensitivity of .18, 45 The changes in the moments as a function of the depth, obtained for inclusions located between the source and the detector [case presented in Fig. 6a], are presented in Fig. 7a . The total number of photons showed the highest sensitivity to the absorbing inclusion located superficially, but it decreased rapidly with the depth. On the contrary, the mean time of flight and, to an even higher extent, the variance, shows a high sensitivity to absorption of an inclusion positioned deeply. Moreover, changes in variance are positive when a change of absorption appears in superficial layers, and they become negative when the absorbing inclusion is located deeper. A similar phenomenon can be observed for the sensitivity factor curves as a function of depth [see Fig. 7b]. Fig. 7Sensitivities of moments of DTOFs to the absorbing perturbation located at different depths in the medium. (a) Results of measurements are compared with (b) sensitivities of moments estimated theoretically for corresponding optical properties of the medium. Lines are shown only to guide readers’ eyes. 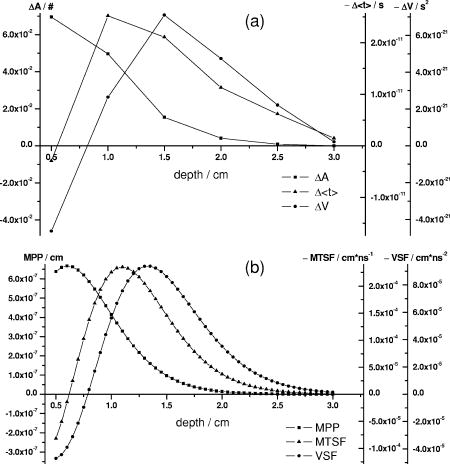 4.Results of the In Vivo ExperimentTo check the features of the system in the in vivo measurements on the human head, several tests with volunteers during functional motor stimulation were performed. 15 healthy subjects, the mean age of 30 years (nine females and six males) were examined. Before the experiment, all the volunteers gave informed consents. The motor cortex stimulation was carried out by a voluntary middle and index finger tapping with the thumb in a self-paced mode at a frequency of about 3 to . The volunteer was examined in a comfortable sitting position, and the optode arrays were fixed on the head using flexible Velcro strips. For every source fiber and detecting bundle, the hair was removed carefully from the space between the skin and fiber/fiber bundle tip. The source fibers and fiber bundles were fixed in a stand that was positioned over the subject’s head to avoid bending in the holder and movement of the fibers tips. The optode arrays were positioned on the head in such a way that the source detector, in pair 10, on the left hemisphere and respectively in pair 27 on the right hemisphere (see Fig. 8 ) matched the C3 and C4 locations (according to the 10-20 EEG system) corresponding to the position of the motor area. The finger tapping experiment lasted up to ten minutes and was performed in a dark room. For all 15 subjects, two experiments were carried out. 20 cycles of 15-s long left-hand finger tapping was followed by of rest, and then the same experiment was repeated after of rest with the right-hand finger tapping. The subjects were instructed visually and by sound commands to start and finish the task. The recorded DTOFs were analyzed by calculation of their moments for both wavelengths. For every subject, the signals of the moments were averaged synchronously with the cycles of the finger tapping. As an example, results of the motor stimulation experiment for one selected subject, averaged changes in , , and for the selected emitter detector pair placed above the stimulated area are presented in Fig. 9 . The vertical lines mark the beginning and end of the finger tapping period. In the subject studied, a typical change with the opposite polarity of the signal measured at the two wavelength appears in the mean time of flight and variance. These opposite changes in the motor cortex activation are caused by changes of the absorption coefficients at two wavelengths. During the finger tapping task, the concentration of oxyhemoglobin increases and the concentration of deoxyhemoglobin decreases. The total absorption coefficient at 832-nm wavelength increases and the mean time of flight and variance decreases, respectively. On the other side of the isobestic point at , the opposite phenomenon was observed. The trend in the courses was probably caused by the systemic changes in the blood flow during the finger tapping or by movement artifacts.27 Similar trends of changes of moments were observed in most of the investigated subjects. The optical studies of motor-evoked response are often characterized by a change in blood volume rather than a significant change in oxygenation. If the blood volume increases due to a sudden inflow of oxygenated blood to the stimulated cortex area, then the absorption will increase at wavelengths located on both sides of the isobestic point. This effect may cause the observed drop of total number of photons at both wavelengths used in our investigations [Fig. 9a]. Fig. 9Results of the motor stimulation experiment for one selected subject. Time courses of changes of moments of the DTOFs averaged over all cycles of finger tapping: (a) are the changes in total number of photons, (b) is the changes in mean time of flight of photons, and (c) is the changes in variance of the DTOF. Changes in moments are monitored at two wavelengths (gray line) and (black line). Vertical lines mark the beginning and end of the finger tapping task. 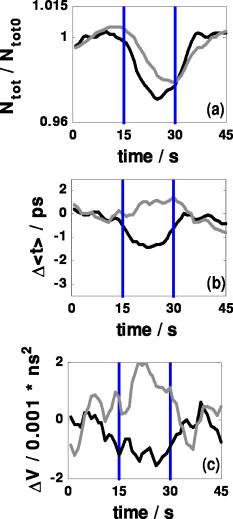 Using the data analysis algorithms and theory described, a separation of information originating from the intra- and extracerebral layers was performed. Reconstructed signals of the changes in concentration of oxy- and deoxyhemoglobin in the intracerebral layer during the right-hand finger tapping task are presented in Fig. 10 . Positioning of subplots presented in Fig. 10 correspond to the positioning of source-detector pairs according to the array shown in Fig. 8a. In the left hemisphere, a distinct increase of and a decrease of can be observed. A minor contralateral response of the motor cortex can also be observed. Fig. 10Time courses of reconstructed changes in oxy- (black line) and deoxy- (gray line) hemoglobin in the (a) left and (b) right hemisphere. A vertical line marks the beginning and end of the right-hand finger tapping task. 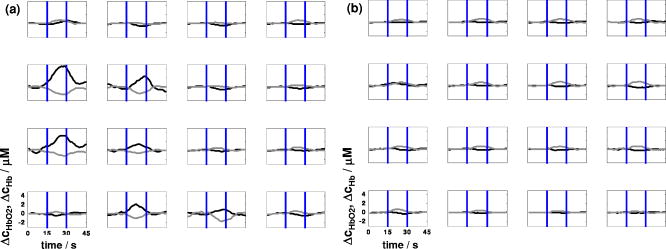 Minor responses to the motor stimulation can be also noted in the whole image. These responses can be explained by the systemic responses or by cross talk effects, which cannot be avoided in the data analysis process. Inaccuracy of the results can appear because of the assumption on the thickness of the extracerebral tissue layer. Another source of errors is the assumption on homogeneity of the tissue used in calculation of the sensitivity factors. Time courses of and presented in Fig. 10 were obtained in one selected subject. In most of the investigated volunteers, much of the same trends were observed. A sequence of images of and during the motor cortex activation for both hemispheres is presented in Fig. 11 . Fig. 11Maps of oxy- and deoxyhemoglobin during the motor cortex stimulation experiment (LH being the left hemisphere and RH the right hemisphere). During the right-hand finger tapping task, the changes in chromophore concentration appear on the opposite hemisphere.  Table 1Basic technical data of the optical systems used for brain imaging in adults.
The response of the motor cortex for the finger tapping task is clearly visible on the contralateral side. An increase of oxyhemoglobin is combined with a decrease of deoxyhemoglobin. A minor response to the motor stimulation can be observed in the whole monitored region of the tissue and also in the ipsilateral site of the brain. 5.Discussion and ConclusionsNear-infrared spectroscopy enables us to assess the brain oxygenation level in clinical conditions at bedside. In recent years, this method has been intensively explored by many research groups. Continuous wave, frequency domain, and most advanced time domain systems were used with various values of wavelengths in the near-infrared region. For evaluation of hemodynamics of the whole cortex regions (i.e., motor and visual cortex), multidetector systems were developed. A review of the NIRS imaging systems used in the experiments on adult heads is presented in Table 1 . 46, 47, 48, 49, 50, 51, 52, 53, 54, 55 Optical imaging systems developed in recent years have been used in many phantom studies and in vivo applications. In several reports, the authors used optical imaging systems for tissue phantom studies,30, 56 measurements on neonates,13, 57 and on animals.58, 59, 60 Comparison and review of these instruments can be found in Refs. 61, 62. The systems presented in Table 1 were successfully applied to evaluate human brain hemodynamics in adults, particularly during the functional activation. In the last few years, most up-to-date systems have been equipped with time-resolved data acquisition. Most of the advanced instruments based on time-resolved spectroscopy are equipped with a large number of source-detector pairs, and 1 to 3 wavelengths are used. The original construction based on the intensified charge-coupled device (CCD) is limited only to one wavelength and analysis of the time windows.33, 55 Most of the time-domain systems that have recently been constructed are based on the TCSPC technique for recording distributions of time of flight of photons. An interesting solution to increase the number of detecting channels by providing four-anode photomultipliers and routing signals from them was proposed by the group from Politechnico di Milano, which applied only four TCSPC boards.34, 54 However, such a procedure leads to a decrease of the number of photons collected in individual channels in proportion to their number, which decreases the signal-to-noise ratio. The design of the instrument reported here is based on the idea realized in Physikalisch-Technische Bundesanstalt in Berlin,53 in which four independent TCSPC channels were used with four photomultipliers and with a fiber switch to deliver the light pulses into nine points on the tissue under investigation. In such a solution, one map consists of 16 source-detector pairs for each of three wavelengths, and it can be recorded in less than . The time-domain imager described in the presented study is an extension of this design. We construct a system with eight independent TCSPC channels, which enable us to measure optical signals with very high photon count rates compared to the solutions where signal routing is applied. The time-resolved multichannel system is developed for diffuse optical topography of the adult human brain cortex oxygenation. The instrument allows for time-resolved measurements in a set of 32 source-detector pairs on the human head at two wavelengths. The instrument is mounted in a trolley ( , , ), and it can be easily transported within the hospital and used in clinical settings for monitoring of the brain function at bedside. In the choice of wavelengths, the spectral properties of oxy- and deoxyhemoglobin43 are considered. In recent studies it has been shown that two wavelengths are sufficient for an accurate estimation of the changes in hemoglobin concentrations.27, 63, 64 We use wavelengths located on both sides of the isosbestic point, at which the extinction coefficients of both hemoglobins are equal. A compromise is needed to choose proper wavelengths, considering the properties of photodetectors available for detection of diffusely reflected light with/over large interoptode distances. Above , the sensitivity of the photomultiplier tubes becomes a problem, and for short wavelengths (below ) absorption of light in tissue caused by hemoglobin is very high. These technical drawbacks and limitations, together with the analysis of recent studies on the cross talk of hemoglobin concentration calculation using attenuation of the optical signals65, 66 and availability of wavelengths of picosecond laser diodes, prompted us to choose these wavelengths. The wavelengths that we adapt to our system—687 and —fit with the sensitivity characteristics of the photomultipliers tubes that we used, and are optimal to assess the changes in concentrations of oxy- and deoxyhemoglobin in the tissue.27, 63, 64 The measurements at two widely spaced wavelengths (687 and ) cause the volume of sampled tissues to be different due to differences in optical properties at these wavelengths. This difference in sampling volume may lead to uncertainty of calculated changes of oxy- and deoxyhemoglobin concentration for inhomogeneous tissue structures. The analysis of the recorded curves, using the calculation of moments of DTOFs, allows us to evaluate the changes in oxy- and deoxyhemoglobin with depth discrimination, and it can be used for monitoring of the patient’s cerebral hemodynamics in clinical settings. The theoretical analysis of light propagation in tissue is carried out with the use of diffusion approximation, and the moments of distributions of times of flight of photons. This analysis allows for a depth-resolved estimation of changes of the absorption coefficient, and finally, estimation of changes in oxygenation in intracerebral tissues. The accuracy, stability, and linearity of the developed system are verified using the technical test based on the protocols provided by MEDPHOT.44 Standard deviation of the absorption coefficient measured at 32 source-detector pairs is about 5%. The signal-to-noise ratio analysis shows that for count rates used typically in in vivo experiments, the coefficient of variation is below 1% in all the calculated moments of DTOFs. The signal-to-noise ratio of the calculated moments decreases with the order of the moment and is the poorest in signals representing the changes in variance. This phenomenon is related to the small number of late photons detected.42, 67 The signal-to-noise ratio can be improved by the increase of the number of photons that arrive to the photodetector, which can be potentially increased by increase of the power of the laser source, but such a solution needs an application of high power lasers and is restricted by ethical issues. Unfortunately, the number of photons escaping from the tissue at large source-detector separations is very limited. Additionally, the high frequency pulses from the photomultiplier cannot be processed by time-correlated single photon counting electronics because of the appearance of the pile-up effect. Considering these limitations, in the depth-resolved reconstruction of oxy- and deoxyhemoglobin, a low noise level of moments (in particular and ) is needed, and the count rates should be as high as possible. For validation of the depth sensitivity of the instrument and the data analysis procedures, a liquid physical phantom is constructed in which the local absorption inclusion is located at various depths. This local change of absorption is simulated by the black plastic ball. Analysis of the recorded data confirms that the time-resolved measurement allows us to differentiate information from intra- and extracerebral tissues. The measured distributions of times of flight of photons are analyzed using their moments (attenuation, the mean time of flight, and variance). It has experimentally been confirmed that these moments of the DTOFs are differently sensitive to the changes appearing in the superficial and deeper tissue layers. In particular, it is noted that an increase in absorption of the superficial layer leads to an increase of and , whereas an increase of absorption in the deeper layer causes a decrease of both these moments. These phenomena may be very useful in analysis of the responses caused by the cerebral functional stimulation. During such stimulations, a certain systemic increase of oxygenation can be expected in both intra- and extracerebral tissues. This increase should be discriminated from the increase of oxygenation caused by the neuronal activation originating from the stimulated cortical area. The systemic increase of absorption may potentially cause an increase of and originating from superficial tissues, which is superimposed with the corresponding decrease of the moments originating from the brain cortex. This superposition could lead to a suppression of the influence of the systemic stimulation of signals of the moments ( and ) measured, and thus to a more adequate contrast of changes of absorption caused by the neuronal stimulation reflected in these moments. The results of the stimulation of the motor cortex by the finger tapping task shows that the higher moments ( and ) allow us to image changes in the motor cortex area caused by the functional stimulation with better contrast than the attenuation data. In attenuation signals, nonphysiological responses are present, which are manifested as synchronous drops of the number of photons at both wavelengths used. These responses are present in all the optode positions on the head and can be connected with the movement artifacts, which are difficult to avoid during finger tapping. Such problems tend to disappear when the mean time of flight or variance of DTOF is considered. The constructed instrument demonstrates relatively good properties when compared with other time-resolved spectroscopy systems used in experiments on adults. The time-correlated single photon counting method with the independent acquisition channels allows us to measure DTOFs with high count rates of the detected photons (more than 1.5 million per second at one wavelength). This characteristic of the system allows us to switch the source position without a significant decrease in the signal-to-noise ratio. Our future work will focus on further testing of the system on more realistic tissue phantoms as well as on comparison of the time-resolved optical imager with other imaging modalities, i.e., single photon emission computed tomography (SPECT) and functional magnetic resonance imaging (fMRI) in clinical settings. We also will consider an application of the presented imager in measurements with exogenous dye. AcknowledgmentsThis study has been supported by research project number 3T11E00627 financed by the State Committee for Scientific Research of the Republic of Poland. ReferencesF. F. Jobsis,
“Noninvasive, infrared monitoring of cerebral and myocardial oxygen sufficiency and circulatory parameters,”
Science, 198 1264
–1267
(1977). https://doi.org/10.1126/science.929199 0036-8075 Google Scholar
A. Villringer and
B. Chance,
“Non-invasive optical spectroscopy and imaging of human brain function,”
Trends Neurosci., 20
(10), 435
–442
(1997). https://doi.org/10.1016/S0166-2236(97)01132-6 0166-2236 Google Scholar
H. Obrig and
A. Villringer,
“Beyond the visible–imaging the human brain with light,”
J. Cereb. Blood Flow Metab., 23
(1), 1
–18
(2003). https://doi.org/10.1097/00004647-200301000-00001 0271-678X Google Scholar
H. Obrig,
R. Wenzel,
M. Kohl,
S. Horst,
P. Wobst,
J. Steinbrink,
F. Thomas, and
A. Villringer,
“Near-infrared spectroscopy: does it function in functional activation studies of the adult brain?,”
Int. J. Psychophysiol, 35
(2-3), 125
–142
(2000). 0167-8760 Google Scholar
T. Hamaoka,
H. Iwane,
T. Shimomitsu,
T. Katsumura,
N. Murase,
S. Nishio,
T. Osada,
Y. Kurosawa, and
B. Chance,
“Noninvasive measures of oxidative metabolism on working human muscles by near-infrared spectroscopy,”
J. Appl. Physiol., 81
(3), 1410
–1417
(1996). 8750-7587 Google Scholar
R. Boushel and
C. A. Piantadosi,
“Near-infrared spectroscopy for monitoring muscle oxygenation,”
Acta Physiol. Scand., 168
(4), 615
–622
(2000). https://doi.org/10.1046/j.1365-201x.2000.00713.x 0001-6772 Google Scholar
D. Grosenick,
H. Wabnitz,
K. T. Moesta,
J. Mucke,
M. Moller,
C. Stroszczynski,
J. Stossel,
B. Wassermann,
P. M. Schlag, and
H. Rinneberg,
“Concentration and oxygen saturation of haemoglobin of 50 breast tumours determined by time-domain optical mammography,”
Phys. Med. Biol., 49
(7), 1165
–1181
(2004). https://doi.org/10.1088/0031-9155/49/7/006 0031-9155 Google Scholar
B. Chance,
M. Cope,
E. Gratton,
N. Ramanujam, and
B. Tromberg,
“Phase measurement of light absorption and scatter in human tissue,”
Rev. Sci. Instrum., 69
(10), 3457
–3481
(1998). https://doi.org/10.1063/1.1149123 0034-6748 Google Scholar
B. Chance,
S. Nioka,
J. Kent,
K. McCully,
M. Fountain,
R. Greenfeld, and
G. Holtom,
“Time-resolved spectroscopy of hemoglobin and myoglobin in resting and ischemic muscle,”
Anal. Biochem., 174 698
–707
(1988). https://doi.org/10.1016/0003-2697(88)90076-0 0003-2697 Google Scholar
J. Hebden,
R. Kruger, and
K. Wong,
“Time resolved imaging through a highly scattering medium,”
Appl. Opt., 30 788
–794
(1991). 0003-6935 Google Scholar
M. Cope and
D. Delpy,
“System for long-term measurement of blood and tissue oxygenation on newborn infants by near infra-red transillumination,”
Med. Biol. Eng. Comput., 26 289
–294
(1988). https://doi.org/10.1007/BF02447083 0140-0118 Google Scholar
M. Wolf,
N. Brun,
G. Greisen,
M. Keel,
K. vonSiebenthal, and
H. Bucher,
“Optimising the methodology of calculating the cerebral blood flow of newborn infants from near infra-red spectrophotometry data,”
Med. Biol. Eng. Comput., 34 221
–226
(1996). https://doi.org/10.1007/BF02520077 0140-0118 Google Scholar
T. Austin,
A. P. Gibson,
G. Branco,
R. M. Yusof,
S. R. Arridge,
J. H. Meek,
J. S. Wyatt,
D. T. Delpy, and
J. C. Hebden,
“Three dimensional optical imaging of blood volume and oxygenation in the neonatal brain,”
Neuroimage, 31
(4), 1426
–1433
(2006). 1053-8119 Google Scholar
A. P. Gibson,
T. Austin,
N. L. Everdell,
M. Schweiger,
S. R. Arridge,
J. H. Meek,
J. S. Wyatt,
D. T. Delpy, and
J. C. Hebden,
“Three-dimensional whole-head optical tomography of passive motor evoked responses in the neonate,”
Neuroimage, 30
(2), 521
–528
(2006). 1053-8119 Google Scholar
J. C. Hebden,
A. Gibson,
T. Austin,
R. M. Yusof,
N. Everdell,
D. T. Delpy,
S. R. Arridge,
J. H. Meek, and
J. S. Wyatt,
“Imaging changes in blood volume and oxygenation in the newborn infant brain using three-dimensional optical tomography,”
Phys. Med. Biol., 49
(7), 1117
–1130
(2004). https://doi.org/10.1088/0031-9155/49/7/003 0031-9155 Google Scholar
J. C. Hebden,
A. Gibson,
R. M. Yusof,
N. Everdell,
E. M. Hillman,
D. T. Delpy,
S. R. Arridge,
T. Austin,
J. H. Meek, and
J. S. Wyatt,
“Three-dimensional optical tomography of the premature infant brain,”
Phys. Med. Biol., 47
(23), 4155
–4166
(2002). https://doi.org/10.1088/0031-9155/47/23/303 0031-9155 Google Scholar
J. Steinbrink,
H. Wabnitz,
H. Obrig,
A. Villringer, and
H. Rinneberg,
“Determining changes in NIR absorption using a layered model of the human head,”
Phys. Med. Biol., 46
(3), 879
–896
(2001). https://doi.org/10.1088/0031-9155/46/3/320 0031-9155 Google Scholar
A. Liebert,
H. Wabnitz,
J. Steinbrink,
H. Obrig,
M. Moller,
R. Macdonald,
A. Villringer, and
H. Rinneberg,
“Time-resolved multidistance near-infrared spectroscopy of the adult head:intracerebral and extracerebral absorption changes from moments of distribution of times of flight of photons,”
Appl. Opt., 43
(15), 3037
–3047
(2004). https://doi.org/10.1364/AO.43.003037 0003-6935 Google Scholar
F. Vernieri,
N. Rosato,
F. Pauri,
F. Tibuzzi,
F. Passarelli, and
P. M. Rossini,
“Near infrared spectroscopy and transcranial Doppler in monohemispheric stroke,”
Eur. Neurol., 41
(3), 159
–162
(1999). 0014-3022 Google Scholar
V. D. Kilpack,
S. A. Stayer,
E. D. McKenzie, C. D. Fraser Jr., D. B. Andropoulos,
“Limiting circulatory arrest using regional low flow perfusion,”
J. Extra Corpor. Technol., 36
(2), 133
–138
(2004). Google Scholar
P. Smielewski,
M. Czosnyka,
J. D. Pickard, and
P. Kirkpatrick,
“Assessment of cerebrovascular reactivity in patients with carotid artery disease using near-infrared spectroscopy,”
Acta Neurochir. Suppl. (Wien), 71 263
–265
(1998). 0065-1419 Google Scholar
M. Kohl-Bareis,
H. Obrig,
J. Steinbrink,
J. Malak,
K. Uludag, and
A. Villringer,
“Noninvasive monitoring of cerebral blood flow by a dye bolus method: separation of brain from skin and skull signals,”
J. Biomed. Opt., 7
(3), 464
–470
(2002). https://doi.org/10.1117/1.1482719 1083-3668 Google Scholar
A. Liebert,
H. Wabnitz,
J. Steinbrink,
M. Moller,
R. Macdonald,
H. Rinneberg,
A. Villringer, and
H. Obrig,
“Bed-side assessment of cerebral perfusion in stroke patients based on optical monitoring of a dye bolus by time-resolved diffuse reflectance,”
Neuroimage, 24
(2), 426
–435
(2005). 1053-8119 Google Scholar
C. Terborg,
S. Bramer,
S. Harscher,
M. Simon, and
O. W. Witte,
“Bedside assessment of cerebral perfusion reductions inpatients with acute ischaemic stroke by near-infrared spectroscopy and indocyanine green,”
J. Neurol., Neurosurg. Psychiatry, 75
(1), 38
–42
(2004). 0022-3050 Google Scholar
D. A. Boas,
T. Gaudette,
G. Strangman,
X. Cheng,
J. J. Marota, and
J. B. Mandeville,
“The accuracy of near infrared spectroscopy and imaging during focal changes in cerebral hemodynamics,”
Neuroimage, 13
(1), 76
–90
(2001). 1053-8119 Google Scholar
M. A. Franceschini,
S. Fantini,
J. H. Thompson,
J. P. Culver, and
D. A. Boas,
“Hemodynamic evoked response of the sensorimotor cortex measured noninvasively with near-infrared optical imaging,”
Psychophysiology, 40
(4), 548
–560
(2003). https://doi.org/10.1111/1469-8986.00057 0048-5772 Google Scholar
D. A. Boas,
A. M. Dale, and
M. A. Franceschini,
“Diffuse optical imaging of brain activation: approaches to optimizing image sensitivity, resolution, and accuracy,”
Neuroimage, 23
(1), S275
–288
(2004). 1053-8119 Google Scholar
B. Chance,
E. Anday,
S. Nioka,
S. Zhou,
L. Hong,
K. Worden,
C. Li,
T. Murray,
Y. Ovetsky,
D. Pidikiti, and
R. Thomas,
“Anovel method for fast imaging of brain function, non-invasively, with light,”
Opt. Express, 2
(10), 411
–423
(1998). 1094-4087 Google Scholar
R. M. Danen,
Y. Wang,
X. D. Li,
W. S. Thayer, and
A. G. Yodh,
“Regional imager for low-resolution functional imaging of the brain with diffusing near-infrared light,”
Photochem. Photobiol., 67
(1), 33
–40
(1998). https://doi.org/10.1562/0031-8655(1998)067<0033:RIFLRF>2.3.CO;2 0031-8655 Google Scholar
H. Eda,
I. Oda,
Y. Ito,
Y. Wada,
Y. Oikawa,
Y. Tsunazawa,
M. Takada,
Y. Tsuchiya,
Y. Yamashita,
M. Oda,
A. Sassaroli,
Y. Yamada, and
M. Tamura,
“Multichannel time-resolved optical tomographic imaging system,”
Rev. Sci. Instrum., 70
(9), 3595
–3602
(1999). https://doi.org/10.1063/1.1149965 0034-6748 Google Scholar
I. Miyai,
H. C. Tanabe,
I. Sase,
H. Eda,
I. Oda,
I. Konishi,
Y. Tsunazawa,
T. Suzuki,
T. Yanagida, and
K. Kubota,
“Cortical mapping of gait in humans: a near-infrared spectroscopic topography study,”
Neuroimage, 14
(5), 1186
–1192
(2001). 1053-8119 Google Scholar
H. Wabnitz,
M. Moeller,
A. Walter,
R. Macdonald,
R. Erdmann,
O. Raitza,
M. Kacprzak,
A. Liebert,
C. Drenckhahn,
J. P. Dreier,
S. Koch, and
J. Steinbrink,
“Depth-selective analysis of responses to functional stimulation recorded with a time-domain NIR brain imager,”
Biomedical Optics Topical Meeting, ME34
(2006) Google Scholar
J. Selb,
D. K. Joseph, and
D. A. Boas,
“Time-gated optical system for depth-resolved functional brain imaging,”
J. Biomed. Opt., 11
(4), 044008
(2006). https://doi.org/10.1117/1.2337320 1083-3668 Google Scholar
D. Contini,
A. Pifferi,
L. Spinelli,
A. Torricelli, and
R. Cubeddu,
“Design and characterization of a two-wavelengthmultichannel time-resolved system for optical topography,”
Biomedical Optics 2006 Technical Digest,
(2006) Google Scholar
A. Liebert,
H. Wabnitz,
D. Grosenick, and
R. Macdonald,
“Fiber dispersion in time domain measurements compromising the accuracy of determination of optical properties of strongly scattering media,”
J. Biomed. Opt., 8
(3), 512
–516
(2003). https://doi.org/10.1117/1.1578088 1083-3668 Google Scholar
M. Patterson and
B. Pogue,
“Mathematical model for time-resolved and frequency-domain fluorescence spectroscopy in biological tissues,”
Appl. Opt., 33 1963
–1974
(1994). 0003-6935 Google Scholar
M. Hiraoka,
M. Firbank,
M. Essenpris,
M. Cope,
S. R. Arridge,
P. vanderZee, and
D. T. Delpy,
“A Monte Carlo investigation of optical pathlength in inhomogeneous tissue and its application to near-infrared spectroscopy,”
Phys. Med. Biol., 38 1859
–1876
(1993). https://doi.org/10.1088/0031-9155/38/12/011 0031-9155 Google Scholar
M. S. Patterson,
B. Chance, and
B. C. Wilson,
“Time resolved reflectance and transmittance for the non/invasive measurement of tissue optical properties,”
Appl. Opt., 28 2331
–2336
(1989). 0003-6935 Google Scholar
A. Ishimaru,
“Diffusion of light in turbid material,”
Appl. Opt., 28 2210
–2215
(1989). 0003-6935 Google Scholar
K. Furutsu and
Y. Yamada,
“Diffusion approximation for adissipative random medium and the applications,”
Phys. Rev. E, 50
(5), 3634
–3640
(1994). https://doi.org/10.1103/PhysRevE.50.3634 1063-651X Google Scholar
R. Pierrat,
J. J. Greffet, and
R. Carminati,
“Photon diffusion coefficient in scattering and absorbing media,”
J. Opt. Soc. Am. A, 23
(5), 1106
–1110
(2006). https://doi.org/10.1364/JOSAA.23.001106 0740-3232 Google Scholar
A. Liebert,
H. Wabnitz,
D. Grosenick,
M. Moller,
R. Macdonald, and
H. Rinneberg,
“Evaluation of optical properties of highly scattering media by moments of distributions of times of flight of photons,”
Appl. Opt., 42
(28), 5785
–5792
(2003). 0003-6935 Google Scholar
S. Wray,
M. Cope,
D. T. Delpy,
J. S. Wyatt, and
E. O. Reynolds,
“Characterization of the near infrared absorption spectra of cytochrome aa3 and haemoglobin for the non-invasive monitoring of cerebral oxygenation,”
Biochim. Biophys. Acta, 933
(1), 184
–192
(1988). https://doi.org/10.1016/0005-2728(88)90069-2 0006-3002 Google Scholar
A. Pifferi,
A. Torricelli,
A. Bassi,
P. Taroni,
R. Cubeddu,
H. Wabnitz,
D. Grosenick,
M. Moller,
R. Macdonald,
J. Swartling,
T. Svensson,
S. Andersson-Engels,
R. L. van Veen,
H. J. Sterenborg,
J. M. Tualle,
H. L. Nghiem,
S. Avrillier,
M. Whelan, and
H. Stamm,
“Performance assessment of photon migration instruments: the MEDPHOT protocol,”
Appl. Opt., 44
(11), 2104
–2114
(2005). https://doi.org/10.1364/AO.44.002104 0003-6935 Google Scholar
R. Maniewski,
A. Liebert, and
M. Kacprzak,
“Time resolved optical spectroscopy system for cerebral oxygenation imaging,”
Ann. Intl. Conf. IEEE Eng. Med. Biol. Soc., 201
–204
(2005). Google Scholar
M. Igawa,
Y. Atsumi,
K. Takahashi,
S. Shiotsuka,
H. Hirasawa,
R. Yamamoto,
A. Maki,
Y. Yamashita, and
H. Koizumi,
“Activation of visual cortex in REM sleep measured by 24-channel NIRS imaging,”
Psychiatry Clin. Neurosci., 55
(3), 187
–188
(2001). 1323-1316 Google Scholar
K. Takahashi,
S. Ogata,
Y. Atsumi,
R. Yamamoto,
S. Shiotsuka,
A. Maki,
Y. Yamashita,
T. Yamamoto,
H. Koizumi,
H. Hirasawa, and
M. Igawa,
“Activation of the visual cortex imaged by 24 channel near-infrared spectroscopy,”
J. Biomed. Opt., 5
(1), 93
–96
(2000). https://doi.org/10.1117/1.429973 1083-3668 Google Scholar
A. Maki,
Y. Yamashita,
E. Watanabe, and
H. Koizumi,
“Visualizing human motor activity by using non-invasive optical topography,”
Front Med. Biol. Eng., 7
(4), 285
–297
(1996). 0921-3775 Google Scholar
A. Maki,
Y. Yamashita,
Y. Ito,
E. Watanabe,
Y. Mayanagi, and
H. Koizumi,
“Spatial and temporal analysis of human motoractivity using noninvasive NIR topography,”
Med. Phys., 22
(12), 1997
–2005
(1995). https://doi.org/10.1118/1.597496 0094-2405 Google Scholar
M. Kohl-Bareis,
C. Buckow,
H. Zank,
H. Obrig,
J. Steinbrink, and
A. Villringer,
“Near-infrared spectroscopic topographic imaging of cortical activation,”
(2002) Google Scholar
C. Buckow,
M. Kohl,
H. Zank,
H. Obrig,
K. Uludag,
J. Steinbrink,
H. Israel, and
A. Villringer,
“Assessment of cortival activation by multi channel topography,”
Neuroimage, 13
(6), S5
(2001). 1053-8119 Google Scholar
N. Everdell,
A. Gibson,
I. Tullis,
T. Vaithianathan,
J. Hebden, and
D. Delpy,
“A frequency multiplexed near-infrared topography system for imaging functional activation in the brain,”
Rev. Sci. Instrum., 76
(9), 093705
(2005). https://doi.org/10.1063/1.2038567 0034-6748 Google Scholar
H. Wabnitz,
M. Moller,
A. Walter,
R. Macdonald,
R. Erdmann,
O. Raitza,
M. Kacprzak,
A. Liebert,
C. Drenckhahn,
J. P. Dreier,
S. Koch, and
J. Steinbrink,
“Depth-selective analysis of responses to functional stimulation recorded with a time-domain NIR brain imager,”
ME34
(2006). Google Scholar
A. Torricelli,
D. Contini,
A. Pifferi,
L. Spinelli,
R. Cubeddu,
L. Craighero, and
L. Fadiga,
“Mapping cerebral hemodynamics in brain cortex by multi-channel time-resolved near-infrared spectroscopy,”
Biomed. Opt. 2006 Tech. Digest,
(2006) Google Scholar
J. Selb,
J. J. Stott,
M. A. Franceschini,
A. G. Sorensen, and
D. A. Boas,
“Improved sensitivity to cerebral hemodynamics during brain activation with a time-gated optical system: analytical model and experimental validation,”
J. Biomed. Opt., 10
(1), 11013
(2005). 1083-3668 Google Scholar
F. E. W. Schmidt,
M. E. Fry,
E. M. C. Hillman,
J. C. Hebden, and
D. T. Delpy,
“A 32-channel time-resolved instrument for medical optical tomography,”
Rev. Sci. Instrum., 71 256
–265
(2000). https://doi.org/10.1063/1.1150191 0034-6748 Google Scholar
Y. Chen,
S. M. Zhou,
C. H. Xie,
S. Nioka,
M. Delivoria-Papadopoulos,
E. Anday, and
B. Chance,
“Preliminary evaluation of dual wavelength phased array imaging on neonatal brain function,”
J. Biomed. Opt., 5
(2), 194
–200
(2000). https://doi.org/10.1117/1.429986 1083-3668 Google Scholar
J. P. Culver,
A. M. Siegel,
J. J. Stott, and
D. A. Boas,
“Volumetric diffuse optical tomography of brain activity,”
Opt. Lett., 28
(21), 2061
–2063
(2003). 0146-9592 Google Scholar
A. M. Siegel,
J. P. Culver,
J. B. Mandeville, and
D. A. Boas,
“Temporal comparison of functional brain imaging with diffuse optical tomography and fMRI during rat forepaw stimulation,”
Phys. Med. Biol., 48
(10), 1391
–1403
(2003). https://doi.org/10.1088/0031-9155/48/10/311 0031-9155 Google Scholar
G. Yu,
T. Durduran,
D. Furuya,
J. H. Greenberg, and
A. G. Yodh,
“Frequency-domain multiplexing system for in vivo diffuse light measurements of rapid cerebral hemodynamics,”
Appl. Opt., 42
(16), 2931
–2939
(2003). 0003-6935 Google Scholar
E. Sevick,
B. Chance,
J. Leigh,
S. Nioka, and
M. Maris,
“Quantitation of time- and frequency-resolved optical spectra for the determination of tissue oxygenation,”
Anal. Biochem., 195 330
–351
(1991). https://doi.org/10.1016/0003-2697(91)90339-U 0003-2697 Google Scholar
G. Strangman,
D. A. Boas, and
J. P. Sutton,
“Non-invasive neuroimaging using near-infrared light,”
Biol. Psychiatry, 52
(7), 679
–693
(2002). 0006-3223 Google Scholar
Y. Yamashita,
A. Maki, and
H. Koizumi,
“Wavelength dependence of the precision of noninvasive optical measurement of oxy-, deoxy- and total-hemoglobin concentration,”
Med. Phys., 28
(6), 1108
–1114
(2001). https://doi.org/10.1118/1.1373401 0094-2405 Google Scholar
H. Sato,
M. Kiguchi,
F. Kawaguchi, and
A. Maki,
“Practicality of wavelength selection to improve signal-to-noise ratio in near-infrared spectroscopy,”
Neuroimage, 21
(4), 1554
–1562
(2004). 1053-8119 Google Scholar
D. A. Boas,
K. Chen,
D. Grebert, and
M. A. Franceschini,
“Improving the diffuse optical imaging spatial resolution of the cerebral hemodynamic response to brain activation in humans,”
Opt. Lett., 29
(13), 1506
–1508
(2004). https://doi.org/10.1364/OL.29.001506 0146-9592 Google Scholar
K. Uludag,
J. Steinbrink,
A. Villringer, and
H. Obrig,
“Separability and cross talk: optimizing dual wavelength combinations for near-infrared spectroscopy of the adult head,”
Neuroimage, 22
(2), 583
–589
(2004). 1053-8119 Google Scholar
J. C. Hebden,
S. Arridge, and
M. Schwaiger,
“Investigation of alternative data types for time-resolved optical tomography,”
OSA Trends in Optics and Photonics, Advances in Optical Imaging and Photon Migration, 162
–167
(1998) Google Scholar
|


