

|
|
1.IntroductionThe use of photodynamic therapy (PDT) as an adjuvant therapy to treat intraperitoneal (IP) carcinomatosis following surgical debulking is under active investigation.1, 2, 3 However, deficiencies in knowledge of crucial PDT parameters in situ such as tissue oxygenation, photosensitizer uptake, and treatment light distribution make optimization of treatment parameters difficult.1, 3 Common clinical approaches for monitoring tissue oxygen level and photosensitizer uptake include in vivo techniques based on Eppendorf electrodes4, 5, 6, 7 and fluorescence spectroscopy,8, 9, 10, 11, 12 as well as ex vivo techniques such as immunohistochemistry, fluorescence imaging, and spectro-scopy of excised fresh and frozen tissues. The hypoxia marker, 2-(2-nitroimida-zol-1[H]-yl)-N-(2,2,3,3,3-pentafluoropropyl)acetamide (EF5), has been used clinically to detect hypoxia in tumor tissues from patients with intraperitoneal carcinomatosis,13 brain tumors,14, 15 soft tissue extremity sarcomas,16 squamous cell carcinomas,17 and other tumors.18 Quantitative fluorescence immunohistochemical analysis of EF5 adducts in tumors has, in turn, been demonstrated to correlate with radiation resistance preclinically,19 and with tumor necrosis and cytokine levels in human tumors.15, 18, 20 Photosensitizer fluorescence is sometimes used for detection of photosensitizer concentration in tissues ex vivo 13, 21, 22 and in vivo.9, 10, 11, 12, 23, 24 Ex vivo measurements can provide absolute values of photosensitizer concentration, which enable the determination of photosensitizer uptake in individual patients and in specific tissue types.13 Conversely, although in vivo photosensitizer fluorescence measurements have been correlated with PDT-induced depth of necrosis in animal tissues,25 typically only relative values of photosensitizer concentration are obtained unless additional calibration studies are performed. The sensitivity of optical methods to tissue absorption provides access to physiological parameters such as blood oxygen saturation, hemoglobin concentration, water and lipid content, and drug concentration.26 Diffuse reflectance spectroscopy (DRS), for example, has been used noninvasively to measure in vivo PDT dosimetry parameters such as tissue blood oxygenation, hemoglobin concentration, and photosensitizer concentration in animals27, 28, 29 and in humans.30, 31 DRS offers fast data acquisition using relatively simple and inexpensive instruments. Moreover, PDT-induced changes in oxygen and blood flow in rabbit and murine tumors, as measured by DRS and other photon migration devices, have been correlated with necrosis27 and are predictive of PDT outcome.29, 32 To further establish the clinical potential of real-time DRS for noninvasive monitoring of PDT, it is desirable to evaluate the relationship between DRS and the ex vivo methods currently used for quantification of two essential PDT dosimetry parameters: tissue oxygenation (or hypoxia) and photosensitizer concentration. The purpose of this pilot study is to compare in vivo DRS-derived tissue oxygenation and photosensitizer concentration data with ex vivo assays of the same tissues. We achieve this aim by quantifying and correlating the levels of oxygen and photosensitizer (motexafin lutetium, MLu) in the peritoneal tumors of two patients entered in our PDT phase 1 trial using two ex vivo methods in resected tumor tissues (i.e., EF5 binding and MLu fluorescence) and the in vivo DRS technique. MLu is a water-soluble second-generation synthetic photoactive drug33, 34 previously under investigation in a phase 1 clinical trial of prostate PDT.31, 35 For comparison, a second in-vivo/ex-vivo correlation study of MLu concentration was also performed in a radiation-induced fibrosarcoma (RIF) murine tumor model. Finally, in carrying out this investigation, we developed and implemented a prescription for determination of an optimal range of DRS source-detector separations and wavelengths for analysis of clinical data. We also evaluated boundary “errors” arising from the RIF murine tumor surface, using finite element (FEM) simulations. 2.Materials and Methods2.1.Human Subjects and Drugs AdministeredTumor tissue samples were selected from two patients for noninvasive in vivo DRS measurements, and ex vivo EF5 analysis and MLu fluorescence studies. Two patients were diagnosed with recurrent intra-abdominal mesothelioma [Patient 1 (Pt 1)] and a gastrointestinal stromal tumor [Patient 2 (Pt 2)], respectively. DRS measurements were performed on peritoneal metastases. All patients signed a study-specific informed consent and all experimental procedures were approved by the Institutional Review Board of the University of Pennsylvania and the Clinical Trials Scientific Review and Monitoring committee of the University of Pennsylvania Cancer Center. EF5 (Cancer Therapy Evaluation Program, National Cancer Institute) was administered intravenously at a dose of via a peripheral intravenous catheter before surgical debulking. MLu (manufactured by Pharmacyclics, Incorporated, Sunnyvale, California, and supplied by the Cancer Therapy Evaluation Program, National Cancer Institute) was administered intravenously before surgical debulking at a dose of . Tumor tissue samples for EF5 binding and MLu fluorescence were removed at surgery immediately after in vivo DRS measurements were obtained. Half of each resected tissue sample was labeled, placed in a specimen container, protected from light, and frozen at for later MLu fluorescence measurement. The remainder was placed in iced Excell 610 media (JRH Biosciences, Leneka, Kansas) with 15% fetal calf serum and frozen at in Tissue Tek OCT (Sakura Finetek USA, Incorporated, Torrance, California) for later EF5 binding assessment. The tumors were spread over the peritoneum, thus the size of the tumor before excision cannot be described. The excised tissues were (Pt 1, site 1, two samples), (Pt 2, site 1, one sample), and (Pt 2, site 2, one sample). Two adjacent tumor samples were excised from patient 1. The optical measurement was performed over the area of these two tumor samples before excision. For patient 1, the results of the optical measurement were compared with averaged results derived from both ex vivo measurements of the excised tumor samples. 2.2.Animal Tumor Model for Motexafin Lutetium Concentration ValidationRadiation-induced fibrosarcoma (RIF) tumors were propagated on the shoulders of C3H mice (Taconic, Germantown, New York) by the intradermal injection of cells36 approximately one week before MLu administration. At the time of the study, tumor size was in diameter, with a maximum volume of (tumor ). Animal fur over the tumor area was removed with a shaver and a depilatory (Nair). MLu was administered via tail vein at 2.5, 5, or in three animals per dose at before the DRS measurements. During DRS measurements, animals were maintained under anesthesia via inhalation of isoflurane through a nosecone. 2.3.Diffuse Reflectance SpectroscopyTwo continuous wave (cw), white light diffuse reflectance spectroscopy (DRS) systems were used to measure tissue optical and physiological properties in the spectral range of , as described previously.30 Briefly, one system was composed of a quartz tungsten halogen lamp, a hand-held surface contact fiber optic probe, a spectrograph (SP-150, Acton Research, Acton, Massachusetts), and a liquid nitrogen cooled charge-coupled device (CCD) camera (LN/CCD-1100-PF/UV, Roper Scientific, Trenton, New Jersey). The other DRS system was similar, except that the CCD was thermoelectrically cooled and integrated with the spectrograph into a single unit (INS-150-252F, Roper Scientific, Trenton, New Jersey). The fiber optic probe consisted of a single source and ten detection fibers (each with a core diameter of ) spaced nonuniformly. The source-detector separations were all less than ( , 1.2, 1.8, 2.4, 3, 4, 5, 6, 8, and ). Our analysis employed a multiwavelength algorithm to simultaneously fit all data in the optimal wavelength range and using optimal source-detector separations. The fits compared data to an analytical solution of the photon diffusion equation (P1 approximation) with semi-infinite boundary conditions.37, 38, 39, 40 The tissue optical properties, i.e., the reduced scattering and absorption coefficients, were assumed to have the form: and , respectively. Here is the light wavelength in nanometers, is chosen to be so that has the same units as (i.e., ), and and are the concentration and extinction coefficient of the ’th chromophore, respectively. The primary chromophores in our analysis were oxyhemoglobin , deoxyhemoglobin (Hb), MLu, and water. The extinction coefficients of , Hb, and water were obtained from the literature,41 and the extinction coefficient of MLu was obtained by direct spectroscopic measurement in our laboratory (using a grating spectrometer from Ocean Optics, Dunedin, Florida). A nonlinearly constrained optimization function, FMINCON implemented in MATLAB (The MathWorks, Incorporated, Natick, Massachusetts), was used to globally fit the data. The multiwavelength algorithm extracts tissue scattering parameters ( and ) and chromophore concentrations ( , , , and ). MLu concentration was reported in ng/mg. Tissue total hemoglobin concentration (THC) and blood oxygen saturation were calculated from these quantities (e.g., , ). Signals from the shortest source-detector separation distances were not used due to sporadic light leakage from the source fiber and to limitations of the photon diffusion model at small source-detector separation distances . Between one and four DRS measurements were taken from each IP patient; more measurements could not be taken due to time constraints in the operating room. The optimal source-detector separations and wavelength ranges for calculation of patient physiological properties (see Materials and Methods in Sec. 2) were determined after the operation. For each RIF tumor, 7 to 10 DRS measurements were taken over 7 to 10 tumor sites. Furthermore, due to the hemispheric tumor geometry (with minimal diameter ), the signals at the larger source-detector separations were noisy and prone to systematic error. To be consistent for all nine animals, only signals from the detection fibers located 1.2 and from the source fiber were used to determine the optical properties and chromophore concentrations in the wavelength range of . The data acquisition time was per measurement. Figures 1a and 1b depict representative reflectance spectra of an IP patient tumor [Fig. 1a] and a RIF tumor implanted on the mouse [Fig. 1b]. Note that corrections for the systematic spectral features of the source and detection system are accounted for in ; i.e., after dark-count background subtraction, the raw spectra were divided by the spectrum (i.e., the dark-count subtracted spectrum) taken during a calibration run using an integrating sphere.28, 30 Fig. 1Representative reflectance spectra of (a) an IP patient tumor and (b) a RIF tumor. The reflectance data are calibrated; it is obtained by dividing the dark-corrected reflectance spectra from tissue sample by the dark-corrected reflectance spectra from an integrated sphere. Normalized reflectance spectra taken from the RIF tumor reflectance spectra in (b) is plotted (——) for two separations (c). The fit is based on analogous normalization of calculated spectra (------). See text for more details.  Then a source-detector-separation normalized reflectance is calculated. divides spectra taken at separation by that taken at a single separation distance, typically the minimum separation ,30 i.e., For example, Fig. 1c shows (and a fit to ) for data derived from a RIF tumor; the top curve is and the second curve is . Similarly, Fig. 2 shows from IP patients (see later text). Note that in fitting the data, we compute a similar using calculated reflectance spectra . These calculated spectra employ analytical solutions of the diffusion equation with semi-infinite boundary conditions.37, 38, 39, 40Fig. 2The normalized reflectance spectra plotted (——) at the optimal separations for three tumor tissues: (a) patient 1 (Pt 1, tissue 1), (b) patient 2 (Pt 2, tissue 1), and (c) patient 2 (Pt 2, tissue 2). The fits based on using the wavelength range between 600 and (------), and using the wavelength range between and (-∙-∙-∙-) were plotted in the same figure to compare . The noisy signals at in patient 1 (Pt 1, tissue 1) significantly distorted the fitted results when we used for reconstruction. The fits were improved when we used for reconstruction (Pt 1, tissue 1 and Pt 2, tissue 2). The fitted results in patient 2 (tissue 1) were insensitive to the wavelength range used for reconstruction. 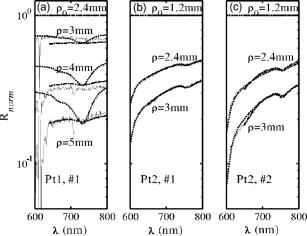 2.4.2-(2-Nitroimida-Zol-1[H]-yl)-N-(2,2,3,3,3-Pentafluoropropyl)Acetamide BindingMicroscopic images of EF5 binding were obtained for each tissue section using methods previously described.42 In brief, frozen tumor sections were fixed in 4% paraformaldehyde, blocked, and stained with EF5 monoclonal antibody (ELK3-51) conjugated to Cy3 dye (regular stain). Multiple regions of the specimen, separated by at least , were examined. In addition to the standard staining protocol, two tissue sections were stained without antibody to assess endogenous tissue fluorescence. A representative section from each patient was also stained with the standard anti-EF5 antibody mixed with an excess of authentic EF5 drug . This control is termed “competed stain.” The excess drug binds to all specific sites on the antibody and prevents specific binding to tissue adducts. Accordingly, sections that received competed stain are used as an indication of nonspecific antibody binding. The competed stain values were subtracted from the absolute fluorescence values for the regular stain to obtain a final evaluation of EF5 binding. Additionally, in vitro studies were performed to determine the maximum binding level of each tissue.14, 15 This value is referred to as “cube reference binding” (CRB). The endpoint value used for EF5 binding as a surrogate for hypoxia is percent reference binding, which is the ratio of the in situ binding to the CRB, multiplied by 100. The final reported value is corrected for drug exposure,43 camera exposure, and tissue thickness.17 This final value is percent maximum binding and is reported on a scale of 0 to 100. 1% of maximum binding represents physiologic conditions, which we define as oxygen; 3% of maximum binding represents modestly hypoxic conditions, which we define as approximately 2.5% oxygen; 10% of maximum binding represents moderately hypoxic conditions, which we define as 0.5% oxygen; 30% of maximum binding represents severe hypoxia, which we define as 0.1% oxygen; and 100% of maximum binding represents anoxia. Finally, a single EF5 value was reported for each tissue section by averaging the pixels of the EF5 binding microscope image over its entire field of view of approximately . This number was used for comparison to DRS-determined blood oxygenation. 2.5.Ex Vivo Motexafin Lutetium FluorescenceMLu was extracted from frozen samples of human or murine tissues using a procedure based on a previous report.44 Tissues were thawed to room temperature, weighed, and divided into samples of (macro) or (micro). Samples were homogenized (Polytron 1200) in (macro) or (micro) phosphate buffer ( , pH 7.5) and mixed with chloroform and methanol, each at a volume equivalent to the phosphate buffer. Samples were centrifuged ( , ), the organic layer was collected, and (macro) or (micro) was transferred to a cuvette. Fluorescence was measured by a spectrofluorometer (FluoroMax-3, Jobin Yvon, Incorporated, Edison, New Jersey) over an emission scan range from . The excitation wavelength was and the peak MLu emission was at of . MLu concentration in the tissue was calculated based on the increase in fluorescence resulting from the addition of a known amount of MLu to each sample after its initial reading. Data are presented as ng of MLu per mg of tissue. 2.6.Clinical Data Analysis: Selection Criteria for Fitting OptimizationIn this pilot study, we selected optimal source-detector separations based on the point at which fitting errors (see definition later) increased by a factor of 2. Thus we chose , 3, 4, and for patient 1 (tissue 1) and , 2.4, and for patient 2 (tissues 1 and 2). Our choice of wavelength range was slightly more complex. In our previous publications,28, 29, 30 we empirically determined that the wavelength range from was optimal for determination of tissue optical and physiological properties. However, in the current clinical study we experienced difficulty determining tissue oxygenation using this wavelength range. These difficulties are possibly due to poor signal-to-noise ratio, to limitations of the diffusion model in regions of high tissue absorption, to tissue surface homogeneity, or to uncontrolled variations in the operating room (OR). Figure 2 depicts the normalized reflectance in the spectral range between 600 and . Also shown are the fits based on using the wavelength range between 600 and (dashed line), and using the wavelength range between (explained next) and (dash dot line). From Fig. 2 we see that the chosen wavelength range affects the fitting results. In patient 1 (Pt 1, tissue 1), the noisy signals at significantly compromise the fitting (dash line). In patient 2, however, the fitted results using two different wavelength ranges ( versus ) showed no difference for bulk tissue 1 and only a small difference at for bulk tissue 2. To select the optimal wavelength range, we examined extracted tissue oxygenation ( in percent), MLu concentration ( in ng/mg), and fitting error ( in percent) using different fitting wavelength ranges from , where varied from (lb is lower bound and bound). In our previous studies,30 we have defined a fitting error as , where Figure 3 plots the extracted , , and versus for the DRS measurements [in Figs. 2a, 2b, 2c] of patients 1 (tissue 1) and 2 (tissues 1 and 2). Our general plan was to choose the wavelength range that minimizes and stabilizes the derived parameters. Notice that reached a minimum and then stabilized at in patient 1 (tissue 1) and patient 2 (tissue 2). did not change much, while in patient 1 was varied, but stabilized at in patient 2 (tissue 2). In patient 2 (tissue 1), and are insensitive to changes. This insensitivity is not surprising, because good fits were achieved across the entire wavelength range of for this tumor sample (Fig. 2). reached a maximum then stabilized in patient 2 (tissue 2), but was not as stable in patient 2 (tissue 1). In assigning for patient 2 (tissue 1), we somewhat arbitrarily used its value at , wherein patient 2 (tissue 2) stabilized.Fig. 3The reconstructed , , and fitting error are plotted versus corresponding to the DRS measurements [in Figs. 2a, 2b, 2c], in patients 1 (tissue 1) and 2 (tissues 1 and 2). The reconstruction was preformed using different fitting wavelength ranges from to , where varied from and . reached a minimum, then stabilized at in patient 1 (tissue 1) and patient 2 (tissue 1). did not vary much while was varied in patient 1, but stabilized at in patient 2 (tissue 2). In patient 2 (tissue 1), and are insensitive to the change of . 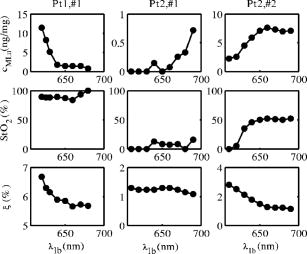 2.7.Finite Element MethodTo explore the role of tumor shape in affecting derived optical properties, we developed a finite element solver. The in-house finite element solver was written in MatLab to numerically solve the photon diffusion equation.45 An isotropic point source of light was assumed to be located a distance below the source at the air-tissue interface. Robin boundary conditions were used on all boundaries, accounting for the refractive index mismatch at diffuse/nondiffuse interfaces. We used software called GiD (see Ref. 46) to generate an unstructured tetrahedral mesh with varying element size. The element size, defined as the average length of six sides of tetrahedron, was set to be near source and detector positions, and was gradually increased to for the rest of the tumor volume. The analytical solution of the photon diffusion equation for cw reflectance from a semi-infinite turbid medium with the extrapolated boundary conditions (EBC) has been well described and has been shown to agree with the Monte Carlo simulations in previous studies.38 Here, we validate our FEM by comparing FEM generated reflectance from a turbid slab with analytical semi-infinite boundary condition solutions [Ref. 30, Eq. (3)] at multiple source-detector separations used in our clinical data analysis ( , 1.2, 1.8, 2.4, 3, 4, and ). The slab was big enough to simulate a semi-infinite geometry and contained a scattering medium with the following predetermined optical properties: , , , , (or ng/mg considering the molecular weight of MLu is approximately 1000), and 90% water. The mesh we used in the FEM contained 11,804 nodes and 60,770 elements. We compared the FEM-simulated and analytically calculated reflectance at four wavelengths—620, 650, 700, and —as an example. The corresponding optical properties, calculated based on and , were , 7.04, 6.62, and and , 0.288, 0.186, and at , 650, 700, and , respectively. The reflectance generated from FEM simulation closely matched the analytical solution with extrapolated boundary conditions for all the source-detector separation distances except the smallest , where FEM simulations generated a higher reflectance. The deviation between two models was at , but became larger ( to 28%) at . Numerical error was negligible because we used a fine mesh. Different boundary conditions used in the analytical solutions and the FEM model may also induce small errors. The reflectance signal generated by FEM at was consistently higher than that of the analytical solution at all of four wavelengths, leading us to assume the systematic error between FEM and analytical solution is constant and to introduce a correction factor to account for the inherent discrepancy between two models in the shape simulations discussed next. 2.8.Evaluation of Radiation-Induced Fibrosarcoma Tumor Boundary Effect Using Finite Element MethodA mesh as shown in Fig. 4 was generated for FEM simulation data from a hemispheric-like RIF tumor. The computational volume consisted of a rectangular-shaped base with a hemisphere of radius. The top of the hemisphere was truncated to account for the deformation due to the optical probe. The truncated circular plane had a diameter of to accommodate a single source and two detector fibers at separations of 1.2 and that were used in our MLu measurements of RIF tumors. Fig. 4The mesh, consisting of a hemisphere of radius and a rectangular base, was used to model the geometry of a radiation-induced fibrosarcoma (RIF) tumor for finite element method (FEM) simulations. The top of the hemisphere was truncated, leaving a radius of to accommodate a source and two detector fibers at separations of 1.2 and . Coordinate dimensions in the figure are in centimeters.  Because of the systematic error between FEM and analytical solution mentioned before, the correction factor , derived from the semi-infinite normalized reflectance ratio, was used for evaluation of the RIF tumor boundary shape effect. We first generated reflectance data using the hemispheric mesh and the FEM code. Then we calculated , from the data and corrected it by multiplying and . We fit to this “simulation data” using the analytical semi-infinite model, and thereby extracted , , and of the underlying medium. 3.Results3.1.Diffuse Reflectance Spectroscopy Measurement of Motexafin Lutetium Concentration in Radiation-Induced Fibrosarcoma Murine TumorsDiffuse reflectance spectroscopy (DRS) of photosensitizer concentration has been validated in tissue phantoms.30 To evaluate in vivo DRS measurements of photosensitizer concentration in the context of the present study, we performed DRS measurements of MLu concentration in nine radiation-induced fibrosarcoma (RIF) murine tumors. Immediately after DRS measurements, the RIF tumors were excised, frozen, and stored for subsequent ex vivo spectrofluorometric assay. Figure 5 shows the MLu concentration (ng/mg) measured in vivo by DRS versus ex vivo by spectro-fluorometric assay in the same tumors. Due to their small size, each tumor was run as a single sample by ex vivo spectro-fluorometric assay, thus no error bars are presented for these data. The error bars for the DRS data points represent the standard error (STE) of 7 to 10 measurements taken randomly over various sites on the tumor of each animal. Fig. 5RIF tumor MLu concentration ( in ng/mg) determined by in vivo DRS is plotted versus MLu concentration ( in ng/mg) measured by ex vivo spectrofluorometric assay . The correlation coefficient and the slope of the data were 0.87 and 1.10, respectively. The standard error in in vivo ranged from . There is no error bar plotted for ex vivo , because only one tissue sample was analyzed for each animal.  Excellent agreement was found between the DRS measurements and those obtained by the spectrofluorometric assay. The correlation coefficient and the slope of the in vivo versus ex vivo data were derived by linear regression and were 0.87 and 1.10, respectively. In all nine animals, MLu uptake by the RIF tumor was shown to be approximately half of the MLu dosage administered. The administered MLu doses were 2.5, 5, and . The of the ex vivo spectrofluorometric assays were , , and , respectively. 3.2.Ex Vivo Measured 2-(2-Nitroimida-Zol-1[H]-yl)-N-(2,2,3,3,3-Pentafluoropropyl)Acetamide Binding and Motexafin Lutetium ConcentrationTable 1 summarizes the results of the pixel-averaged EF5 binding and MLu concentration determined by ex vivo assays of three intraperitoneal carcinoma samples from two patients. In patient 1, DRS measurements were performed at a single tumor site with two continuous captures (dual-measurement) before tumor excision. In patient 2, DRS measurements were performed at two different sites (tissue samples 1 and 2). At each site, four randomly selected adjacent locations were measured by DRS. After DRS measurements, each tumor was excised and divided equally for analysis of EF5 binding and MLu concentration. The EF5 binding in six of the eight tissue sections corresponded to the physiologic range ( binding, corresponding to ), and the modest hypoxia range ( binding, corresponding to ), as previously defined.13, 47 Two out of the eight sections exhibited moderate EF5 binding, to 6%, which falls on the border of the modest and moderate hypoxia ranges ( binding, corresponding to ). In patient 2, two separate tissue sections obtained from either sample 1 or 2 had almost identical EF5 binding (i.e., 4.60% versus 4.66% in sample 1, 1.55 versus 1.45% in sample 2); both of these regions had mild hypoxia. Four sections of the same sample from patient 1 showed a small degree of variation, i.e., from 0.09 to 2.35% EF5 binding; all of these regions were oxic. Regarding the EF5 heterogeneity, our patient 2 microscope images of EF5 binding showed a few small cell clusters ( in diameter) that were very mildly hypoxic. The patient 1 samples were oxic, and no patterns could be described because of minimal binding. MLu concentration, measured by spectroscopic assays, ranged from an average of in bulk tissue 1 of patient in bulk tissue 2 of patient 2. Generally, uptake was extremely consistent among samples and patients. The lowest and highest values of drug uptake were found in two samples taken from patient 1 (i.e., versus ). 3.3.Diffuse Reflectance Spectroscopy Measurements in Intraperitoneal Carcinoma PatientsDRS data from patients 1 and 2 were analyzed to determine oxygenation and MLu concentration using our selection criteria described in Materials and Methods in Sec. 2. The results are presented in Table 1. In patient 1, two continuous DRS measurements were performed at the same site (i.e., the probe was placed once on the tissue surface and DRS data ware taken at two different time points). The so-determined oxygenation and MLu concentration were similar (i.e., versus 88.88%, versus ). In patient 2, we performed four DRS measurement at four random locations within the “bulk” tissue sample (i.e., four tissue contacts of the fiber optic probe). One measurement was made at each location. Substantial variation in tissue oxygenation was observed in this case. ranged from 0 to 54.76% in sample 1 and from 39.83 to 73.40% in sample 2. MLu concentration among locations ranged from in sample 1 and from in sample 2. 3.4.Correlation of Diffuse Reflectance Spectroscopy and Ex Vivo MeasurementsTable 1 lists the mean and standard error (STE) of in vivo DRS and ex vivo tissue oxygenation (or EF5 binding) and MLu concentration measurements for each tumor tissue. The association between in vivo and ex vivo measurements from patients 1 and 2 is shown in Figs. 6 and 7 . Figure 6 shows tissue oxygenation ( in percent) measured by DRS versus EF5 binding. Figure 7 shows MLu concentration ( in ng/mg) measured by DRS versus MLu concentration measured by the ex vivo spectrofluorometric assay. The error bars on these plots represent the standard error (STE) of the mean. In patients 1 and 2, the number of measurements was 4 and 2, respectively, for EF5 studies, and 2 and 4, respectively, for measurements. In patients 1 and 2, and 3, respectively, for the ex vivo assay and 2 and 4, respectively, for the in vivo assay. Fig. 6(in percent) determined by diffuse reflectance spectroscopy (DRS) is plotted versus hypoxia marker EF5 binding (percent of maximum value). In patients 1 (data point with ) and 2 (data point with and 53.75%), the number of measurements was 4 and 2, respectively, for EF5 studies, and 2 and 4, respectively, for measurements. The error bars represent the standard error (STE) of the mean. The dashed line shows an empirically fit through three data points (◇) that have been pre-established to represent the association of oxygen partial pressure and EF5 binding in an in vitro calibration study: , 19, and correspond to , 3, and 10% of EF5 cube reference binding. Oxygen partial pressure values were converted to and plotted in the figure based on a published study,39 where , , . The correlation of and EF5 binding agrees well with the established association curve of and EF5 binding.  Fig. 7MLu concentration ( in ng/mg) determined by in vivo DRS is plotted versus MLu concentration ( in ng/mg) measured by ex vivo spectrofluorometric assay. In patients 1 (data point with in vivo ) and 2 (data point with in vivo and ), the number of measurements was 6 and 3, respectively, for the ex vivo assay and 2 and 4, respectively, for the in vivo assay. The error bars represent the standard error of the mean. A positive trend was seen between in vivo and ex vivo methods in measuring MLu concentration. 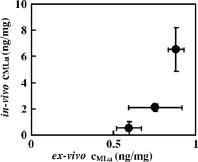 Table 1Oxygenation (hypoxia) and photosensitizer values in human tumors, measured by in vivo versus ex vivo assays. Tissues were assigned an ID in the operating room at the time that DRS was performed. Oxygen saturation (%StO2) and MLu concentration (cMLung∕mg) were extracted from DRS measurement using a diffusion model (see Methods and Materials in Sec. 2). In patient 1(tissue 1), two continuous measurements were taken on the same site (single contact of the probe and tumor surface). In patient 2 (bulk tissues 1 and 2), four different measurements were taken on four adjacent sites (four fresh contacts of the probe and tumor surface).
As expected, and EF5 binding were negatively correlated (Fig. 6). The dashed line (and diamonds) in Fig. 6 is derived from an independent in vitro determination of the association between tissue oxygen and EF5 binding level.47 In this study,47 the relationship between and percent EF5 cube reference binding was established: 10% oxygen of cube reference binding; 2.5% oxygen of cube reference binding; and 0.5% oxygen of cube reference binding. To obtain the dashed line in Fig. 6, we converted to based on published results,39 wherein , , , and empirically fit the data (diamonds). In Fig. 7, a positive correlation between DRS-measured and spectrofluorometer-measured was observed, although the DRS-measured concentrations were significantly higher than the concentrations found by the ex vivo assay; thus, the patient data are quite different from that of the murine tumors. Among the ex vivo measurements, the significant higher standard error of in patient 1 is due in part to large intratumor heterogeneity. The mean of these two excised samples from the same tumor were and , respectively. 4.DiscussionClinical PDT dosimetry is made complex by many dynamic and interdependent treatment factors. Explicit dosimetry strategies attempt to monitor one or more of these factors, including oxygen availability, photosensitizer concentration, and light distribution.48 Near-infrared photon-migration spectroscopy and imaging have emerged as important noninvasive techniques to monitor tissue blood oxygenation, blood flow, photosensitizer concentration, and light penetration depth during clinical PDT.30, 31, 35 However, clinical validations of this technique are scarce: measurement of Photofrin and MLu concentration, respectively, has been validated in tissue phantoms29 and normal dog skin.49 Validation of the oxyhemoglobin dissociation curve in human and mouse blood has been carried out with oxygen-sensitive electrodes.29, 30, 39, 50 Validation of carbogen-induced changes of the and in murine tumors measured by DRS and the Eppendorf histograph, respectively, have been carried out,30 and averaged measured by DRS agreed well with cryospectrophotometric measurements in five of nine rodent mammary tumors.51 This pilot study extends the range of in vivo validation of DRS to include comparison with levels of EF5 binding in excised tissues and comparison with ex vivo spectrofluorometric assays of MLu concentration; furthermore, these comparisons use human tumor tissues from clinical PDT patients. Hypoxia is one of the characteristics of malignant tumors that has been associated with disease progression and treatment resistance.52, 53 The two clinically relevant immunohistochemistry-based 2-nitroimizole assays for hypoxia in human tumors are EF5 and pimonidazole;14, 15 These markers have been used extensively to label hypoxia in nononcologic diseases where hypoxia is important,14, 15 as well as in tumors. In this study, we demonstrate a negative correlation between DRS-measured tissue blood oxygenation and tissue hypoxia based on EF5 binding in the same tumor samples. The association we detected between and EF5 binding agrees very well with in vitro calibration studies.39, 47 In the measurement of MLu concentration, excellent agreement between DRS and the ex vivo assay was found in RIF tumors. On the other hand, although DRS-measured MLu concentration in our intraperitoneal carcinoma patients was positively correlated with the ex vivo assay, the DRS-measured MLu concentration was also systemically higher than the results of the ex vivo assay. It is important to consider possible causes of this discrepancy. To this end we performed 44 random DRS measurements over the same frozen tissue samples from patient 2 (tissues 1 and 2) that were used in the ex vivo analysis. These frozen samples were large enough for DRS measurements and for use of the diffusion model. The DRS measurements gave : and for tissues 1 and 2, respectively. These numbers are much smaller than our in vivo DRS measurement results and are very close to the results of the ex vivo spectrofluorometric assays. Similarly, in previous PDT studies of peritoneal tissues of normal dogs,49 DRS measured significantly lower MLu concentration in frozen tissues compared to in vivo tissues. We argued then that when the drug-light interval is short , there is likely to be a high concentration of MLu in the blood vessels at the time of in vivo assay. As such, our findings of lower drug levels in the ex vivo environment may be explained by DRS measurements that reveal lower total hemoglobin concentration in excised tissues ( for tissue 1, for tissue 2), compared to in vivo tissues ( for tissue 1, for tissue 2). To corroborate this hypothesis, we plotted the relationship between DRS-measured ex vivo MLu concentration and THC for tissue . The results clearly indicated that MLu concentration was linearly proportional to THC . Additionally, in our previously published paper,49 quantitative agreement was found between in vivo DRS and ex vivo spectrofluorometric assay for some tissue types (skin), but not for other tissue types (rectum). The work documents that environment is affecting MLu concentration and suggests that differences in MLu concentration in vivo and ex vivo are real. Skin demonstrated a 1:1 correlation between in vivo DRS and ex vivo spectrofluorometric assay. Measurements of the skin will necessarily include unvascularized tissue (i.e., the epidermis). The RIF tumor is grown intradermally. Thus the fact that in vivo and ex vivo data are identical in skin and skin tumors adds support to the conclusion that differences in hemoglobin concentration between in vivo and ex vivo tissue samples are a primary contributor to differences in the measured MLu concentration. Finally, we evaluated the effect of RIF tumor geometric shape on the extracted optical properties. The RIF tumors have a hemispherical boundary. We have investigated this factor by generating simulated reflectance data at multiple wavelengths and two separations ( and ) using the finite element method (FEM), described in Materials and Methods in Sec. 2, in both semi-infinite and hemisphere geometries. The results revealed differences in the reflectance spectra (data not shown). However, the extracted MLu concentration increased from the true value of (i.e., a 13% increase). The extracted scattering coefficient varied a little more from its true value, i.e., at most 20%. Similarly, and experienced moderate shifts, 16% lower and 12% higher, respectively, and shifted to a higher value by only 2.1%. Thus, the boundary effect of the hemisphere geometry likely contributed to an increase in calculated MLu concentration by . In the future, we can include this relatively small effect in our calculations. AcknowledgmentsWe acknowledge technical assistance by Amy E. Schrlall and Elizabeth Rickter and useful discussions with R. Choe. This work is supported by NIH P01 grant CA87971. ReferencesS. K. Hendren,
S. M. Hahn,
F. R. Spitz,
T. W. Bauer,
S. C. Rubin,
T. Zhu,
E. Glatstein, and
D. L. Fraker,
“Phase II trial of debulking surgery and photodynamic therapy for disseminated intraperitoneal tumors,”
Ann. Surg. Oncol., 8 65
–71
(2001). 1068-9265 Google Scholar
T. F. DeLaney,
W. F. Sindelar,
Z. Tochner,
P. D. Smith,
W. S. Friauf,
G. Thomas,
L. Dachowski,
J. W. Cole,
S. M. Steinberg, and
E. Glatstein,
“Phase-I study of debulking surgery and photodynamic therapy for disseminated intraperitoneal tumors,”
Int. J. Radiat. Oncol., Biol., Phys., 25 445
–457
(1993). 0360-3016 Google Scholar
S. M. Hahn,
D. L. Fraker,
R. Mick,
J. Metz,
T. M. Busch,
D. Smith,
T. Zhu,
C. Rodriguez,
A. Dimofte,
F. Spitz,
M. Putt,
S. C. Rubin,
C. Menon,
H. W. Wang,
D. Shin,
A. Yodh, and
E. Glatstein,
“A phase II trial of intraperitoneal photodynamic therapy for patients with peritoneal carcinomatosis and sarcomatosis,”
Clin. Cancer Res., 12 2517
–2525
(2006). 1078-0432 Google Scholar
M. Hockel,
C. Knoop,
K. Schlenger,
B. Vorndran,
E. Baussmann,
M. Mitze,
P. G. Knapstein, and
P. Vaupel,
“Intratumoral pO2 predicts survival in advanced cancer of the uterine cervix,”
Radiother. Oncol., 26 45
–50
(1993). https://doi.org/10.1016/0167-8140(93)90025-4 0167-8140 Google Scholar
M. Hockel,
K. Schlenger,
B. Aral,
M. Mitze,
U. Schaffer, and
P. Vaupel,
“Association between tumor hypoxia and malignant progression in advanced cancer of the uterine cervix,”
Cancer Res., 56 4509
–4515
(1996). 0008-5472 Google Scholar
M. Nordsmark,
M. Hoyer,
J. Keller,
O. S. Nielsen,
O. M. Jensen, and
J. Overgaard,
“The relationship between tumor oxygenation and cell proliferation in human soft tissue sarcomas,”
Int. J. Radiat. Oncol., Biol., Phys., 35 701
–708
(1996). https://doi.org/10.1016/0360-3016(96)00132-0 0360-3016 Google Scholar
D. M. Brizel,
S. P. Scully,
J. M. Harrelson,
L. J. Layfield,
J. M. Bean,
L. R. Prosnitz, and
M. W. Dewhirst,
“Tumor oxygenation predicts for the likelihood of distant metastases in human soft tissue sarcoma,”
Cancer Res., 56 941
–943
(1996). 0008-5472 Google Scholar
K. R. Diamond,
P. P. Malysz,
J. E. Hayward, and
M. S. Patterson,
“Quantification of fluorophore concentration in vivo using two simple fluorescence-based measurement techniques,”
J. Biomed. Opt., 10
(2), 024007
(2005). https://doi.org/10.1117/1.1887932 1083-3668 Google Scholar
C. C. Lee,
B. W. Pogue,
J. A. O’Hara,
C. M. Wilmot,
R. R. Strawbridge,
G. C. Burke, and
P. J. Hoopers,
“Spatial heterogeneity and temporal kinetics of photosensitizer (AlPcS2) concentration in murine tumors RIF-1 and MTG-B,”
Photochem. Photobiol. Sci., 2 145
–150
(2003). https://doi.org/10.1039/b207598a 1474-905X Google Scholar
C. Sheng,
B. W. Pogue,
E. Wang,
J. E. Hutchins, and
P. J. Hoopes,
“Assessment of photosensitizer dosimetry and tissue damage assay for photodynamic therapy in advanced-stage tumors,”
Photochem. Photobiol., 79 520
–525
(2004). https://doi.org/10.1562/MU-03-33.1 0031-8655 Google Scholar
J. C. Finlay,
D. L. Conover,
E. L. Hull, and
T. H. Foster,
“Porphyrin bleaching and PDT-induced spectral changes are irradiance dependent in ALA-sensitized normal rat skin in vivo,”
Photochem. Photobiol., 73 54
–63
(2001). https://doi.org/10.1562/0031-8655(2001)073<0054:PBAPIS>2.0.CO;2 0031-8655 Google Scholar
J. C. Finlay,
T. Zhu,
A. Dimofte,
D. Stripp,
S. Malkowicz,
T. M. Busch, and
S. M. Hahn,
“Interstitial fluorescence spectroscopy in the human prostate during motexafin lutetium-mediated photodynamic therapy,”
Photochem. Photobiol., 82 1270
–1276
(2006). https://doi.org/10.1562/2005-10-04-RA-711 0031-8655 Google Scholar
T. M. Busch,
S. M. Hahn,
E. P. Wileyto,
C. J. Koch,
D. L. Fraker,
P. Zhang,
M. E. Putt,
K. Gleason,
D. B. Shin,
M. J. Emanuele,
K. Jenkins,
E. Glatstein, and
S. M. Evans,
“Hypoxia and photofrin uptake in the intraperitoneal carcinomatosis and sarcomatosis of photodynamic therapy patients,”
Clin. Cancer Res., 10 4630
–4638
(2004). 1078-0432 Google Scholar
S. M. Evans,
K. D. Judy,
I. Dunphy,
W. T. Jenkins,
W. T. Hwang,
P. T. Nelson,
R. A. Lustig,
K. Jenkins,
D. P. Magarelli,
S. M. Hahn,
R. A. Collins,
M. S. Grady, and
C. J. Koch,
“Hypoxia is important in the biology and aggression of human glial brain tumors,”
Clin. Cancer Res., 10 8177
–8184
(2004). 1078-0432 Google Scholar
S. M. Evans,
K. D. Judy,
I. Dunphy,
W. T. Jenkins,
P. T. Nelson,
R. Collins,
E. P. Wileyto,
K. Jenkins,
S. M. Hahn,
C. W. Stevens,
A. R. Judkins,
P. Phillips,
B. Geoerger, and
C. J. Koch,
“Comparative measurements of hypoxia in human brain tumors using needle electrodes and EF5 binding,”
Cancer Res., 64 1886
–1892
(2004). 0008-5472 Google Scholar
S. M. Evans,
S. M. Hahn,
D. P. Magarelli,
“Hypoxia in human intraperitoneal and extremity sarcomas,”
Int. J. Radiat. Oncol., Biol., Phys., 49 587
–596
(2001). 0360-3016 Google Scholar
S. M. Evans,
S. M. Hahn,
D. R. Pook,
“Detection of hypoxia in human squamous cell carcinoma by EF5 binding,”
Cancer Res., 60 2018
–2024
(2000). 0008-5472 Google Scholar
L. S. Ziemer,
C. J. Koch,
A. Maity,
D. P. Magarelli,
A. M. Horan, and
S. M. Evans,
“Hypoxia and VEGF mRNA expression in human tumors,”
Neoplasia, 3 500
–508
(2001). 1522-8002 Google Scholar
S. M. Evans,
W. T. Jekins,
B. Joiner,
E. M. Lord, and
C. J. Koch,
“2-nitroimi-dazole (EF5) binding predicts radiation resistance in individual 9L s.c. tumors,”
Cancer Res., 56 405
–411
(1996). 0008-5472 Google Scholar
S. M. Evans and
C. J. Koch,
“Prognostic significance of tumor oxygenation in humans,”
Cancer Lett., 195 1
–16
(2003). 0304-3835 Google Scholar
D. Kessel,
“In vivo fluorescence of tumors after treatment with derivatives of hematoporphyrin,”
Photochem. Photobiol., 44 107
–108
(1986). 0031-8655 Google Scholar
Q. Peng,
J. Moan,
L. W. Ma, and
J. M. Nesland,
“Uptake, localization, and photodynamic effect of meso-tetra(hydroxyphenyl)porphine and its corresponding chlorin in normal and tumor tissues of mice bearing mammary carcinoma,”
Cancer Res., 55 2620
–2626
(1995). 0008-5472 Google Scholar
B. W. Pogue and
G. Burke,
“Fiber-optic bundle design for quantitative fluorescence measurement from tissue,”
Appl. Opt., 37 7429
(1998). 0003-6935 Google Scholar
J. C. Finlay,
S. Mitra, and
T. H. Foster,
“In vivo mTHPC photobleaching in normal rat skin exhibits unique irradiance-dependent features,”
Photochem. Photobiol., 75 282
–288
(2002). 0031-8655 Google Scholar
R. Cheung,
M. Solonenko,
T. M. Busch,
F. Del Piero,
M. E. Putt,
S. M. Hahn, and
A. G. Yodh,
“Correlation of in vivo photosensitizer fluorescence and photodynamic-therapy-induced depth of necrosis in a murine tumor model,”
J. Biomed. Opt., 8
(2), 248
–252
(2003). https://doi.org/10.1117/1.1560011 1083-3668 Google Scholar
A. G. Yodh and
D. A. Boas,
“Biomedical photonics handbook,”
Functional Imaging with Diffusing Light, 21-21
–21-45 CRC Press, Boca Raton
(2003). Google Scholar
T. H. Pham,
R. Hornung,
M. W. Berns,
Y. Tadir, and
B. J. Tromberg,
“Monitoring tumor response during photodynamic therapy using near-infrared photon-migration spectroscopy,”
Photochem. Photobiol., 73 669
–677
(2001). https://doi.org/10.1562/0031-8655(2001)073<0669:MTRDPT>2.0.CO;2 0031-8655 Google Scholar
M. Solonenko,
R. Cheung,
T. M. Busch,
A. Kachur,
G. M. Griffin,
T. Vulcan,
T. C. Zhu,
H. W. Wang,
S. M. Hahn, and
A. G. Yodh,
“In vivo reflectance measurement of optical properties, blood oxygenation and motexafin lutetium uptake in canine large bowels, kidneys, and prostates,”
Phys. Med. Biol., 47 857
–873
(2002). 0031-9155 Google Scholar
H. W. Wang,
M. E. Putt,
M. J. Emanuele,
D. B. Shin,
E. Glatstein,
A. G. Yodh, and
T. M. Busch,
“Treatment-induced changes in tumor oxygenation predict photodynamic therapy outcome,”
Cancer Res., 64 7553
–7561
(2004). https://doi.org/10.1158/0008-5472.CAN-03-3632 0008-5472 Google Scholar
H. W. Wang,
T. C. Zhu,
M. E. Putt,
A. Dimofte,
J. Mile,
J. M. Metz,
E. Glatstein,
S. M. Hahn, and
A. G. Yodh,
“Broadband reflectance measurements of light penetration, blood oxygenation, hemoglobin concentration, and drug concentration in human intraperitoneal tissues before and after photodynamic therapy,”
J. Biomed. Opt., 10
(1), 014004
(2005). https://doi.org/10.1117/1.1854679 1083-3668 Google Scholar
T. C. Zhu,
J. C. Finlay, and
S. M. Hahn,
“Determination of the distribution of light, optical properties, drug concentration, and tissue oxygenation in vivo in human prostate during motexafin lutetium-mediated photodynamic therapy,”
J. Photochem. Photobiol., B, 79 231
–241
(2005). https://doi.org/10.1016/j.jphotobiol.2004.09.013 1011-1344 Google Scholar
G. Q. Yu,
T. Durduran,
C. Zhou,
H. W. Wang,
M. E. Putt,
H. M. Saunders,
C. M. Sehgal,
E. Glatstein,
A. G. Yodh, and
T. M. Busch,
“Noninvasive monitoring of murine tumor blood flow during and after photodynamic therapy provides early assessment of therapeutic efficacy,”
Clin. Cancer Res., 11 3543
–3552
(2005). 1078-0432 Google Scholar
S. W. Young,
K. W. Woodburn,
M. Wright,
T. D. Mody,
Q. Fan,
J. L. Sessler,
W. C. Dow, and
R. A. Miller,
“Lutetium texaphyrin (PCI-0123): a near-infrared, water-soluble photosensitizer,”
Photochem. Photobiol., 63 892
–897
(1996). 0031-8655 Google Scholar
T. D. Mody,
L. Fu, and
J. L. Sessler,
“Progress in Inorg. Chem.,”
Texaphyrins: Synthesis and Development of a Novel Class of Therapeutic Agents, 551
–598 John Wiley and Sons Ltd., Chichester
(2001). Google Scholar
G. Yu,
T. Durduran,
C. Zhou,
T. C. Zhu,
J. C. Finlay,
T. M. Busch,
B. Malkowicz,
S. M. Hahn, and
A. G. Yodh,
“Real-time in situ monitoring of human prostate photodynamic therapy with diffuse light,”
Photochem. Photobiol., 82 1279
–1284
(2006). https://doi.org/10.1562/2005-10-19-RA-721 0031-8655 Google Scholar
T. M. Busch,
E. P. Wileyto,
M. J. Emanuele,
F. Del Piero,
L. Marconato,
E. Glatstein, and
C. J. Koch,
“Photodynamic therapy creates fluence rate-dependent gradients in the intratumoral spatial distribution of oxygen,”
Cancer Res., 62 7273
–7279
(2002). 0008-5472 Google Scholar
R. C. Haskell,
L. O. Svaasand,
T. T. Tsay,
T. C Feng,
M. S. McAdams, and
B. J. Tromberg,
“Boundary conditions for the diffusion equation in radiative transfer,”
J. Opt. Soc. Am. A, 11 2727
–2741
(1994). 0740-3232 Google Scholar
A. Kienle and
M. S. Patterson,
“Improved solutions of the steady-state and the time-resolved diffusion equations for reflectance from a semi-infinite turbid medium,”
J. Opt. Soc. Am. A, 14 246
–254
(1997). 0740-3232 Google Scholar
E. L. Hull,
M. G. Nichols, and
T. H. Foster,
“Quantitative broadband near-infrared spectroscopy of tissue-simulating phantoms containing erythrocytes,”
Phys. Med. Biol., 43 3381
–3404
(1998). https://doi.org/10.1088/0031-9155/43/11/014 0031-9155 Google Scholar
E. L. Hull,
M. G. Nichols, and
T. H. Foster,
“Localization of luminescent inhomogeneities in turbid media with spatially resolved measurements of CW diffuse luminescence emittance,”
Appl. Opt., 37 2755
–2765
(1998). 0003-6935 Google Scholar
K. M. Laughlin,
S. M. Evans,
W. T. Jenkins,
“Biodistribution of the nitroimidazole EF5 (2-[2-nitro-1H-imidazol-1-yl]-N-(2,2,3,3,3-pen-tafluoropropyl)acetamide) in mice bearing subcutaneous EMT6 tumors,”
J. Pharmacol. Exp. Ther., 277 1049
–1057
(1996). 0022-3565 Google Scholar
C. J. Koch,
S. M. Hahn,
K. J. Rockwell,
“Pharmacokinetics of the 2-nitroimidazole EF5 [2-(2-nitro-1-H-imidazol-1-yl)-N-(2,2,3,3,3-pen-tafluoropropyl)acetamide] in human patients for hypoxia measurements in vivo,”
Cancer Chemother. Pharmacol., 48 177
–187
(2001). 0344-5704 Google Scholar
K. W. Woodburn,
Q. Fan,
D. Kessel,
Y. Luo, and
S. W. Young,
“Photodynamic therapy of B16F10 murine melanoma with lutetium texaphyrin,”
J. Invest. Dermatol., 110 746
–751
(1998). 0022-202X Google Scholar
J. Alberty,
C. Carstensen, and
S. A. Funken,
“Remarks around 50 lines of Matlab: short finite element implementation,”
Numer. Algorithms, 20 117
–137
(1999). https://doi.org/10.1023/A:1019155918070 1017-1398 Google Scholar
C. J. Koch,
“Methods in enzymology: antioxidants and redox cycling,”
Measurement of Absolute Oxygen Levels in Cells and Tissues Using Oxygen Sensors and the 2-Nitroimidazole EF5, 352 3
–31 Academic Press, San Diego, CA
(2002). Google Scholar
B. C. Wilson,
M. S. Patterson, and
L. Lilge,
“Implicit and explicit dosimetry in photodynamic therapy: a new paradigm,”
Lasers Med. Sci., 12 182
–199
(1997). 0268-8921 Google Scholar
H. M. Ross,
J. A. Smelstoys,
G. J. Davis,
A. S. Kapatkin,
F. Del Piero,
E. Reineke,
H. W. Wang,
T. C. Zhu,
T. M. Busch,
A. G. Yodh, and
S. M. Hahn,
“Photodynamic therapy with Motexafin lutetium for rectal cancer: a preclinical model in the dog,”
J. Surg. Res., 135 323
–330
(2006). 0022-4804 Google Scholar
J. C. Finlay and
T. H. Foster,
“Hemoglobin oxygen saturations in phantoms and in vivo from measurements of steady-state diffuse reflectance at a single, short source-detector separation,”
Med. Phys., 31 1949
–1959
(2004). https://doi.org/10.1118/1.1760188 0094-2405 Google Scholar
D. L. Conover,
B. M. Fenton,
T. H. Foster, and
E. L. Hull,
“An evaluation of near infrared spectroscopy and cryospectrophotometry estimates of haemoglobin oxygen saturation in a rodent mammary tumour model,”
Phys. Med. Biol., 45 2685
–2700
(2000). https://doi.org/10.1088/0031-9155/45/9/318 0031-9155 Google Scholar
G. L. Semenza,
“Hypoxia, clonal selection, and the role of HIF-1 in tumor progression,”
Crit. Rev. Biochem. Mol. Biol., 35 71
–103
(2000). 1040-9238 Google Scholar
M. Hockel and
P. Vaupel,
“Tumor hypoxia: definitions and current clinical, biologic, and molecular aspects,”
J. Natl. Cancer Inst., 93 266
–276
(2001). https://doi.org/10.1093/jnci/93.4.266 0027-8874 Google Scholar
|


