|
|
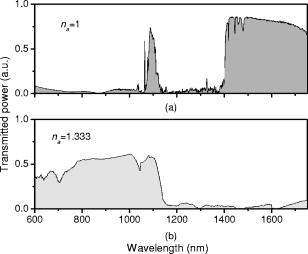
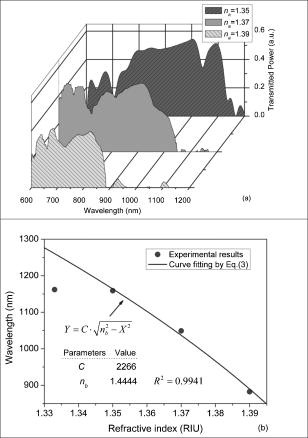
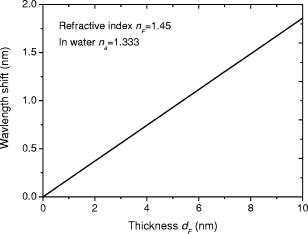
1.IntroductionOptical biosensors are capable of recognizing a specific type of target molecule. They also can provide high-sensitivity measurement for real-time bioprocess monitoring. Over the past few decades, optical biosensors have become well recognized as tools that play an enabling role in medical diagnostics, environmental protection, and, more recently, early detection of potential bioterrorism attacks.1 In general, optical biosensing techniques can be divided into two categories: labeling with compounds (fluorescent, radioactive, or colorimetric) and label-free (direct molecule identification) biosensors.1 For the labeling method, the target molecules can be readily visualized with radioactive or fluorescent labels and the change of the corresponding spectra measured. However, the attachment of labels to biomolecules may substantially increase the complexity of such a biosensor. On the other hand, label-free detection allows monitoring of the interactions of various biomolecule complexes without using fluorescent labels or radioactive labels. It thus improves the flexibility and allows measurement of both static and dynamic binding interactions among biomolecules. Several types of label-free fiber optic biosensors have been investigated over the past few years, some of which have also been commercialized. For example, surface plasmon resonance (SPR) sensors allow the detection of selective binding by measuring the change of the refractive index near the surface of a gold film.2, 3 However, this method required the use of a special metal layer (gold or silver) on which the bioactive agent cannot be easily and firmly bound. Long period grating- (LPG) based biosensors have been demonstrated by immobilizing antibodies on the surface of the fiber and monitoring the change in refractive index during the antigen–antibody reaction.4, 5 More recently, two-dimensional photonic crystals (PCs) were of particular interest for biochemical sensing applications, which were based on the measurement of the shift of the resonance wavelength under the influence of the variation of refractive index.6 Since most of the label-free approaches rely on refractive index measurement, a highly sensitive fiber optic biosensor is one kind of sensor that is very sensitive to the change in the refractive index. Photonic bandgap fibers (PBGFs) are characterized by having a hollow core surrounded by a pattern of micrometer-sized air holes along the entire length of the fiber.7 The transmission spectrum of a PBGF is characterized by having several transmission windows, which are defined as band gaps. The proposed sensing mechanism is based on the detection of the wavelength shift of the photonic band edge (PBE) due to the change of the refractive index inside the holey region of the PBGF. Since a bioactive layer can be immobilized on the inner surface of the holey region of the PBGF, the design of a PBGF-based biosensor reactive to a specific biochemical agent is a logical extension. The theoretical model and simulations are described in Section 2. Experimental results are given in Section 3. Discussion of the proposed scheme is presented in Section 4, and a conclusion is given in Section 5. 2.Theoretical Model and SimulationsFigure 1 shows the cross section of a typical PBGF. It consists of a hollow core with diameter that is surrounded by five rings of circular air holes in a triangular lattice. The diameter and the distance between the adjacent holes (pitch) are and , respectively. Another parameter to characterize the cladding structure is the air-filling fraction , which is defined as the fraction of air volume inside the unit cell of the cladding.7 The ambient refractive index inside the holey region, which includes the core and cladding holes, is denoted as . The refractive index of the background material, silica, is denoted as . Two parameters of interest for the PBGF are the positions and bandwidths of the band gaps. These two parameters are functions of the geometry of the fiber and the index contrast between silica and the filled holey region. Filling the holes of such a fiber with liquids or biomolecular solutions will change the refractive index of the holey region and therefore will result in the shift of band gaps and their corresponding bandwidths. The wavelength shifts of the band gaps can be evaluated by the refractive index scaling law, which is based on a scalar waveguide approximation.8, 9 For the same geometry profile, when the refractive index of the filling material changes from to , the corresponding shifts for the PBEs varies from to , which is given by Besides the refractive index scaling law, the photonic bandgap also satisfies the geometry scaling law. For the same refractive index profile, when the pitch of the fiber changes, the normalized wavelength of the band gap, i.e., , remains constant.7 Both scaling laws are able to be written together, which gives Alternatively, Eq. 2 can be rewritten aswhere is a constant determined by the fiber structure. This simple formula provides a simple tool for use in the design and analysis of PBGF-based biosensors.The wavelength shifts of the PBEs caused by modification of the refractive index profile inside the holey region are shown in Fig. 2 , which were evaluated by a full-vector plane wave expansion (PWE) method.10 The refractive index of silica was assumed to be 1.45, and the air-filling fraction was 0.7. When the refractive index contrast is small, as shown in Fig. 2a, the simulation results show good agreement with the fitted curve by using Eq. 3 with a correlation coefficient of . However, this curve shows a large discrepancy in the large refractive index contrast area, as shown in Fig. 2b. The reason is that vectorial effects go into operation when the refractive index contrast is large.8 However, this does not prevent the use of Eq. 3 in the design and analysis of the biosensor, since the biosensor operates in the refractive index ranging from 1.33 to 1.45. 3.Experimental ResultsExperiments were conducted using PBGFs as nonspecific biochemical sensors. The bare PBGFs without chemical treatment were used as the transducer. In this regard, the PBGF biochemical sensor could be used to measure the concentration of a known chemical solution or to distinguish a target chemical from a few known chemicals. The schematic diagram of the experimental setup is shown in Fig. 3 . The PBGF (Crystal-Fiber HC-1550-02) used in the experiment has a cladding pitch of , a core diameter of , and a center operating wavelength of . Two ends of the PBGF were mounted in modified V-groove mounts in order to keep the fiber submerged during the measurements. Light from a supercontinuum (SC) source (Koheras SuperK Red) was guided using a single-mode fiber SMF-28, which in turn launched into the core of the PBGF via butt coupling. The transmitted light after the PBGF was guided by using another section of SMF-28 via butt coupling again and then measured with an optical spectrum analyzer (OSA) (Ando AQ6317B). As a light source, the SC source provided an ultrabroad flat spectrum from to which had the same wavelength range as the OSA. The holey region of the PBGF was filled with the biochemical solution by capillary force. Based on calculations using the Navier–Stokes equations for the rate of liquid flow into a circular hole, the time required to fill a 20-cm PBGF with aqueous solution was around ,11 which was confirmed experimentally. It was also possible to apply pressure or temperature in order to reduce the filling time to less than .11 All the experiments were carried out in a controlled environment, where the effect of temperature variation can be ignored. Fig. 3Schematic diagram of the experimental setup (SC light source: supercontinuum light source; OSA: optical spectrum analyzer; PBGF: photonic bandgap fiber). 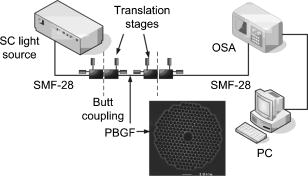 Figures 4a and 4b show the transmission spectra for two PBGFs, of and , taken before the filling process. In both cases, two photonic band gaps are observed: the primary band gap has a center operating wavelength of , and the secondary photonic band gap has a center wavelength of . The variation of the length of the fiber does not shift the position of the band gap since the band gap is only determined by the microstructure in the transverse direction. However, the loss outside the band gaps shows a strong dependence on the length of the PBGF. Increasing the length of the fiber can increase the loss outside the band gaps, while the transmission inside the band gaps is almost not altered. Intuitively, a longer PBGF is suitable for achieving high transmission contrast and thus is not vulnerable to the loss, whereas a shorter PBGF is preferred to design a compact sensor probe for a lab-on-chip system. In the following demonstrated experiments, all the fiber samples were kept as long. The normalized transmission spectra taken before and after the filling of water are plotted together and shown in Figs. 5a and 5b , respectively. The transmission spectrum before the filling process spanned from to . After the filling process, the transmission spectrum ranged from to . This range was broader than the prediction of the scaling law, which had a range from to . As discussed in Section 2, this is because the scaling law is based on the scalar waveguide approximation, which is accurate for a small index contrast. Another observation is that there are several loss dips in the transmission window after the filling process. The loss phenomenon is believed to result from the absorption and attenuation of visible and near-infrared light in water.12 It is worth mentioning that the absorption line of is near the PBE and has the strongest absorption compared to the others; it may corrupt the band gap and thus alter the PBE. Refractive index liquids (Cargille Labs) having the refractive indices of 1.35, 1.37, and 1.39 were used to determine the sensitivity of the refractive index measurement. The corresponding calibrated refractive index accuracy for each liquid is . Figure 6a shows the normalized transmission spectra taken after filling the fiber with liquids. For each measurement, a new fiber was used in order to avoid the possibility of contamination that might affect the measurements. The wavelengths of rising PBEs were unable to be recorded since they were out of the operating range of the SC source and OSA. Two conclusions can be drawn from Fig. 6a. First, the transmission window shifts to a shorter wavelength when the refractive index of the liquid increases. When the refractive index varies from 1.333 to 1.39, the falling PBE has a shift from to . Second, with an increase of the refractive index, the transmission window becomes lossier. This is caused by the low index contrast between the solution and the silica reducing the confinement of the light. In Fig. 6b, the wavelengths of the falling PBEs are plotted as a function of the ambient refractive index . The wavelengths of the falling PBEs at , 1.37, and 1.39 are fitted by using Eq. 3, where is ignored since the falling PBE is possibly distorted by the absorption of water at the wavelength of . The large discrepancy between the experimental results at and the fitted curve further proves this assumption. This can be avoided by choosing a PBGF that has a different center operating wavelength, for example, . On the other hand, for other refractive indices, the experimental results show good agreement with the analytical results with a correlation coefficient of , since there are no strong absorption lines in the vicinity of their PBEs. The minimum detectable refractive index change depends on the demodulation technique and operating refractive index. In Fig. 6, it can be seen that the PBE has a blue shift of for at . An RIU sensitivity on the order of should be obtained by using the demodulation technique, which can achieve a resolution of about for wavelength detection. 4.DiscussionThe PBGF-based sensor has so far only been tested in applications as a nonspecific biosensor, which shows its potential to measure the concentration of a specific solution. The use of the PBGF sensor to distinguish different solutions appears possible assuming that a biorecognition element is immobilized on the inner surface of the holey region of the fiber by physical or chemical methods.1 It has been demonstrated that goat antihuman (antibody) can be used as a biorecognition element to detect a specific biomolecule, human (antigen).4 This concept may be used for a variety of biodetection events by using different biorecognition elements, such as various enzyme and antibodies. The sensitivity to the concentration variation can be estimated by considering the formation of the biolayer on the inner surface of the holey region.5 In order to simulate the biolayer effect, a simplified three-layer model of a hole in the cladding for evaluating the wavelength shift of PBEs is proposed, as shown in Fig. 7 . The three layers include (1) background material with a refractive index , (2) biomolecular layer with refractive index and thickness , and (3) bulk solution region with a refractive index of and diameter of . When specific binding occurs, both the thickness and the refractive index of the biolayer change. It is really difficult to predict the exact final values of the thickness and the refractive index after the binding reaches equilibrium or saturation. However, it is possible to investigate two extreme cases for estimation of the corresponding sensitivity. The first situation is based on the assumption that the refractive index of the biolayer is constant, whereas its thickness changes during binding. The shifts of the wavelength of the PBEs can be evaluated by using PWE methods assuming that and . The PBGF in the simulation has a cladding pitch of and a hole diameter of , which has a transmission spectrum spanning from to when and . The shift in the wavelength of the falling PBE with respect to the thickness is demonstrated in Fig. 8 . The wavelength shift is a linear function of the thickness of the biomolecular monolayer with a slope of . The maximum thickness is around for a typical biosensor. A small variation of in the thickness can be detected when a wavelength shift of can be detected. According to Ref. 5, this result corresponds to a surface coverage change for the detection of proteins, which is on the same order as other optical methods, such as the SPR method (gold film: ; silver films: and integrated optical (IO) sensors with grating couplers .3 The second case is based on the assumption that the thickness is kept constant at , whereas the refractive index is varied from 1.333 to 1.45. The wavelength shift of the falling PBE is plotted as a function of in Fig. 9 . A linear relationship is observed with a slope of . Assuming a wavelength shift of can be detected, a small refractive index variation can be measured. The minimum detectable surface coverage can be evaluated by using de Feijter’s formula:13 where is the concentration of the molecules and is the corresponding refractive index increment. For example, the refractive index increment of proteins varies remarkably little from one protein to another and has a typical value of .5 Therefore, the minimum detectable surface coverage is . To take human IgG as an example, the analyte concentration required to obtain this minimum surface coverage after equilibrium is on the order of according to Ref. 14. It should be noted that this sensitivity might be enhanced by modifying the size of the holes, which requires further investigation.The main advantage of the PBGF sensor is that it provides high sensitivities for refractive index measurements, which results from the large wavelength shift of PBEs with respect to refractive index change. The sensitivity to the concentration variation is estimated to be around for human detection. In addition, the design rules are simple, as described by Eqs. 2, 3. This device is also robust since there is no need for the removal of the cladding, which is commonly required in a fiber-based SPR system. Although silica is the most commonly used material for fabricating PBGF, a polymer, such as polymethylmethacrylate (PMMA), is another attractive option.15 One of the advantages of polymer-based fibers over silica ones is that many biological substances are more compatible with polymers than with silica. The preparation of the air holes with the deposition of a sensor layer should be easier and hence more reliable and reproducible. The PBGF biosensor also has the merit of small volume sample consumption, which is less than . An important practical consideration is the potential for the reusage of the PBGF for multiple tests during semicontinuous online monitoring. For the demonstrated nonspecific sensing system, the PBGF can be cleaned with acetone and isopropanol. The filling and cleaning processes can be achieved with the aid of a pressure chamber.16 The PBGF-based sensor can be developed for detecting specific targets, for example, by using an immobilized antibody biosensor. Regeneration of the PBGF sensor for the antibody–antigen detection is also possible since many techniques have been demonstrated to dissociate antibody–antigen complexes, including pressure, an electrical field, and solvents.5 The regeneration methods can thus follow those techniques commonly used in conventional fiber optic biosensors. Another practical consideration involves temperature effects, which may limit the minimum detectability of analyte. For the demonstrated setup, the wavelength shift of the falling PBE under temperature variations is approximated to be , based on the knowledge that the temperature coefficient for liquids is almost always around . Therefore, it is necessary to perform the experiment in a temperature-controlled environment. On the other hand, it has been demonstrated that the evanescent wave is only intense at the silica-solution surface and vanishes completely after a short distance from the surface.16 Therefore, the band gaps are most likely to be influenced significantly by the refractive indices in close proximity to the inner surface of the holey region of the PBGF, i.e., the layer of biomolecules deposited on the inner sides of the holes, rather than the average refractive index in the pores. This is expected to make the target specific biosensor more robust to variations of temperature, but this requires further investigation. The final concern comes from the background humidity, contamination, and pollution, which may come from the accumulation of the residual antigen after several uses of the PBGF biosensor. These effects can be minimized by the retreatment of the inner surface of the holey region of the fiber for further reusage. A typical procedure is to remove all the coatings (including antigen, antibody, cross-linking agents, and APTs) from the inner surface of the holey region by using acid treatment.5 5.ConclusionThe feasibility of using PBGF for biochemical sensing applications has been demonstrated. The variations of the ambient refractive indices inside the holey region of the PBGF from 1.333 to 1.39 can produce a blue shift of in the wavelength of the falling PBE, which agrees well with the analytical prediction. Immobilization of biorecognition elements on the inner surface of the holey region of the fiber could provide a new class of PBGF-based label-free biosensors with sensitivity around , which requires less than of sample. Furthermore, the strong interaction between the guiding light and the sample inside the core of the PBGF offers opportunities for designing biosensors based on other spectroscopic techniques, such as fluorescent spectroscopy15 and Raman spectroscopy.17 ReferencesP. N. Prasad,
“Optical biosensors,”
Introduction to Biophotonics, 311
–356 John Wiley & Sons, Hoboken, NJ (2003). Google Scholar
B. P. Nelson,
T. E. Grimsrud,
M. R. Liles,
R. M. Goodman, and
R. M. Corn,
“Surface plasmon resonance imaging measurements of DNA and RNA hybridization adsorption onto DNA microarrays,”
Anal. Chem., 73 1
–7
(2001). https://doi.org/10.1021/ac0010431 0003-2700 Google Scholar
W. Lukosz,
“Principles and sensitivities of integrated optical and surface plasmon sensors for direct affinity sensing and immunosensing,”
Biosens. Bioelectron., 6 215
–255
(1991). https://doi.org/10.1016/0956-5663(91)80006-J 0956-5663 Google Scholar
M. P. DeLisa,
Z. Zhang,
M. Shiloach,
S. Pilevar,
C. C. Davis,
J. S. Sirkis, and
W. E. Bentley,
“Evanescent wave long-period fiber Bragg grating as an immobilized antibody biosensor,”
Anal. Chem., 72 2895
–2900
(2000). https://doi.org/10.1021/ac9912395 0003-2700 Google Scholar
Z. Zhang,
“Development of optical fiber biosensors with long period gratings,”
University of Maryland,
(2000). Google Scholar
E. Chow,
A. Grot,
L. W. Mirkarimi,
M. Sigalas, and
G. Girolami,
“Ultracompact biomedical sensor built with two-dimensional photonic crystal microcavity,”
Opt. Lett., 29 1093
–1095
(2004). https://doi.org/10.1364/OL.29.001093 0146-9592 Google Scholar
R. F. Cregan,
B. J. Mangan,
J. C. Knight,
T. A. Birks,
P. St. J. Russell,
P. J. Roberts, and
D. C. Allan,
“Single-mode photonic band gap guidance of light in air,”
Science, 285 1537
–1539
(1999). https://doi.org/10.1126/science.285.5433.1537 0036-8075 Google Scholar
T. A. Birks,
D. M. Bird,
T. D. Hedley,
J. M. Pottage, and
P. S. J. Russell,
“Scaling laws and vector effects in bandgap-guiding fibers,”
Opt. Express, 12 69
–74
(2004). https://doi.org/10.1364/OPEX.12.000069 1094-4087 Google Scholar
G. Antonopoulos,
F. Benabid,
T. A. Birks,
D. M. Bird,
J. C. Knight, and
P. S. J. Russell,
“Experimental demonstration of the frequency shift of bandgaps in photonic crystal fibers due to refractive index scaling,”
Opt. Express, 14 3000
–3006
(2006). https://doi.org/10.1364/OE.14.003000 1094-4087 Google Scholar
S. G. Johnson and
J. D. Joannopoulos,
“Block-iterative frequency-domain methods for Maxwell’s equations in a planewave basis,”
Opt. Express, 8 173
–190
(2001). 1094-4087 Google Scholar
B. Jensen,
L. H. Pedersen,
P. E. Hoiby,
L. B. Nielsen,
T. P. Hansen,
J. R. Folkenberg,
J. Riishede,
D. Noordegraaf,
K. Nielsen,
A. Carlsen, and
A. Bjarklev,
“Photonic crystal fiber based evanescent-wave sensor for detection of biomolecules in aqueous solutions,”
Opt. Lett., 29 1974
–1976
(2004). https://doi.org/10.1364/OL.29.001974 0146-9592 Google Scholar
W. S. Pegau,
D. Gray, and
J. R. V. Zaneveld,
“Absorption and attenuation of visible and near-infrared light in water: dependence on temperature and salinity,”
Appl. Opt., 36 6035
–6046
(1997). 0003-6935 Google Scholar
J. A. de Feijter,
J. Benjamins, and
F. A. Veer,
“Ellipsometry as a tool to study the adsorption of synthetic and biopolymers at the air-water interface,”
Biopolymers, 17 1759
–1772
(1978). https://doi.org/10.1002/bip.1978.360170711 0006-3525 Google Scholar
Ch. Fattinger,
H. Koller,
D. Schlatter, and
P. Wehrli,
“The difference interferometer: A high sensitive optical probe for quantifications of molecular surface concentration,”
Biosens. Bioelectron., 8 99
–107
(1993). https://doi.org/10.1016/0956-5663(93)80058-W 0956-5663 Google Scholar
J. Jensen,
P. Hoiby,
G. Emiliyanov,
O. Bang,
L. Pedersen, and
A. Bjarklev,
“Selective detection of antibodies in microstructured polymer optical fibers,”
Opt. Express, 13 5883
–5889
(2005). https://doi.org/10.1364/OPEX.13.005883 1094-4087 Google Scholar
L. Rindorf,
J. B. Jensen,
M. Dufva,
L. H. Pedersen,
P. E. Høiby, and
O. Bang,
“Photonic crystal fiber long-period gratings for biochemical sensing,”
Opt. Express, 14 8224
–8231
(2006). https://doi.org/10.1364/OE.14.008224 1094-4087 Google Scholar
K. Rottwitt,
K. Nielsen,
J. H. Povlsen,
G. Emiliyanov,
T. P. Hansen, and
J. B. Jensen,
“Raman spectroscopy using photonic crystal fibers,”
Proc. SPIE, 6005 60050G-1
–60050G-8
(2005). 0277-786X Google Scholar
|