
|
|
1.IntroductionThere are a number of applications in optical diagnostics and therapeutics that may be considered as pivotal in the sense that: 1. while meeting particular clinical needs that would have major impact, they have proved to date to be intractable to complete solution, despite this being possible in principle, and 2. a large effort has been expended in identifying, developing, and testing different approaches to the solution. Thus, they illustrate the challenge of translating discovery from the bench to the bedside. Conversely, these challenges have driven much of the development of biophotonics in the past , resulting both in the establishment of this as a distinct discipline and in spin-off solutions to other clinical and biomedical problems. Examples include: noninvasive optical measurement of blood glucose for diabetic monitoring, tumor detection in the breast, minimally invasive therapies for solid tumors, optical guidance, and ablation of atherosclerotic plaque, and neurophysiologic monitoring. Detection and treatment of dysplasia in patients with Barrett’s esophagus counts as one of these pivotal challenges and is the focus of this work. Named after the surgeon who first described the condition in 1957, Barrett’s esophagus (BE), leading to dysplasia and adenocarcinoma, represents a complex genetic/molecular/histopathological process.1 As illustrated in Fig. 1a , the normal esophagus has a squamous mucosa, i.e., the cells lining the luminal surface are flattened, giving a smooth surface on a microscopic scale. Reflux of acid or bile from the stomach (heartburn) is common among the Western population. In about 10% of the population, this is a chronic condition. Over time, this can lead to replacement of the squamous mucosa by intestinalized metaplasic glandular epithelium containing mucus-secreting columnar and goblet cells that are markers for BE. Under standard white-light endoscopy, as illustrated in Fig. 1c, the normal smooth, whitish-pink appearance of the squamous esophagus is invaded with irregular patches or fingers of reddish mucosa growing upward from the gastoesophageal junction. Patients with this chronic inflammatory condition have a significantly increased risk ( to 100 fold) of developing dysplasia within the field of abnormal Barrett’s mucosa. The cancer risk in BE patients is estimated to be to 1% per year,2 and the presence of dysplasia, particularly of high grade (HGD), is associated with a high risk. Further, the incidence of esophageal adenocarcinoma is increasing rapidly.3 Since the prognosis for patients with esophageal cancer is dismal ( survival ),4 it is standard practice to perform an esophagectomy on finding HDG, a high-risk invasive procedure with subsequent poor quality of life. Fig. 1(a) Histological, (b) gross sectional, and (c) endoscopic features of Barrett’s mucosa compared with normal squamous esophagus. Note the disordered, intestinal structure in BE compared to the layered structure in squamous esophagus. The red-appearing BE can be seen extending up from the gastro-esophageal junction into the whitish/pink-appearing normal lumen of the esophagus in the endoscopic image.  Hence the pivotal challenges for biophotonics in the management of BE patients are: 1. to improve the detection rate for finding dysplasia, particularly HGD, and 2. to eliminate dysplastic lesions in a minimally invasive way that significantly reduces risk of progression to cancer. For 1., the standard procedure in managing BE patients is regular surveillance by white-light endoscopy (WLE). Dysplastic lesions within areas of Barrett’s mucosa are rarely visible under WLE, so that endoscopy is used simply to guide biopsy, which usually comprises four-quadrant tissue sampling every 1 or of the BE field, resulting in tens of biopsies. These must then be sectioned, stained [usually with standard hemotoxylin and eosin (H and E)], and examined in detail by a pathologist to look for the telltale signs of dysplasia, including increased nuclear-to-cytoplasmic ratio, lack of Goblet cells, disorganization of glandular architecture, and dysplastic epithelium on the mucosal surface with loss of nuclear polarity. This is an invasive and expensive approach and, most importantly, is “hit and miss.” Given that the finding of HGD leads to a major surgical intervention, while missing it may lead to fatal cancer, there is an urgent need to improve the visibility of dysplastic lesions in BE during endoscopy, and this is the topic of most of this work. In terms of therapies, esophagectomy carries high morbidity and mortality, even in specialized centers.5 Hence, there is interest in endoscopic ablative approaches6, 7 as an alternative to esophagectomy in cases where the neoplasia is intramucosal, i.e., there is no evidence of invasion into the submucosa. (Endoscopic determination of whether or not there is such invasion is a biophotonics challenge in itself, in which optical coherence tomography may provide a solution, see “Optical Coherence Tomography” in Sec. 2.2.2). As discussed below, the generally accepted approach to this is to ablate the entire Barrett’s field, not just to target the identified dysplastic area. Photodynamic therapy is an approved method for this, based on recent Phase 3 trials,8 but there remains significant need for improvement in the current technique, and this is discussed in the therapeutic section. Finally, given the complexity of managing patients with BE and the rapid evolution of novel diagnostic and therapeutic methods, there has been increasing need to understand the cost-benefit aspects of the problem,9 particularly in light of limited health-care budgets and the need to set priorities for maximal socio-economic benefit as well as survival and quality of life10 for individual patients. This is outside the science and technology domains and so is not discussed, but it is important to consider these issues when evaluating the potential for any new technology to be introduced into clinical practice. In the case of BE, it is clear that this is a challenging issue. It is not the objective of this work to provide a comprehensive review of optical diagnostics and therapeutics for Barrett’s esophagus: for this, the reader is directed to Bergman,7 Wallace, Sullivan, and Rustgi,11 Wong Kee Song and Wilson,12 and references therein. Rather, the focus is on a critical analysis of the potential limitations and possible future development of each approach, either as a stand-alone modality or in combination with one another. It is important to note also that, although any one of these biophotonic techniques may, in the end, not prove useful in BE, some may have value in other applications. For many of the methods, the problem lies not so much in the technique or resulting technology per se, but in the complexity and heterogeneity of the changes in the tissues in this multistage disease process. In particular, the major problem with detecting dysplasia in BE is that the background tissue, i.e., the intestinal metaplasia, is not normal but rather is chronically inflamed. This is unlike the situation in, say, the bronchus or cervix, where the nondysplastic tissue is relatively normal and uniform across the mucosal surface. For treatment of patients with HGD in BE, the challenge for ablative techniques is the need to remove a large area of BE mucosa with low probability of leaving residual abnormal tissue that may serve as a focus for the subsequent development of dysplasia/cancer, which can be masked by re-epithelialization of the esophagus with overlying normal-appearing squamous mucosa. 2.Endoscopic Detection of Dysplasia in Barrett’s EsophagusThere have been many new optical endoscopic techniques developed and tested clinically, particularly in the last , some of which are/may be relevant to the BE problem. As summarized in Fig. 2 , they may broadly be divided into wide-field techniques, in which images over a substantial area of the mucosal surface are generated, and optical biopsy, in which optical images and/or spectra are generated over a restricted small area of the tissue surface, comparable in extent to that sampled in physical biopsy. These two domains overlap in some techniques in which it may be possible to combine the advantages of rapid scanning of the entire BE segment with the added information content of optical spectroscopy or microimaging at selected positions, such as suspicious areas that are seen on rapid, wide-field imaging. In considering the various techniques outlined next, it is worth remembering that a standard upper gastro-intestinal (GI) white-light endoscopy can be completed in typically . Since endoscopic practice/reimbursement is based on this paradigm, this effectively sets the bar for the performance of any new wide-field endoscopic imaging technique, unless the improvement in the resulting diagnostic information can justify the extra time, cost and effort. 2.1.Wide-Field Techniques2.1.1.Methods to improve white-light endoscopyMagnification/chromoendoscopyImproving the quality of white-light endoscopic images and increasing their information content has been an ongoing process. It includes incremental advances in endoscope technology, particularly the development of video endoscopes that in GI endoscopy are rapidly replacing fiber optic endoscopes (based on imaging bundles), and concomitant use of high-density charge-coupled device (CCD) detector arrays that have greatly increased the spatial resolution of white-light images. A standard WLE uses a CCD with . With a field of view of a few , the pixel size on the image is typically . High-resolution endoscopy (HRE) utilizes CCDs. Used in conjunction with high-magnification front-end optics (magnification endoscopy or endocytoscopy), this enables imaging down to close to the cellular level ,13 although at the cost of a much smaller field of view, so that this may more properly be thought of as an optical biopsy technique. Magnification endoscopy is most useful when combined with a tissue stain applied topically to the mucosal surface (chromoendoscopy).14 Such stains are generally chromogenic, i.e., optical absorbers of specific color that bind to either normal or abnormal mucosa. Examples, illustrated in Fig. 3 , are Lugol’s solution that stains normal squamous epithelium a yellow-brown color, methylene blue that is absorbed into cells and highlights specialized columnar epithelium (as in Barrett’s), and indigo carmine that accumulates in pits and valleys between cells and highlights mucosal architecture. These stains help enhance the BE-SE (squamous epithelium) contrast, but have not shown high sensitivity for the main challenge of highlighting dysplasia within BE. The best is probably crystal violet, which stains cell nuclei. This gives high sensitivity (96%) and some specificity for detecting esophageal dysplasia, at least in a subset of patients.15 An alternative to chromogenic stains is acetic acid,16 which is widely used in colposcopy to highlight lesions in the cervix. This breaks down the viscous glycoprotein surface layer and provides higher contrast of the surface epithelium by modifying the tissue refractive index (whitening). Again, this has shown sensitivity and specificity for BE versus SE of 100 and 66%, respectively, but has not improved the detectability of esophageal dysplasia. In summary, “…chromoendoscopy of the upper GI tract has failed to establish its role in diagnosing Barrett’s oesophagus and Barrett’s associated neoplasia so far.” (Kiesslich and Neurath17). This is not the same situation as in, say, the colon, where staining, particularly combined with magnification endoscopy, is of proven value in identifying flat adenomas that are otherwise difficult to see. Fig. 3Examples of chromoendoscopy of BE. (a) Lugol’s solution (courtesy of J. Bergman and M. Kara), (b) methylene blue, (c) crystal violet (adapted from Ref. 15, with permission), and (d) acetic acid (adapted from Ref. 16, with permission).  A recent development that, in some respects, emulates the idea of chromoendoscopy to enhance the image contrast is narrow-band imaging (NBI), illustrated in Fig. 4 . In this technique, rather than the red-green-blue channels being combined into a balanced white-light image, as in standard endoscopy, each is displayed as a separate image. This enhances the contrast in mucosal morphology and highlights the microvascular pattern of the tissue, both of which are altered in the transition from intestinal metaplasia (BE) to dysplasia. The image contrast arises from the differential attenuation of the three spectral regions, with the blue channel biased toward the most superficial layers, and the red light having the deepest penetration. Sharma 18 used NBI with WLE in an open study without a control group in 51 BE patients, and obtained very high sensitivity (100%) and specificity (98.7%) for detecting characteristic morphological changes (ridge/villous pattern) in high-grade dysplasia. NBI was not able to distinguish between LGD and nondysplastic BE. A recent exploratory study by Kara 19 in 63 BE patients (split into a learning set and a validation set) also yielded a high (94%) sensitivity [negative predictive value ] for detecting HGD in BE. However, as is often the case in early stage studies of new technologies for BE, the number of patients with dysplasia was disproportionately high relative to routine surveillance groups (due to preselection). Also, the specificity was only 74% [positive predictive value ], which may be due to the fact that the morphologic/microvascular changes are not universally present in all cases. (The same group has shown that is equivalent to HRE with indigo carmine staining, although this was also a nonrandomized study and only in high-risk patients.20) As is discussed later, the specificity may be improved further by combining NBI with autofluorescence endoscopy. Fluorescence endoscopyFluorescence endoscopy has an interesting history.21 It was revived in the early 1980s as part of photodynamic therapy (PDT) to image the uptake and localization of the photosensitizers, particularly in treating bronchial tumors. Earlier imaging studies of fluorescent compounds as a diagnostic tool go back to the 1920s. Several decades later, an attempt to improve the diagnostic (i.e., fluorescence) characteristics of one of these agents, hematoporphyrin, led serendipitously in the 1960s to the discovery of hematoporphyrin derivative (HpD), the first PDT agent to be approved for human use in 1993.22 Using a fiber optic endoscope modified for fluorescence detection, Lam, Hung, and Palcic then performed a series of clinical bronchoscopic studies, successively reducing the dose of HpD to minimize skin photosensitivity.23 Unexpectedly, they found that the highest detection rate for early stage lesions (dysplasia, carcinoma-in-situ) was with no HPD, i.e., utilizing the natural, endogenous fluorescence of the tissue. This autofluorescence broncho-scopy was then developed further and was recently approved by the FDA as an adjuvant to white-light bronchoscopy: the corresponding commercial system (Xillix Technology Corporation, British Columbia, Canada) is illustrated in Fig. 5 . In its most recent implementation, it comprises blue-light excitation with combined imaging of green fluorescence, detected by an intensified CCD camera, and red (diffuse) reflectance, detected by a nonintensified CCD.24 In this mode, early neoplastic lesions show as (false color) reddish on a blue-green normal tissue background. Fig. 5Autofluorescence endoscopy system, showing block diagrams of the optical functions under white-light and autofluorescence imaging modes. In fluorescence mode, a source filter is inserted that selects blue light plus a small fraction of the red light from the lamp, the latter serving to normalize the green fluorescence signal that is detected on an ICCD camera (courtesy Xillix Technologies Corporation, British Columbia, Canada).  There is reasonable understanding of the underlying mechanism for the fluorescence contrast seen at endoscopy in the bronchus, namely mucosal thickening that causes preferential increased attenuation of the green fluorescence from submucosal collagen, together with loss of extracellular matrix that reduces the collagen signal.25 The red channel here effectively serves to normalize the fluorescence image. At least four companies now have autofluorescence endoscope systems currently in clinical trials. There have been several clinical studies to evaluate auto-fluorescence endoscopy (AFE) in the GI tract,26 particularly in the colon to differentiate benign (hyperplastic) from premalignant (adenomatous) polyps27 and to increase the detection of flat adenomas, and in BE.28, 29, 30 As in the bronchus, this is always done in combination with WLE, not as a replacement for it. In the colon we have found significant increase (from 58 to 81%) in the ability to differentiate premalignant (ademomatous) from benign (hyperplastic) polyps.27 There is also a good understanding from confocal fluorescence microscopy of biopsies of the underlying tissue changes that enable this increase.31 Unfortunately, the situation in BE has been less encouraging. It has certainly been possible to visualize dysplasias that were missed on WLE and/or that are invisible under WLE, even after they have been localized by fluorescence, as illustrated in Fig. 6 . However, a recent randomized, crossover study comparing AFE and standard white-light videoendoscopy showed equivalent sensitivity and a lower specificity with fluorescence imaging.29 Note, however, that in practice these techniques would be used in combination rather than as alternatives, so that the combined accuracy is still higher than that of either single technique. For example, another study30 by the same group showed an increase in sensitivity for detecting high-grade dysplasia in BE from 23% for WLE alone to 33% for the combination, with several dysplastic lesions detected by AFE only. Nevertheless, it is clear that a significant problem with autofluorescence endoscopy in BE (at least with blue-light excitation) is the high level of autofluorescence in the nondysplastic BE mucosa itself and, particularly, the high point-to-point and patient-to-patient variability in this (see section on point spectroscopy). Primarily, these effects increase the false-positive rate to a level that is presently unacceptably high using white light and autofluorescence endoscopy alone. For example, a PPV of only 49% was recently reported by Kara, 30 even in a selected group of patients. We have recently shown by confocal fluorescence microscopy that dysplasia in BE is not accompanied by any significant alteration of the intrinsic fluorescence signature (i.e., in the endogenous fluorophores) of the epithelial layer compared with nondysplastic BE, at least with blue-light excitation.32 Hence, any diagnostic algorithm would need to exploit other tissue changes, such as altered tissue morphology or vascularity. Fig. 6Example of autofluorescence endoscopy (right), showing the high visibility of the dysplastic lesion in BE compared with the white light image (left). (courtesy M. Kara and J. Bergman, Amsterdam University Medical Center).  The main options to improve this situation are:
Approach 2. is considered later. For 1. there are several studies of fluorescence spectroscopy of various tissues using UV excitation (see Ref. 32), rather than the blue light that is employed in current AF endoscopic imaging systems. The rationale is that this provides access to additional endogeneous fluoropores,33 particularly collagen and NADH that are often altered in malignancy. However, initially, AF endoscopy used fiber optic endoscopes, for which the transmission at short wavelengths is relatively poor. With the introduction of video endoscopes with AF capability, this may be less of a limitation. In addition, there is a concern for mutagenesis with UV light, although this may not be significant in practice at the light exposures typically used in optical diagnostics, at least in point spectroscopic mode.34 There is also, in principle, the option to use multiple fluorescence excitation and/or emission wavelengths to improve the diagnostic power of AFE. Most work on these approaches to date have concentrated on point spectroscopy (see next), since implementation of such schemes becomes technically complex and, hence, prohibitively expensive in endoscopic imaging mode. However, since technology advances may alleviate some of the limitations of the multispectral approach, including swept laser sources and fast tunable filters, this may be a future option if there is compelling evidence that using more wavelengths would significantly improve the diagnostic accuracy. Note that this would not necessarily have to be justified on the basis of the BE application, if other endoscopic scenarios would benefit enough to drive the development of clinical systems: improved BE diagnosis would then be a side beneficiary. A compelling reason for such developments may be in providing spectral matching for multiplexed contrast-agent imaging (see next), more than for imaging autofluorescence. In AFE clinical systems to date, there have usually been two detection channels, primarily to reduce the confounding effects of factors such as varying endoscope-to-tissue distance and angle and tissue shadowing, to which single-channel detection is very vulnerable. Thus, for example, in the original system used in the lung and GI tract,25 the green fluorescence signal was normalized by the red fluorescence in each image pixel, so that when the geometric factors changed, their effects (partially) cancelled out. In the latest implementation,24 the red fluorescence has been replaced by the red diffuse reflectance signal, both to reduce cost (since reflectance imaging does not need an intensified CCD) and, for colonoscopy, to make the signal less disrupted by the strong red fluorescence (porphyrins) from fecal matter. There is now active research into whether there are other, or additional, reflectance channels that would further improve the sensitivity and/or specificity of AFE, particularly exploiting possible alterations in the diffuse reflectance spectrum due to differences in tissue blood content or oxygenation. Again, in imaging mode, the number of detection channels that can be used, even for reflectance, is restricted by complexity, speed, and especially cost, at least using conventional optical technologies. Note that all the studies discussed have used steady-state fluorescence: the option of time-resolved measurements are considered under point spectroscopy later, since it poses major technology challenges for endoscopic imaging. For approach 3. in the simplest conceptualization, fluorescent contrast agents are analogous to chromogenic stains for WLE. However, given the history of autofluorescence endoscopy, as outlined before, an initial focus was on using fluorescent PDT agents.21, 23 In particular, an appealing option has been to use aminolevulinic acid (ALA). This is a rate-limiting precursor in heme biosynthesis such that, when given in excess, it leads to increased levels of the fluorescent photosensitizer protoporphyrin IX (PpIX).35 Many studies in different organs, such as the bladder, cervix, and lung, have shown that ALA-PpIX can give high fluorescence contrast in early malignancy,21, 35 most likely due to increased metabolic rate and/or to reduced ferrochelatase, the enzyme responsible for converting PpIX to heme. ALA-PpIX has been studied extensively for photodynamic therapy for numerous early stage lesions, including dysplasia in BE, as discussed later. There have been several clinical studies of ALA-PpIX as a fluorescence endoscopy contrast agent in BE. For example, in a dose-ranging study in 47 BE patients, Endlicher 36 found a sensitivity of for dysplasia detection, but the specificity was only 27 to 56%. A recent study by our group37 has confirmed that there does not seem to be a combination of ALA dose or time interval between (systemic) administration and imaging that gives adequate reliability. The problem again is that there is high, and highly variable, PpIX synthesis in the nondysplastic BE itself that gives a confounding fluorescence background. An alternative to PDT sensitizers is to use a fluorophore linked to a targeting moiety that has specificity for the diseased tissue. In this approach, the optical properties of the fluorophore can be selected independently of its delivery to the tissue. This falls into the category of molecular imaging, which is being explored for many applications.38 There are essentially three elements in such a contrast agent: the fluoropore, the targeting moiety, and the linker between them. FluorophoresPossible fluorophores include organic dyes and the recently introduced quantum dot (Qdot) semiconductor nanoparticles. The former have been used widely in many preclinical studies of tumor detection/localization (see Ref. 38), mainly using far-red or near-infrared emitting dyes, to achieve maximum light penetration in tissue. For BE, Polglase 39 and Kiesslich 40 used intravenous fluorescein (not linked to any delivery or targeting moiety) as a fluorescent contrast agent during confocal endoscopy (see next), with excitation at , since deep light penetration is not required. Wróblewski 41 have used a water-soluble copolymer drug delivery system targeted to the surface glycoproteins that are expressed on BE mucus-secreting cells, and labeled this with the fluorophore fluorescein isothiocyanate (FITC) for fluorescence microscopy of human BE biopsies. To our knowledge this has not been reported to date in vivo and the question remains as to whether this would also differentially target dysplasia within BE. Compared to organic fluorophores, Qdot semiconductor nanopartices have high brightness, low photobleaching, a broad excitation spectrum, and relatively narrow and size-dependent (and hence, selectable) fluorescence emission spectra.42 As summarized in Table 1 , this confers several potential advantages for their use in fluorescence endoscopy, some of which could increase the efficacy of fluorescence-based diagnostics, including BE endoscopy. However, Qdot-based contrast agents have two main potential limitations for in vivo use. First, there is evidence that the maximum size of Qdots that can be administered systematically may be quite limited, since larger particles tend to be sequestered in organs such as the liver, spleen, and kidney, and hence do not reach the site of interest in adequate concentration. For example, renal filtration of Qdots shows a sigmoidal dependence on size with the 50% point at around (hydrodynamic diameter, including surface modifications).43 This would be a severe constraint in many in vivo fluorescence imaging situations. For any given Qdot material and structure, the emission wavelength increases monotonically with size. Thus, for example, CdTeZnS Qdots emit at around . Hence, a possible solution is to switch materials, such as InS Qdots, that emit longer in the near-infrared. However, for endoscopic detection of early lesions, such as dysplasia in BE, this may not be an issue, since relatively short wavelength (blue-green) excitation gives adequate mucosal penetration. Indeed, if there is less than perfect target specificity of the contrast agent, then this may actually be preferable to longer wavelengths, for which the mucosal contrast is decreased by contributions from deeper layers. Conversely, the autofluorescence background is generally higher at shorter wavelengths (as exploited in autofluorescence endoscopy). Hence, there are several counteracting factors in the optimal emission wavelength range for targeted Qdot (and organic fluorophore)-based fluorescence endoscopy, and this is the subject of current preclinical investigations,44 an example of which is shown in Fig. 7 , where Qdots conjugated to an antibody for targeting were applied in an animal model of BE. Fig. 7White-light (upper) and fluorescence (lower) images of the luminal surface of the esophagus in a BE rat model (immediately postmortem), at following intravenous application of a conjugate comprising -emitting Qdots conjugated to an antibody targeted to villin that is overexpressed in BE tissue (courtesy R. da Costa and W. Chan, University of Toronto). 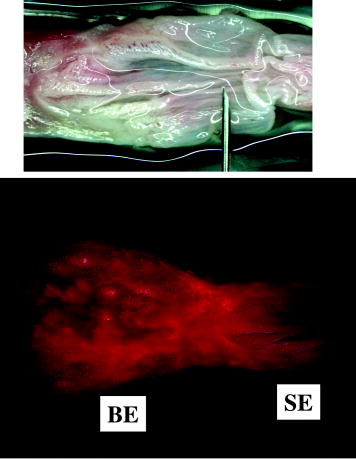 Table 1Potential advantages of Qdots compared to organic fluorophores for fluorescence endoscopy
The second concern is the possible toxicity of Qdots, due to their heavy metal content (e.g., cadmium).42, 45 The in vivo lifetime and integrity of the coatings of Qdots are major factors in ameliorating this toxicity, while Qdots of less toxic elements will also help to overcome this limitation. For endoscopic applications, such as in BE, applying the agent topically may mitigate some of this concern, depending again on the stability of the Qdots as they then pass though the GI tract and/or are cleared systematically. Targeting moietiesThe second element in developing fluorescence contrast agents for detecting dysplasia in BE is perhaps the most challenging, since it requires that there be alteration in one or more cell surface markers that are associated with transformation to dysplasia and that are expressed at a much lower level in the Barrett’s tissue itself. Although numerous markers have been identified at different stages along the cancer initiation and progression pathway in the esophagus, until very recently none were known that have this specific property. At least one marker (TRAIL/Apo2L) has been identified that is down-regulated in dysplasia.46 Unfortunately, this would yield negative fluorescence contrast, which is not a good feature for high-sensitivity imaging. In 2006, Dorer and Odze47 reported an enzyme, -methylacyl-CoA racemase (AMACR), that showed positive immunohistological staining (using an anti-AMACR antibody) with 81% sensitivity for high-grade dysplasia in BE, which is very encouraging. However, this is cytoplasmic rather than being expressed on the cell surface, which may make it difficult to target the fluorophore in vivo. On the other hand, as an active enzyme, it could be suitable for molecular beacon-based contrast (see next). A second potential marker is Survivin, a member of an apoptosis inhibitor gene family, which has shown increased expression in dysplasia compared to Barrett’s,48 although there was a large overlap in the ranges of expression. Other options besides antibodies for targeting include specific peptide sequences, aptamers, or antisense sequences. There are no examples at the present time. LinkersThe third element may be simply a passive linker that couples the fluorophore and target molecule without interfering significantly with the properties of either. Examples include covalent bond formation between carboxylic acids and biomolecules, steptavidin-biotin linking and cross-linking agents that are commonly used to couple carboxyl groups to primary amines. The optimum linker depends strongly on the specific physicochemical properties of the fluorophore and targeting moiety. It is important to minimize fluorescence quenching, especially with organic dyes. Alternatively, the molecular beacon concept could be used, in which the fluorophore is deliberately quenched through Forster resonant energy transfer until the linker is cleaved (e.g., by a disease-specific enzyme) or opened (in the case of a target-specific mRNA antisense sequence). These approaches have been demonstrated in various preclinical models, both for fluorescence imaging49 and, more recently, for photodynamic therapy.50 2.2.Localized Techniques (Optical Biopsy)Referring again to Fig. 2, there are several localized optical biopsy techniques that have been applied to the Barrett’s problem. These are either different forms of point spectroscopic or are localized (micro) imaging methods. 2.2.1.Point spectroscopiesFluorescenceClearly, autofluorescence spectroscopy (AFS) is an option and indeed has been used often as a means to determine the optimal spectral range(s) to apply in AF imaging. As an alternative to autofluorescence endoscopy, it has the advantages of being low cost and relatively easy to implement in the clinical setting. Typically a fiber optic probe is used, placed within the instrument channel of the endoscope. This is, however, not without its own problems.
These considerations apply to any endoscopic site, but the esophagus is particularly difficult because of the limited angle from which one can approach the tissue surface and its high motility due to the heart beat. In addition to these technical challenges, the fundamental problem with point fluorescence spectroscopy in BE, as illustrated by Fig. 8, is the large variability in the spectra from point to point in a given patient and between patients. Hence, even though on average there may be systematic differences with disease state, the variability makes it difficult to establish a robust spectral algorithm to detect dysplasia without the context of the autofluorescence appearance of the surrounding tissue that is obtained in imaging mode. It is not clear whether this variability will apply also with UV excitation, which Bourge-Heckly 51 have reported in a small patient series in vivo (using excitation and, interestingly, ratios of NIR fluorescence intensities rather than the more conventional visible range). Other advances, such as the use of time-resolved fluorescence, may also increase the diagnostic accuracy of point autofluorescence spectroscopy in BE, either in full time-resolved mode or using time gating,52 since this provides complementary information (on the tissue microenvironment) to steady-state spectroscopy. This approach has been implemented in the past in endoscopic imaging mode in the frequency domain.53 However, the technology was very expensive, since it required use of multiple high-frequency modulated ICCD cameras. Fig. 8Autofluorescence point spectra (blue-light excitation) in BE patients taken in vivo during routine endoscopy. Left: patient-averaged spectra for normal (squamous), gastric metaplasia, intestinal metaplasia (BE), and dysplasia. Right: individual measurements (courtesy N. Marcon and R. DaCosta, University of Toronto).  Is there a role for point spectroscopy combined with exogenous fluorophores? In other applications, this seems likely, especially using molecularly targeted contrast agents. A prime example is in fluorescence-guided tumor resection, where the strong signal with exogenous fluorophores, coupled with highly disease-specific targeting, could be used to probe the surgical margin for residual tumor (or tumor-associated) tissue. This might be used in combination with fluorescence imaging54 providing fast scanning of the resection surface, while point probing is used to check for subsurface extension of tumor and/or to enable quantification of the fluorescence signal, thereby providing an objective threshold for the presence or absence of tumor. In the case of dysplasia detection in BE, the approach faces two challenges: first, the general limitation of point spectroscopy versus imaging, and second, the need for a dysplasia-specific biomarker. ReflectanceThere is some confusion of terminology in this field between the terms (diffuse) reflectance spectroscopy (DRS), elastic scattering spectroscopy (ESS), and light scattering spectroscopy (LSS). The key factor that separates the techniques into two distinct classes is the extent to which there is an attempt to suppress or subtract the diffuse, i.e., multiply scattered, photons from the measured spectra to enhance the contribution of single- or few-scattering photons. If this can be achieved, either by using cross-polarization to select the true backscattered light or by numerical fitting and subtraction of the more slowly varying diffuse spectrum, then the fine spectral structure can be determined and depends on the details of the Mie-like scattering by the surface layer(s) of the tissue. The term LSS are used here for this technique. Diffuse reflectance spectroscopy (DRS) refers to measurements of the total spectrum of light from the tissue surface: in some cases, this can be (partially) separated into the absorption and elastic scattering (transport coefficient) components. For DRS, many of the same considerations discussed for point fluorescence spectroscopy also apply. In an ex vivo study using tissue biopsies, Lovat 55 found 92% sensitivity but only 60% specificity for detecting high-risk disease (high-grade dysplasia or cancer). Georgakoudi 56 found reasonable sensitivity (86%) and very high specificity (100%) in the transport scattering spectra between HGD and . Recently, Sterenborg57 used differential path-length spectroscopy in the esophagus (reported previously, for example, in the optical biopsy of the breast58) and found some evidence for differences in the hemogobin saturation with this semiquantitative technique, although the diagnostic accuracy for detecting dysplasia in BE is not known at this time. Recent work from our own laboratory supports this finding. Hence, in general there is likely diagnostic information in both the absorption and/or scattering spectra in DRS, although the differences are fairly subtle and it remains to be seen how robust any algorithms based on these would be in routine clinical practice. LSS has been applied to a variety of epithelial tissues. By fitting the Mie theory to the detailed spectra, with the scattering particle size distribution as a free parameter in the fit, it has been possible to show differences in these distributions,59 likely associated with altered nuclear size, which is used as one histopathological marker of dysplasia due to increased cell ploidy and chromatin. Georgakoudi 55 found a sensitivity of 100% and specificity of 91% for HGD versus using this technique. A significant advance in LSS was reported recently by Yu at MIT,60 in which the backscatter spectra were measured at the tissue surface for both large and small values of the azimuthal angle between the incident light polarization and the scattering plane. This further isolated the contribution of nuclear scattering from that of other smaller organelles in the epithelial cells, as demonstrated by in vivo measurements in the colon in a small number of patients. As shown by Gurjar, 61 LSS can be extended to imaging, using a CCD camera and a set of narrow-band filters to sample the reflectance spectrum and, subsequently, extracting the nuclear size parameters at each image pixel point. This has not been reported to date for BE. There are significant technical challenges to achieve adequate spatial resolution and speed to make this a true endoscopic imaging technique that can be implemented at reasonable cost, and detailed studies will be needed to determine what spatial and spectral resolutions are needed to distinguish dysplasia in BE. Nevertheless, the importance of the method is that it exploits micromorphological features of tissues that are well established in clinical pathology as valid markers of dysplasia. RamanRather than using such structural features of the tissue as the diagnostic parameter, Raman spectroscopy (RS) probes the biochemistry of the tissue. In RS, the spectrum of light that is scattered inelastically from tissues is measured, which reveals the vibrational or rotational energy states of common molecular bonds, such as those in proteins, lipids, and nucleic acids.62 Hence, the spectra are typically much richer than (auto)fluorescence spectra that show only the electronic excited states. The practical challenge comes from the very low Raman signal, which is several orders of magnitude weaker than the autofluorescence. As a result, the background fluorescence from the tissue, and Raman and fluorescence contamination from the optical components themselves, particularly the fiber optics in endoscopic applications, are high relative to the true tissue Raman signal. In vivo endoscopic near-infrared Raman spectroscopy became technically possible only in the late 1990s with the availability, at reasonable cost, of compact diode lasers, high-efficiency notch filters, high-throughput holographic spectrometers, high-sensitivity CCD detectors, and specially designed fiber optic probes with in-line spectral filters. These enabled systems, such as that shown in Fig. 9 , that can collect a tissue spectrum with good signal-to-noise in a few seconds at safe light exposure levels.63, 64 Fig. 9In vivo NIR Raman spectroscopy system showing (a) schematically the laser, fiber optic probe, and spectrograph/CCD detector; (b) the details of the probe tip (central light delivery fiber, six circumferential collection fibers) with in-line spectral filters and beveled ends to increase the overlap between the illumination and collection light cones in the tissue; (c) the system in use with the probe placed within the instrument channel of an endoscope and in contact with the tissue surface; and (d) a typical NIR Raman spectrum of tissue with some of the main peak assignments (adapted from Ref. 62, with permission).  As has been seen in other sites, the changes in the NIR Raman spectra with dysplasia are fairly subtle, as illustrated in Fig. 10a . It is generally not the case that simple analysis, such as comparing the intensities of individual peaks in the Raman spectra, provides statistically robust diagnostic algorithms.65 Rather, the diagnostic information is spread throughout the whole spectrum, so that chemometric approaches66, 67 have proven necessary (and sufficient), primarily principal component analysis (PCA), followed by linear discriminant analysis. This is perhaps not surprising, since the Raman spectra do not, except in a few very special cases (e.g., tissue calcification), correspond to specific biomolecules. Rather, it is the alteration in factors such as the total protein-to-lipid ratio or the DNA content that provides the diagnostic information. Fig. 10NIR Raman in BE. (a) Average in vivo spectra averaged in 65 BE patients. (b) Component histograms from decomposition of Raman spectra measured in different regions on an ex vivo tissue biopsy (regions 1 and 2 -SE, regions 3 and 4-HGD). (c) Principal component map of the biopsy (adapted from Ref. 70, with permission).  NIR Raman spectroscopy has been found to have high diagnostic accuracy in a variety of tumor sites. In the case of BE, an ex vivo (biopsy) study in 44 BE surveillance patients showed 88% sensitivity and 92% specificity for HGD versus a consensus pathology classification model.67 It also highlighted an important issue for RS and any other optical techniques that have to be trained against the gold standard of histopathology, in demonstrating that multiple independent pathologists (at least three according to that study) are needed to account for the high interobserver variability. Recently, we have obtained sensitivity and specificity for differentiating high-risk (i.e., HDG or adenocarcinoma) from low-risk (LGD or BE) tissues in the 90% range using the in vivo endoscopic Raman system shown in Fig. 9, which is consistent with the ex vivo findings. (Note that we had earlier reported68 the tissue-handling conditions under which ex vivo RS measurements are valid, an issue that has often been overlooked in assessing new optical techniques using tissue samples.) Continuing evaluation and endoscopic applications of RS are hampered by the nonavailability of suitable fiber optic probes that provide adequate filtering of the fiber fluorescence and Raman signals and of the tissue autofluorescence, since the original commercial unit (Visionex, Atlanta, GA) is no longer available. Alternative probe designs have been explored69 to improve the performance and/or get around the original patents, but again these are not available to the general community. To circumvent this problem, Koljenovic in Rotterdam70 recently suggested using the wavenumber range, where the silica Raman background is much lower than the standard fingerprint region of . Equivalent diagnostic efficacy for the two wavenumber regions was demonstrated in brain tumor and bladder tissues ex vivo, even though the actual spectral information content may be different. This is a promising new approach that bears exploration for application to BE. An important advance in understanding the biochemical basis for the observed spectral changes has been recently reported by Shelly 71 using microscopy to map the full Raman spectrum across tissue biopsy specimens. PCA was then used, and maps of the principal component values were generated [Fig. 10c]. In addition, by fitting the basis spectra of known tissue constituents to the measured spectra, the relative concentration of each constituent was determined for each image pixel [Fig. 10b]. Signatures for DNA, oleic acid, collagen 1, and actin were associated with HGD compared to normal squamous esophagus, in which glycogen showed significant peaks. Further studies on a larger number of samples, including the full range of esophageal pathologies, are needed, but this study has shown the value of such detailed spectral mapping. It would, of course, be a significant advance if such maps could be produced in vivo during endoscopy, since this could increase even further the diagnostic power of the Raman characteristics. With spontaneous Raman, as used to date, imaging or even crude mapping is impracticable during endoscopy: the signal is simply too weak ( scattering, to ). There are two possible ways in which this might be overcome. The first is to use coherent anti-Stokes Raman spectroscopy (CARS) a nonlinear version of RS that has an intrinsic signal strength to times higher than spontaneous Raman, for which video-rate in vivo CARS microscopy has been reported,72 although not for BE tissues to date. An interesting challenge will lie in the spectral analysis in this case, since the signal depends quadratically on the molecular concentrations, so that linear chemometric algorithms will not be applicable. The laser sources required are also currently fairly complex and expensive for clinical endoscopic use. The second possibility would be to use surface-enhanced Raman spectroscopy (SERS), exploiting the huge (up to about fold) increase in the Raman signal from molecules that are close to a metal surface, particularly metal nanoparticles. One could envisage two ways in which this might be applied: by administering targeted metal (e.g., gold) nanoparticles topically or systemically, which would accumulate preferentially in dysplasia, or by using a metal-coated fiber optic probe placed in contact with the tissue. A bioprobe based on the latter approach has been recently reported for in vivo glucose monitoring,73 one of the other pivotal challenges in biophotonics. Each of these approaches raises many issues. For example, in the first case, the same problem of targeting applies as in fluorescence contrast agents, although toxicity is much less of a problem with gold NPs than with quantum dots. In addition, since the SERS enhancement factor varies inversely as the sixth power of the distance between the metal surface and the Raman-active molecule, the microlocalization of the targeted material will be critical. This is also a factor in the second approach, since intimate contact with the tissue surface is required. 2.2.2.Point imagingThere are several techniques where high-resolution images can be acquired over a small (point) field of view, essentially emulating histopathology. EndocytologyMicroendoscopy, or endocytology, is the extreme extension of high-magnification endoscopy, in which, using a contact endoscope with high-magnification optics, real-time in vivo images of the tissue surface ( depth) can be obtained with close to cellular resolution over a submillimeter field of view . For example, Inoue 74 reported initial studies in the esophagus, using methylene blue staining of the mucosa, with optical magnification . Confocal endoscopyThe principle of confocal imaging, used widely in microscopy, has been transferred into endoscopy in the past few years, with several different technological approaches reported. As in microscopy, the concept is to perform point scanning across a specific depth in tissue (up to a few hundred microns) by focusing a laser beam at this depth and rejecting out-of-plane photons by a pinhole placed in front of the detector. This can be done either in reflectance or fluorescence mode, the latter being achieved simply by using narrow-band excitation and filtered detection. In a typical confocal microscope, the optics themselves are macroscopic and must be down-scaled by a large factor for endoscopic use. Figure 11 shows a system with direct miniaturization of the optics,39 which is the approach that is most developed as a clinical system (Optiscan/Pentax), together with examples of the image quality and resolution with this system, using fluorescence contrast enhancement. This system has a depth resolution over a focal range up to depth, with images, generated at approximately 1 frame per second. With this device, Keisslich 40 obtained diagnostic accuracy for detection of neoplasia in BE patients. Two examples of alternative technological solutions, as reviewed in Ref. 75, are illustrated in Fig. 12 , namely the use of MEMS at the distal end of the endoscope to perform the light beam scanning or placement of the scanning outside the body (proximally) with a digital micromirror (DMD) array to select specific fibers in a coherent fiber bundle. Fig. 11High resolution confocal endoscopy (endomicroscopy) based on miniaturization of the distal scanning optics at the tip of a probe placed through the endoscope biopsy channel (from Ref. 39, with permission). The lower images show in vivo frames of Barrett’s and dysplastic glands, demonstrating near-histological resolution, taken under fluorescence with intravenous fluorescein contrast enhancement. Field of view (adapted from Ref. 40, with permission). 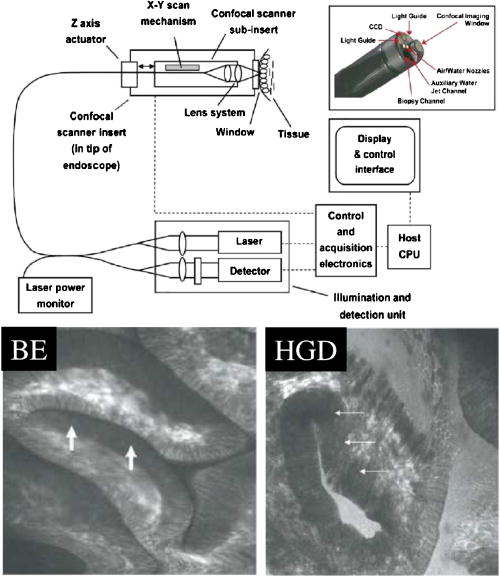 Fig. 12Two alternative technologies for confocal endoscopy. Top: MEMS-based system. Bottom: DMD-imaging fiber bundle configuration (adapted from Ref. 75, with permission). 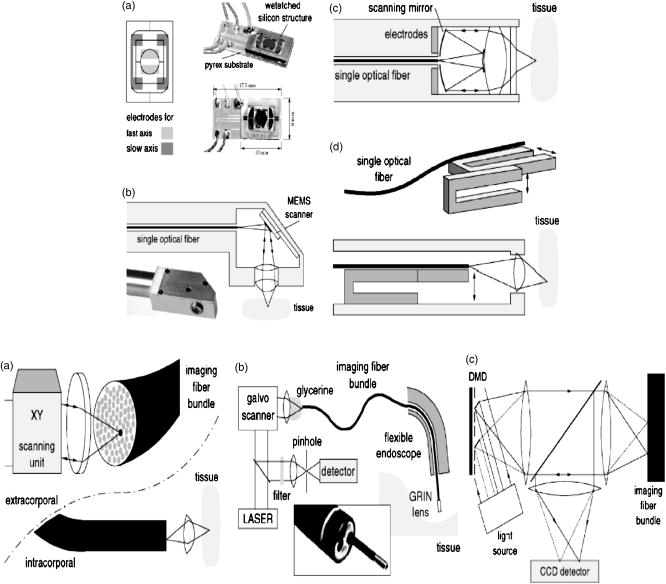 The confocal approach has the advantage over direct ultrahigh-magnification endoscopy of allowing depth scanning, and is probably more amenable to fluorescence implementation. However, improvements are required to increase the frame rate and to achieve greater depth of penetration: the latter will probably require moving from the visible into the NIR wavelength range. Another possibility, at least conceptually, would be to use two-photon excitation: as in microscopy, this would have the advantage of greater depth of imaging and reduced photobleaching, but is likely to be cost prohibitive in the near term, because of the need to use a fs laser source, and dispersion in the fiber optics could also be a problem. Optical coherence tomographyWe76 and others77, 78 have developed endoscopic OCT, the optical analog of (high-frequency) ultrasound, with which it has been compared in BE.77 A system is illustrated in Fig. 13 that provides both structural and Doppler microvascular images. Ex vivo and in vivo studies have demonstrated the capability of OCT to image the changes in tissue microarchitecture, including the loss in BE of the well-ordered layered structure of the normal squamous epithelium and the increased microvasculature in the latter, consistent with observations made by histology, reflectance spectroscopy, and confocal microendoscsopy. The advantages of OCT compared to confocal endoscopy are the higher speed (which allows video-rate imaging with good signal-to-noise ratio), the greater imaging depth (up to compared with ) and, with Doppler, direct microsvascular blood flow imaging. The deeper (cross sectional) imaging may be particularly valuable for staging of neoplastic lesions, if it is possible to see submucosal invasion, since this is a critical determinant of whether or not local endoscopic ablation can be used. At present the imaging depth is borderline for this, but should be improved by recent technological advances (see later). A recent study in 34 BE patients showed a 62% sensitivity and 82% specificity for detecting dysplasia (50 and 72% for HGD alone).79 This system did not include Doppler capability, so that the diagnosis was based solely on the structural features of the OCT images. The authors concluded that further improvement in the spatial resolution ( lateral, axial) and in the characterization of OCT features in dysplasia are required. The intraobserver variance was also high, which may speak to the difficulty of interpreting the OCT structural images. Fig. 13Endoscopic Doppler OCT system. Left: schematic of the system and the side-looking fiber optic probe that is inserted through the endoscope biopsy channel. Right: in vivo Doppler images superimposed on the structural OCT images: (a) normal squamous and (b) BE. (c) and (d) show the corresponding histology.  A possible further limitation of OCT compared with other techniques is that it cannot operate in fluorescence mode, which restricts the use of contrast agents to those such as gold nanoparticles80, 81 that enhance the optical backscattering. The pros and cons of this approach are discussed later. Until recently, endoscopic OCT also suffered from the same fundamental limitation as the other point techniques in being able to scan only a very small field of view, thus restricting its use as a rapid surveillance tool, albeit with very high potential information content to allow in situ diagnosis. A major breakthrough has been the replacement of the established time-domain (TD) OCT by frequency-domain OCT.82 In TD-OCT, as the reference mirror is scanned (see Fig. 13), the tissue is sampled along the depth (A-scan) axis point by point. At any instant, light from all other depths along the A-scan is rejected by the coherence gate (that provides the high depth resolution). Thus, most of the light is wasted, which sets the tradeoff between imaging speed and signal-to-noise in the images. Two methods have been demonstrated that utilize the full back-reflected signal: spectroscopic OCT, in which the backscattered light is spectrally dispersed (through a spectrograph onto a CCD detector), or swept-source OCT, in which a single point detector is used but the wavelength is swept rapidly through the spectra bandwidth of the system. These Fourier-domain techniques, while technologically challenging and conceptually complex, are both feasible, with various advantages and limitations in terms of cost, ease of implementation, and performance. From the clinical perspective, the critical point is that they can be used to speed up OCT by a large factor, so that large-area scanning becomes possible, as illustrated in Fig. 14 , where several centimeters of esophagus has been imaged in a few seconds, while retaining comparable subsurface depth and resolution to TD-OCT.83 Clinical trials of these technologies are in progress, and it is conceivable that this approach could become an important component in BE endoscopy. Recently, Doppler capability has also been reported with this system.84 Technical challenges for routine clinical use include: 1. how to make this compatible with biopsy (since at present a balloon is used to center the OCT probe in the esophagus), 2. how to balance the speed versus imaging depth, and 3. how to process and display to the endoscopist the huge digital image dataset that is generated and to coresister it with standard white-light endoscopy/biopsy. Fig. 14Swept-source OCT images of the normal (pig) esophagus in vivo in the region of the squamous-columnar junction, generated using a rotating probe that generates cross sectional images that are then translated along the axis of the esophagus. The 3-D rendering is shown in (a) and the corresponding 2-D cross sections in (b), (c) and [plus histology in (d)] (e) (reprinted from Ref. 83, with permission from the American Society for Gastrointestinal Endoscopy). 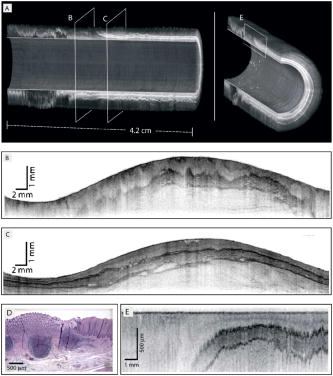 Table 2Advantages and limitations of endogenous versus exogenous contrast for dysplasia detection in BE.
2.3.Combinations of TechniquesAt this time, there is no single optical technique, either used alone or, more often, as an adjunct to standard WLE, that provides a complete solution to the problem of detecting dysplasia in BE, in that none has a low enough false positive and/or false negative rate to have replaced, nor even significantly reduced, the need for WLE-guided multiple biopsies. Certainly, many of the techniques are still undergoing further improvement, both in the core optical technology and in the use of molecularly-targeted contrast agents. Another approach is to recognize the complementary nature of the information provided by the different techniques (e.g., morphological versus biochemical, cellular versus microvascular), the complementary diagnostic strengths (high sensitivity versus high specificity), and the practicalities of each (e.g., speed versus tissue detail), by combining two or more together. This has been studied systematically by Georgakoudi 56 in the case of combining several point spectroscopic techniques: autofluorescence, diffuse reflectance, and light scattering spectroscopy. For discriminating between HGD and BE/LGD, autofluorescence and LSS each had good sensitivity but lower specificity, whereas reflectance spectroscopy added high specificity. The combination of the three techniques gave perfect performance (i.e., 100% sensitivity and specificity). Although it is not clear if such performance could actually be achieved in routine BE surveillance practice, the study does make the case for combining techniques. There are, of course, substantial technical challenges in combining these somewhat diverse technologies. Should this be done in a “top-down” or “bottom-up” manner? At one extreme, one could simply take each technology as a stand-alone system and apply them sequentially in each patient. The penalty would be the extra time and complexity of the clinical procedures. Alternatively, one could combine them at the “front end,” i.e., by constructing, in the case of point spectroscopies, a multifunctional fiber optic probe, while keeping the light sources, detectors, and other mainframe subsystems separate. While this would facilitate the clinical utility, the penalty is that the system costs are at least additive. The third, and ultimately the best, option is to design a complete, multifunctional system from scratch, since then the technology integration and operation can be optimized and duplication of components minimized. The challenge is to know beforehand which technologies to combine, so that in most cases, clinical trials using the first or second approach will be needed to establish this. A recent development that appears to have elements of the first two approaches is a trimodal imaging system that combines standard white-light video endoscopy with narrow-band and autofluorescence imaging, all integrated into the same endoscope. Using this system, Kara 85 have shown in high-risk BE patients that the false positive rate can be reduced from 40% to 10% (three techniques combined), by using the autofluorescence imaging primarily as a “red flag” to pick up suspicious lesions (that may not be seen on WLE), and then using NBI to examine the microstructural features in more detail to look for dysplastic features. Future extensive clinical trials with this system in the routine surveillance endoscopy setting could prove to be a breakthrough in BE endoscopy. The challenge for the other technologies may then become that of demonstrating additional value to this combination. This could be either through providing high-resolution detail (confocal or OCT imaging, light scattering spectroscopy), biochemical information (Raman), or by molecular targeting (contrast agents). 3.PhototherapeuticsAs indicated in the Introduction, the standard of care for Barrett’s patients with biopsy-proven HGD is esophagectomy. While this may seem a draconian measure, given that it can be based on a single proven small focus of premalignant tissue, the rationale is that the risk of developing invasive adenocarcinoma is high and, given the resulting poor prognosis at this stage, it is better to act prophylactically. Rather than simply removing the known dysplastic region, the whole Barrett’s-involved esophagus is usually targeted, again because of unknown risk, in the case of there being other dysplasic foci that are not detected at endoscopy, or of re-epithelialization by normal-appearing squamous mucosa masking underlying neoplasia. However, given the high mortality and morbidity associated with esophagectomy, there has been increasing emphasis on alternative ablative therapies [particularly endoscopic mucosal resection (EMR)].6, 7 In this case, the objective can be either to ablate the known lesion or to remove the entire BE mucosa, and there is controversy about which approach is optimal. Physical removal of the mucosa can be achieved in several ways: mechanically, thermally, or photochemically. The tradeoffs are practicality (the time taken to remove a large area of Barrett’s mucosa), complexity, completeness of ablation, and skill level required. Mechanical ablation is really only practical over a limited area, such as the known lesion site. Thus, for example, this has been reported86 in patients who were not candidates for esophagectomy due to comorbid illness, using either a variceal ligation device or a lift-and-cut technique, in which saline was injected into the submucosa to lift the mucosa, which was then snared and removed by electrocautery. Thermal ablation can be carried out using a laser (Nd:YAG, ND:YAG-pumped KTP or argon ion) or, increasingly, an argon plasma beam (in which an ionized jet of argon is swept across the tissue surface, coagulating the mucosal layer), or multipolar electrocoagulation.87 Clearly, this is a time-consuming process, since the treatment spot is small, and it requires meticulous care to ensure that the whole Barrett’s mucosa is adequately treated. The photochemical technique of PDT has been investigated clinically by several groups over the past as a means to destroy the Barrett’s mucosa (plus any neoplastic regions therein). In principle, its significant advantage over EMR by the other techniques is that the whole BE area can be treated simultaneously rather than piecemeal. Correspondingly, it should be much less dependent on the skill of the endoscopist. The definitive study to date8 comprised a multicenter trial in which BE patients with biopsy-proven HGD were randomized either into a control group and treated with omeprazole (a proton pump inhibitor that reduces acid reflux), or a PDT-treatment group , who received both omeprazole and PDT. The PDT protocol was of Photofrin® (hematopophyrin derivative) intravenously, followed later by exposure of the entire BE segment to laser light. The light was delivered through a cylindrically diffusing optical fiber (at of diffuser length) that was centered in the esophagus by an inflatable balloon device (which also served to flatten the esophageal folds and so reduce optical shadowing). In addition, nodular HGD areas were pretreated with direct-beam exposure at . A second light treatment could be applied at follow-up endoscopy ( post Photofrin) to areas that appeared to have been under treated. Patients could also receive further 1 or 2 PDT treatments to areas that showed residual or new BE/dysplasia. Thus, it can be seen that this PDT approach was technically quite complex (e.g., adequate illumination required development of specific technology for light delivery) and was aggressive in ensuring maximal ablative effect. What then was the outcome? Addition of PDT to acid-reflux control increased the incidence of complete elimination of HDG from 39 to 77% and the occurrence rate for adenocarcinoma was also significantly less (13 versus 20%: ). Although these highly positive results led to FDA approval of this treatment, the PDT-treated patients had a significant (36%) incidence of esophageal strictures that required one or more dilations. This adverse effect is due to damage to the underlying muscularis layer of the esophagus, and indicates that Photofrin probably does not have adequate specificity. It is not likely that the photosensitizer or light doses can be reduced to attempt to open the therapeutic window without loss of primary efficacy. A possible option to confine the PDT activation to the more superficial layers would be to use shorter wavelength light.88 However, the main focus of continuing research on PDT for Barrett’s patients has been on alternative photosensitizers with greater potential selectivity, in particular ALA-PpIX and especially in Europe. Over the past , several studies have been published on ALA-PDT (doses ranging from ) for ablation of BE mucosa (with or without dysplasia) (see Siersema89 and references therein). In general, these studies have demonstrated a high degree of eradication of HGD and early cancer in BE, without the side effects of stricture or skin photosensitivity. However, a major concern has been occurrence of buried Barrett’s glands below the new squamous mucosa following treatment, presumably as a result of heterogeneous PpIX distribution. This might be reduced by using green rather than red light.88 (Note that this problem also occurs after other ablative therapies, so it is not unique to PDT and, in principle, it should be possible to have a lower incidence with PDT, since there should be no geographic missed areas.) The heterogeneity of PpIX distribution in BE tissues has been confirmed by recent work by our group using in vivo point spectroscopy and ex vivo confocal fluorescence microscopy,37 which is also relevant to dysplasia detection, as discussed before. An obvious evolution would be to combine EMR with ALA-PDT to increase the likelihood that areas of known dysplasia will receive adequate ablation. This has been explored by Bergman (cited in Ref. 7), yielding a 93% local remission rate reported at follow-up. Nevertheless, the concern over missed areas remains. The other photosensitizer that has been considered to date for PDT of Barrett’s is mTHPC, a potent chlorin derivative, which was activated either at 652 or , delivered either from a bare fiber or a cylindrical diffuser.90 The best results were achieved with diffuse red light, although a pilot study by another group91 reported good responses in a limited set of patients, with low stricture rate and no recurrent Barrett’s glands using green light . Hence, there appears presently to be an unavoidable tradeoff between potency of the sensitizer and the effective depth of treatment, as is discussed later. 4.Animal Models of Barrett’s EsophagosCompared with endogenous-contrast techniques, preclinical testing of potential diagnostic contrast agents and PDT sensitizers is critical, which requires a suitable animal model. While proof of principle of molecular imaging can be done in, for example, tumor xenografts, these do not adequately represent either the biology of BE/dysplasia or the relevant tissue milieu. Fortunately, there is an excellent model of BE, in which a surgical procedure is performed in rats, essentially allowing reflux of acid/bile into the esophagus. This results in Barrett’s-like transformation over a period.92 Figure 7 shows an example of this model with topical application of an antibody-Qdot conjugate. The disadvantages of this model are that it requires significant microsurgical skill, the postsurgery survival rate is poor, and the initiation time is long, so that it is a tedious and expensive approach. It is also not yet determined if the lesions are genetically fully equivalent to spontaneous human disease, so that caution has to be used when testing targeting agents based on specific biomarker changes. 5.Critique of Future DirectionsThis final section is included to stimulate debate on the future directions for research and development on optical techniques in BE, and should be read with the caveat that it reveals the author’s own biases. There are several possible cleavage planes for the continuing development of optics-based solutions to the detection and treatment of BE-associated dysplasia: point versus area, morphology versus biochemistry, spectroscopy versus imaging, high versus modest spatial resolution, and endogenous versus exogenous contrast. The last is perhaps the most pivotal and is used to frame the discussion here. Table 2 summarizes the principal advantages and limitations of each approach. 5.1.Endogenous ContrastThe use of naturally occurring contrast, due to altered (micro) morphology and/or biochemistry of the esophageal mucosa, avoids the substantial regulatory and development-cost hurdles of exogenous contrast agents. However, given the results to date, it is unlikely that any single endogenous imaging or point spectroscopy method will provide adequate diagnostic accuracy to cause substantial alteration of current clinical practice. The trimodal system, based on incorporating AFI and NBI with white-light endoscopy, has given encouraging initial results.85 It also has the marked ergonomic advantage that its use does not require any major modifications to current clinical procedures, although it does extend the endoscopy examination time. If it should prove not to have sufficient diagnostic accuracy in routine surveillance endoscopy of BE, one could ask which of the other possible techniques might be added to “push it over the top.” Prima facie, given that the trimodal approach is primarily sensitive to alterations in tissue morphology, rather than tissue biochemistry, Raman spectroscopy could provide the most complementary information, especially if the trimodel approach lacks specificity more than sensitivity. It could be argued that this specificity could come from local OCT or CFE. However, the latter two methods require additional analysis time by the endoscopist to examine the detailed micromorphology, whereas Raman spectroscopy can be nearly instantaneous. Is there a single endogenous optical technique that might work? The author’s bias on this is that this will require a technique that can combine rapid, large-area imaging with biochemical information. The only method that might approach this is CARS imaging, so this should be a focus for future research efforts and will require significant technology development. The competitors will be FD-OCT (with or without Doppler capability) and light-scattering imaging. The challenges for rapid 3-D OCT will be to achieve high enough specificity, given that it is a purely morphology-based technique. Nevertheless, it could be implemented with display algorithms to flag suspicious areas for detailed examination. (Note that CARS has been demonstrated in OCT as a potential means to provide intrinsic molecular contrast, so that this is a possible extension to 3-D OCT.81) With LSI, the technological challenge will be to have it made fast enough for near-real-time imaging. It also is purely (micro)morphological, and so is not amenable to extension to provide molecular information. Is there a future for point-by-point methods, i.e., for optical biopsy? As stand-alone techniques, even in combination (e.g., ), this does not seem likely. Unless the diagnostic accuracy is near 100%, it will be difficult to impossible to replace standard biopsy protocols. The only potential role would then be to allow many more points to be sampled during endoscopy to decrease the miss rate for detecting dysplasia. However, biopsy confirmation would still be needed of any optically positive locations. Without carrying out large-scale prospective clinical trials, it is difficult to see how optical biopsy could become the standard of practice in BE endoscopy, even if, in some abstract sense, it could be more accurate than the clinical gold standard of biopsy-based histopathology.67 This view is, however, not universally held.55 5.2.Exogenous ContrastThe substantial advantages of exogenous contrast agents are that: 1. the optical signature is known and definitive, and only has to be detected against the tissue background signal (e.g., autofluorescence), and 2. in principle, they can exploit molecular targeting that is highly specific to the disease. As mentioned before, the fundamental missing element for this application is that there is not an established biomarker for dysplasic versus nondysplasic BE. As also noted earlier, there is recent evidence that such markers may exist,46, 47 and an important impact of this could be that targeting such markers, either in vivo during endoscopy and/or ex vivo at histopathology, will reduce the possibility of overdiagnosis of dysplastic lesions that can potentially result in unnecessary esophagectomy. Given such markers, what is the best optical reporter for in vivo use? Fluorescence is the obvious front runner, particularly using NIR fluorophores to minimize the tissue autofluorescence background, which then allows a lower biomarker concentration to be present and still obtain a good signal-to-background ratio. Fluorescence contrast agents also have the advantage that they could be useful for several of the optical techniques: large-area imaging, magnification endoscopy, confocal endoscopy, and point spectroscopy. Given their other potential disadvantages, Qdots are likely to be preferred over organic dyes for this application only if high-order (say ) spectral multiplexing is required. In turn, this will require identification of multiple, complementary, specific biomarkers. The tissue ultrastructure-based methods are less amenable to biomarker-targeted contrast enhancement. There is no obvious contrast agent for LSS/LSI, since this is based on an intrinsic nuclear morphology feature. Targeted nanoparticles could be used for OCT80 (including intravascular agents for Doppler enhancement). A fundamental limitation is that this is based on enhancing the light backscattering, which increases the optical attenuation and so further reduces the imaging depth, which is already marginal for this application (to see down to the submucosa). It may be possible to trade off between this factor and the imaging speed gain achieved through FD-OC, or it may be easier to apply OCT contrast simply to enhance dysplasia detection (by a local high surface brightness) rather than to attempt full-depth detailed imaging of the lesion (for staging). However, it will be very tricky to get this balance optimized in practice, so that this will require a substantial research effort, particularly in the validation phase. The possibility of targeted chromophores should not be discounted. If dysplasia-specific biomarkers are discovered, against which ligands can be synthesized, then these could be labeled with simple chromogenic dyes, enabling a new era of chromoendoscopy with the opportunity for much higher sensitivity and specificity. This would require little or no new endoscopic technology. The advanced imaging techniques would then need to carve out a space based on providing complementary information and, in this case, it is conceivable that optical biopsy could find a new role as a confirmatory technique that would allow immediate focal therapy to be given. In terms of future therapeutic roles of biophotonic-based techniques in BE, there is certainly a substantial need to improve the practicality and efficacy of endoscopic mucosal resection. One could conceive, for example, of combining imaging of the 3-D structure of the esophagus by high-speed OCT (as in Fig. 14) with an ablative device (possibly a high-power laser beam), incorporating feedback control to ensure complete ablation. With respect to PDT, it is clear that, despite considerable progress, there remains significant room for improvement. In a sense we are looking for the “Goldilocks” solution, i.e., a PDT regime that is neither too powerful (like Photofrin, with its collateral damage) nor too weak (like ALA-PpIX that risks under treating). This is a nontrivial challenge, especially considering the heterogeneity of the BE/dysplasia tissues, particularly the microvascularity, which affects the local photosensitizer delivery. Would the problem be helped by taking a molecular-targeting approach? This was suggested, for example by Wróblewski 41 as an application of their copolymer conjugates to achieve targeted photosensitizer delivery. It is important to recognize that a targeted PDT sensitizer (either through its intrinsic properties, by the use of a targeted delivery vehicle, or by exploiting the PDT beacon concept) needs to localize in both the metaplastic Barrett’s epithelium and in the neoplastic foci. This is the opposite of what is needed for detection of dysplasia, as discussed before, where specificity for dysplasia versus BE is required. Whether or not there is merit in attempting to incorporate both the detection and treatment properties into a single platform, which would enable a single procedure, the find-and-destroy strategy requires considerable analysis. Finally, one should also consider the potential of advances in biophotonics as tools for enhancing histopathology of BE biopsied tissues, which at present is based primarily, if not exclusively, on H&E staining. As knowledge increases of the genetic/proteomic/metabolomic changes that take place with initiation and progression of neoplasia in the esophagus, there will be a corresponding need to track these changes in individual patient tissues. Such advances are well matched by progress that has been made in the last decade or so in optical microscopies, particularly confocal fluorescence microscopy, including recently developed instruments that allow rapid whole-slide imaging in several fluorescence channels, or even in hyperspectral mode to allow spectral unmixing of multiple reporters.93 (Hyperspectral endoscopy94, 95 is also an evolving technology that will be well matched to the new era of molecular imaging.) The use of tissue microarrays may also become important to build up a bioinformatics database on BE patients, ultimately for correlation with clinical outcome and therapeutic interventions. Even if Qdots (or other fluorophores) are not used for in vivo diagnostics, they will play an important role as reporters for fluorescence microscopy. For example, we have recently demonstrated their use as molecular stains in protein expression quantification of tumor tissue microarrays.96 As is clear from the work illustrated in Fig. 10, there will also be a role for other analytic, laboratory-based techniques, such as Raman microscopy, in which targeted, nanoparticle-based SERS could be particularly useful.97 The pivotal challenge posed by BE patients illustrates many of the fundamental issues in translating research in biomedical optics from the bench to the bedside. In particular, a key factor has been that this is an iterative process, with new approaches arising from advances in molecular biology, optical biophysics, and/or photonic technologies being tested in pilot studies in BE patients and then being brought back to the laboratory for further improvement. Compared to other biophotonic applications, there has been relatively little focus on preclinical cellular or animal model studies, in part because of the difficulty or inadequacy of such models to represent the complex biophysical and biological milieu of BE tissues. This may change with the increasing focus on molecular-targeting strategies for novel contrast agents, where preclinical testing in vivo will be essential from an efficiency and, especially, from a safety point of view. It is worth ending with the observation that endoscopy remains one of the few fields of medical imaging (together with pathology) that have not yet been impacted significantly by advances in digital imaging sciences and molecular biology. This will change. Biomedical optics will continue to be at the center of this development and BE patients will be among the beneficiaries. AcknowledgmentsWork in the author’s laboratory cited here has been supported by the following: fluorescence endoscopy—Xillix Tech. Corporation, Photonics Research Ontario (PRO), and the Ontario Research and Development Fund (ORDCF). Qdots—Canadian Institutes for Health Research (CIHR). Raman spectroscopy—PRO; OCT-PRO, ORDFC, CIHR, and the Natural Sciences and Engineering Research Council. Macroscopy—Biomedical Photometrics Inc., and PRO. The author would like to thank in particular the GI endoscopy group at Saint Michael’s Hospital, Toronto (N. Marcon and M. Cirocco), Ralph DaCosta (also for critiquing the manuscript), Louis-Michel Wong Kee Song (now at the Mayo Clinic, Rochester, MN), and the OCT group at the Ontario Cancer Institute, especially I. A. Vitkin and V. Yang. ReferencesJ. Jankowski,
R. F. Harrison,
I. Perry,
F. Balkwill, and
C. Tselipis,
“Barrett’s metaplasia,”
Lancet, 356 2079
–2086
(2000). https://doi.org/10.1016/S0140-6736(00)03411-5 0140-6736 Google Scholar
D. J. Drewitz,
R. E. Sampliner, and
H. S. Garewal,
“The incidence of adenocarcinoma in Barrett’s esophagus: a prospective study of 170 patients followed ,”
Am. J. Gastroenterol., 92 212
–217
(1997). 0002-9270 Google Scholar
A. A. Botterweck,
L. J. Schoutten,
A. Volovick,
E. Dorant, and
P. A. van Den Brant,
“Trends in incidence of adenocarcinoma of the oesophagus and gastric cardia in ten European countries,”
Int. J. Epidemiol., 29 645
–654
(2000). 0300-5771 Google Scholar
SEER Cancer Statistics Review,
(2002) Google Scholar
J. M. Streitz Jr., H. Ellis Jr.,
“Barrett’s esophagus,”
General Thoracic Surgery, 1612
–1621 4th ed.Williams and Wilkins, Baltimore, MD
(1994). Google Scholar
A. Larghi,
C. J. Lightdale,
L. Memeo,
G. Bhagat,
N. Okpara, and
H. Rotterdam,
“EUS followed by EMR for staging of high-grade dysplasia and early cancer in Barrett’s esophagus,”
Gastrointest. Endosc., 62 16
–23
(2005). 0016-5107 Google Scholar
J. J. G. H. M. Bergman,
“Diagnosis and therapy of early neoplasia in Barrett’s esophagus,”
Curr. Opin. Gastroenterol., 21 466
–471
(2005). Google Scholar
B. F. Overholt,
C. F. Lightdale,
K. K. Wang,
M. I. Canto,
S. Burdick,
R. C. Haggitt,
M. P. Bronner,
S. I. Taylor,
M. G. A. Grace, and
M. Depot,
“Photodynamic therapy with porfimer sodium for ablation of high-grade dysplasia in Barrett’s esophagus: international, partially-blinded, randomized phase III trial,”
Gastrointest. Endosc., 62 488
–498
(2005). 0016-5107 Google Scholar
N. J. Shaheen,
J. M. Inadomi,
B. F. Overholt, and
P. Sharma,
“What is the best management strategy for high grade dysplasia in Barrett’s oesophagus: A cost effectiveness analysis,”
Gut, 53 1736
–1744
(2004). https://doi.org/10.1136/gut.2003.033837 0017-5749 Google Scholar
C. Hur,
E. Wittenberg,
N. S. Nishioka, and
G. S. Gazelle,
“Quality of life in patients with various Barrett’s esophagus associated health states,”
Health Qual. Life Outcomes, 4 45
–57
(2006). Google Scholar
M. B. Wallace,
D. Sullivan, and
A. K. Rustgi,
“Advanced imaging and technology in gastrointestinal neoplasia: Summary of the AGA-NCI symposium October 4–5, 2004,”
Gastroenterology, 130 1333
–1342
(2006). 0016-5085 Google Scholar
L. M. Wong Kee Song and
B. C. Wilson,
“Endoscopic detection of early upper GI cancers,”
Best Pract. Res. Clin. Gastroenterol., 18 833
–856
(2005). Google Scholar
D. B. Nelson,
K. P. Block,
J. J. Bosco,
J. S. Burdićk,
W. D. Curtis,
D. O. Faigel,
D. A. Greenwald,
P. B. Kelsey, E. Rajan,
A. Slivka,
P. Smith,
W. Wassef,
J. Vandam, and
K. K. Wang,
“High resolution and high magnification endoscopy,”
Gastrointest. Endosc., 52 864
–866
(2000). 0016-5107 Google Scholar
L. M. Wong Kee Song,
“Chromoendoscopy,”
Am. Soc. Gastroenterol., Google Scholar
Y. Amano,
Y. Kushiyama,
S. Ishihara,
T. Yuki,
Y. Miyaoka,
N. Yoshino,
N. Ishimura,
H. Fujishiro,
K. Adachi,
K. Maruyama,
M. A. K. Rumi, and
Y. Kinoshita,
“Crystal violet chromoendoscopy with micosal pit pattern diagnosis is useful for surveillance of short-segment Barrett’s esophagus,”
Am. J. Gastroenterol., 100 21
–26
(2005). 0002-9270 Google Scholar
F. J. Rey,
H. Inoue, and
M. Guelrud,
“Magnification endoscopy with acetic acid for Barrett’s esophagus,”
Endoscopy, 37 583
–586
(2005). 0013-726X Google Scholar
R. Kiesslich R and
M. F. Neurath,
“Chromoendoscopy in Barrett’s oesophagus: Is cresyl violet the magic bullet?,”
Dig. Liver Dis., 38 301
–302
(2006). Google Scholar
P. Sharma,
A. Bansal,
S. Mathur,
S. Wani,
R. Cherian,
D. McGregor,
A. Higbee,
S. Hall, and
A. Weston,
“The utility of a novel narrow band imaging endoscopy system in patients with Barrett’s esophagus,”
Gastrointest. Endosc., 64 167
–175
(2006). 0016-5107 Google Scholar
M. A. Kara,
M. Ennahachi,
P. Fockens,
F. J. W. ten Kate, and
J. J. G. H. M. Bergman,
“Detection and classification of the mucosal and vascular patterns (mucosal morphology) in Barrett’s esophagus by using narrow band imaging,”
Gastrointest. Endosc., 64 155
–166
(2006). 0016-5107 Google Scholar
M. A. Kara,
F. P. Peters,
W. D. Rosmolen,
K. K. Krishnadath,
F. J. W. ten Kate,
P. Fockens, and
J. J. G. H. M. Bergman,
“High-resolution endoscopy plus chromoendoscopy or narrow-band imaging in Barrett’s esophagus: A prospective randomized crossover study,”
Endoscopy, 37 929
–936
(2005). 0013-726X Google Scholar
G. A. Wagnieres,
W. M. Star, and
B. C. Wilson,
“In vivo fluorescence spectroscopy and imaging for oncological applications,”
Photochem. Photobiol., 68 603
–632
(1998). https://doi.org/10.1562/0031-8655(1998)068<0603:VFSAIF>2.3.CO;2 0031-8655 Google Scholar
J. Moan and
Q. Peng,
“An outline of the hundred-year history of PDT,”
Anticancer Res., 23 3591
–3600
(2003). 0250-7005 Google Scholar
S. Lam,
J. Hung, and
B. Palcic,
“Detection of lung cancer by ratio fluorimetry with and without Photofrin II,”
Proc. SPIE, 1201 561
–568
(1990). https://doi.org/10.1117/12.17585 0277-786X Google Scholar
H. Zeng,
A. Weiss,
R. Cline, and
C. E. MacAulay,
“Real-time endoscopic fluorescence imaging for early cancer detection in the gastrointestinal tract,”
Bioimaging, 6 151
–165
(1998). https://doi.org/10.1002/1361-6374(199812)6:4<151::AID-BIO1>3.0.CO;2-G 0966-9051 Google Scholar
S. Lam,
T. Kennedy,
M. Unger,
Y. E. Miller,
D. Gelmont,
V. Rusch,
B. Cipe B,
D. Howard,
J. C. LeRichie,
A. Coldman, and
A. F. Gazdar,
“Localization of bronchial intraepithelial neoplasic lesions by fluorescence bronchoscopy,”
Chest, 113 696
–792
(1998). 0012-3692 Google Scholar
G. N. J. Tytgat,
H. Yano,
H. Iishi,
M. Tatsuta,
T. Ogihara,
H. Watanabe,
N. Sato,
N. Marcon,
B. C. Wilson, and
R. Cline,
“Autofluorescence endoscopy: feasibility of detection of GI neoplasms unapparent to white light endoscopy with an evolving technology,”
Gastrointest. Endosc., 53 642
–650
(2001). 0016-5107 Google Scholar
S. A. Zanati,
N. E. Marcon,
M. Cirocco,
N. Bassett,
C. Streutker,
G. P. Kandel,
P. P. Kortan,
S. Rychel,
A. Douplik, and
B. C. Wilson,
“Oncol-LIFE fluorescence imaging during colonoscopy assists in the differentiation of adenomatous and hyperplastic polyps and improves the detection rate of dysplastic lesions in the colon,”
Endosc., Google Scholar
M. Kara,
R. S. DaCosta,
B. C. Wilson,
N. E. Marcon, and
J. J. G. H. M. Bergman,
“Autofluorescence-based detection of early neoplasia in patients with Barrett’s esophagus,”
J. Digest. Dis., 22 134
–41
(2004). Google Scholar
M. A. Kara,
M. E. Smits,
W. D. Rosmolen,
A. C. Bultje,
F. J. W. ten Kate,
P. Fockens,
G. N. J. Tytgat, and
J. J. G. H. M. Bergman,
“A randomized crossover study comparing light-induced fluorescence endoscopy with standard videoendoscopy for the detection of early neoplasia in Barrett’s esophagus,”
Gastrointest. Endosc., 61 681
–688
(2005). 0016-5107 Google Scholar
M. A. Kara,
F. P. Peters,
F. J. W. ten Kate,
S. J. van Deventer,
P. Fockens, and
J. J. G. H. M. Bergman,
“Endoscopic video autofluorescence imaging may improve detection of early neoplasia in patients with Barrett’s esophagus,”
Gastrointest. Endosc., 61 679
–685
(2005). 0016-5107 Google Scholar
R. S. DaCosta,
H. Andersson,
M. Cirocco,
N. E. Marcon, and
B. C. Wilson,
“Autofluorescence characterization of isolated whole crypts and primary cultured human epithelial cells from normal, hyperplastic and adenomatous colonic mucosa,”
J. Clin. Pathol., 58 766
–774
(2005). 0021-9746 Google Scholar
M. A. Kara,
R. S. DaCosta,
C. J. Streutker,
N. E. Marcon,
J. J. G. H. M. Bergman, and
B. C. Wilson,
“Characterization of tissue autofluorescence in Barrett’s esophagus by confocal fluorescence microscopy,”
Dis. Esophagus, 20 141
–150
(2007). 1120-8694 Google Scholar
R. S. DaCosta,
H. Andersson, and
B. C. Wilson,
“Molecular fluorescence excitation-emission matrices relevant to tissue spectroscopy,”
Photochem. Photobiol., 78 384
–392
(2003). https://doi.org/10.1562/0031-8655(2003)078<0384:MFEMRT>2.0.CO;2 0031-8655 Google Scholar
C. K. Brookner,
A. Agrawal,
E. V. Trojillo,
M. F. Mitchell, and
R. R. Richards-Kortum,
“Safety analysis: relative risks of untraviolet exposure from fluorescence spectroscopy and colonoscopy are comparable,”
Photochem. Photobiol., 65 1020
–1025
(1997). 0031-8655 Google Scholar
S. L. Marcus,
R. S. Soleb,
A. L. Golub,
R. L. Carroll,
S. Lundahl, and
D. G. Shulman,
“Photodynamic therapy (PDT) and photodiagnosis (PD) using endogenous photosensitization induced by 5-animolevulinic acid (ALA): current clinical and developmental status,”
J. Clin. Laser Med. Surg., 14 59
–66
(1996). 1044-5471 Google Scholar
E. Endlicher,
R. Knuechel,
T. Hauser,
R. M. Szeimies,
J. Scholmerich, and
H. Messmann,
“Endoscopic fluorescence detection of low and high grade dysplasia in Barrett’s oesophagus using systemic or local 5-aminolaevulinic acid sensitization,”
Gut, 48 314
–199
(2001). 0017-5749 Google Scholar
R. S. DaCosta,
B. C. Wilson,
L. D. Lilge,
M. Cirocco,
J. Kost,
R. Saidi,
P. Kortan,
G. Haber,
S. Hassaram,
L. M. Wong Kee Song, and
N. E. Marcon,
“Dosage and timing effects of 5-aminolevulinic Acid (ALA) on induced protoporphyrin IX (PpIX) fluorescence in patients with Barrett’s esophagus,”
Lasers Surg. Med., 0196-8092 Google Scholar
E. E. Graves,
R. Weissleder, and
V. Ntziachristos,
“Fluorescence molecular imaging of small animal tumor models,”
Curr. Mol. Med., 4 419
–430
(2004). Google Scholar
A. L. Polglase,
W. J. McLaren,
S. A. Skinner,
R. Kiesslich,
M. F. Neurath, and
P. M. Delaney,
“A fluorescence confocal endomicroscope for in vivo microscopy or the upper and lower GI tract,”
Gastrointest. Endosc., 62 685
–695
(2005). 0016-5107 Google Scholar
R. Kiesslich,
L. Gossner,
M. Goetz,
A. Dahlmann,
M. Vieth,
M. Stolte,
A. Hoffman,
M. Jung,
B. Nafe,
P. R. Galle, and
M. F. Neurath,
“In vivo histology of Barrett’s esophagus and associated neoplasia by confocal laser endomicroscopy,”
Clin. Gastroenterol. Hepatol., 4 979
–987
(2006). Google Scholar
S. Wróblewski,
M. Berenson,
P. Popečková, and
J. Popeček,
“Potential of lectin-N-(2-hydroxypropyl) methacrylamide copolymer-drug conjugates for the treatment of precancerous conditions,”
J. Controlled Release, 74 283
–293
(2001). https://doi.org/10.1016/S0168-3659(01)00338-8 0168-3659 Google Scholar
J. M. Klostranec and
W. C. W. Chan,
“Quantum dots in biological and biomedical research: recent progress and present challenges,”
Adv. Mater. (Weinheim, Ger.), 18 1953
–1964
(2006). https://doi.org/10.1002/adma.200500786 0935-9648 Google Scholar
S. C. Hak,
W. Liu,
P. Misra,
E. Tanaka,
J. P. Zimmer,
B. I. Ipe,
M. G. Bawendi, and
J. V. Frangioni,
“Renal clearance of quantum dots,”
Nat. Biotechnol., 25 1165
–1170
(2007). https://doi.org/10.1038/nbt1340 1087-0156 Google Scholar
M. Roy,
R. S. DaCosta,
R. Weersink,
G. Netchev,
S. Davidson,
W. Chan, and
B. C. Wilson,
“Quantum dots as contrast agents for endoscopy: mathematical modeling and experimental validation of the optimal excitation wavelength,”
Proc. SPIE, 6448 644812
(2007). 0277-786X Google Scholar
A. M. Derfus,
W. C. W. Chan, and
S. N. Bhatia,
“Probing the cytotoxicity of semiconductor quantum dots,”
Nano Lett., 4 11
–18
(2004). https://doi.org/10.1021/nl0347334 1530-6984 Google Scholar
N. K. Popnikolov,
Z. Gatalica,
P. A. Adegboyega,
B. A. Norris, and
P. J. Pastricha,
“Downregulation of TNF-related apoptosis-inducing ligand (TRAIL)/Apo2L in Barrett’s esophagus with dysplasia and adenocarcinoma,”
Appl. Immunohist. Mol. Morphol., 14 161
–165
(2006). Google Scholar
R. Dorer and
R. D. Odze,
“AMACR immunostaining is useful in detecting dysplasic epithelium in Barrett’s esophagus, ulcerative colitis and Crohn’s disease,”
Am. J. Surg. Pathol., 30 871
–877
(2006). 0147-5185 Google Scholar
D. Vallbohmer,
J. H. Peters,
D. Oh,
H. Karamochi,
D. Smimizu,
S. R. DeMeester,
J. A. Hagen,
T. Parakrama,
M. D. Chandrasoma,
K. D. Danenberg,
T. R. DeMeester, and
P. Danenberg,
“Survivin, a potential biomarker in the development of Barrett’s adenocarcinoma,”
Surg., 138 701
–707
(2005). Google Scholar
R. Weissleder,
C. H. Tung,
U. Mahmood, and
A. Bogdanov,
“In vivo imaging of tumors with protease-activated near-infrared fluorescent probes,”
Nat. Biotechnol., 17 375
–378
(1999). https://doi.org/10.1038/7933 1087-0156 Google Scholar
J. Chen,
K. Stefflova,
M. J. Niedre,
B. C. Wilson,
B. Chance,
J. D. Glickson, and
G. Zheng,
“Protease-triggered photosensitizing beacon based on singlet oxygen quenching and activation,”
J. Am. Chem. Soc., 126 11450
–11451
(2004). https://doi.org/10.1021/ja047392k 0002-7863 Google Scholar
G. Bourg-Heckly,
J. Blais,
J. J. Padilla,
O. Bourdon,
J. Etienne,
F. Guillemin, and
J. lafay,
“Endoscopic ultraviolet-induced autofluorescence spectroscopy of the esophagus: tissue characterization and potential for early cancer diagnosis,”
Endoscopy, 32 756
–765
(2000). 0013-726X Google Scholar
J. M. Song,
R. Jagannathan,
D. L. Stokes,
P. M. Kasili,
M. Panjepour,
M. N. Phan,
B. F. Overholt,
R. C. DeNovo,
X. Pan,
R. J. Lee, and
T. Vo-Dinh,
“Development of a fluorescence detection system using optical paramagnetic oscillator (OPO) laser excitation for in vivo diagnosis,”
Technol. Cancer Res. Treat., 2 515
–523
(2003). 1533-0346 Google Scholar
G. Wagnieres,
J. Mizeret,
A. Studzinski, and
H. van den Berg,
“Frequency-domain fluorescence lifetime imaging for endoscopic clinical cancer detection: apparatus design and preliminary clinical results,”
J. Fluoresc., 7 75
–83
(1997). 1053-0509 Google Scholar
W. Stummer,
U. Pichlmeier,
T. Meinel,
O. D. Wiestler,
F. Zanella, and
H. J. Reulen,
“Fluorescence-guided surgery with 5-aminolevulinic acid for resection of malignant glioma: a randomized controlled multi-center phase III trial,”
Lancet Oncol., 7 359
–360
(2006). Google Scholar
L. B. Lovat,
K. Johnson,
G. D. MacKenzie,
B. R. Clark,
M. R. Novelli,
S. Davies,
M. O’Donovan,
C. Selvasekar,
S. M. Thorpe,
D. Pickard,
R. Firzgerald,
T. Fearn,
I. Bigio, and
S. G. Bown,
“Elastic scattering spectroscopy accurately detects high grade dysplasia and cancer in Barrett’s oesophagus,”
Gut, 55 1078
–1083
(2006). 0017-5749 Google Scholar
I. Georgakoudi,
B. C. Jacobson,
J. Van Dam,
B. Backman,
M. B. Wallace,
M. G. Muller,
Q. Zhang,
K. Badizadegan,
D. Sun,
G. A. Thomas,
L. T. Perelmen, and
M. S. Feld,
“Fluorescence, reflectance and light-scattering spectroscopy for evaluating dysplasia in patients with Barrett’s esophagus,”
Gastroenterol., 120 1620
–1629
(2001). Google Scholar
H. J. Sterenborg, Google Scholar
R. L. van Veen,
A. Amelink,
M. menke-Pluyers,
C. van der Pol, and
H. J. Sterenborg,
“Optical biopsy of breast tissue using differential pathlength spectroscopy,”
Phys. Med. Biol., 50 2573
–2581
(2005). https://doi.org/10.1088/0031-9155/50/11/009 0031-9155 Google Scholar
L. T. Perelman,
V. Backman,
M. Wallace,
G. Zonios,
R. Manoharan,
A. Nusrat,
S. Shields,
M. Seiler,
C. Lima,
T. Hamano,
I. Itzkan,
J. Van Dam,
J. Crawford, and
M. Feld,
“Observation of periodic fine structure in reflectance from biological tissues: A new technique for measuring nuclear size distribution,”
Phys. Rev. Lett., 80 627
–630
(1998). https://doi.org/10.1103/PhysRevLett.80.627 0031-9007 Google Scholar
C. C. Yu,
C. Lau,
J. W. Tunnell,
M. Hunter,
M. Kalashnikov,
C. Fang-Yen,
S. F. Fulgum,
K. Badizadegan,
R. R. Dasari, and
M. S. Feld,
“Assessing epithelial cell nuclear morphology by using azimuthal light scattering spectroscopy,”
Opt. Lett., 31 3119
–3121
(2006). https://doi.org/10.1364/OL.31.003119 0146-9592 Google Scholar
R. S. Gurjar,
V. Backman,
L. T. Perelman,
I. Georgakoudi,
K. Badizadegan,
R. Itzkan,
R. R. Dasari, and
M. S. Feld,
“Imaging human epithelial properties with polarized light-scattering spectroscopy,”
Nat. Med., 7 12454
–1248
(2001). 1078-8956 Google Scholar
Handbook of Raman Spectroscopy, Marcel Dekker, New York
(2001). Google Scholar
M. G. Shim,
L. M. Wong Kee Song,
N. E. Marcon, and
B. C. Wilson,
“In vivo near-infrared Raman spectroscopy: demonstration of feasibility during clinical gastrointestinal endoscopy,”
Photochem. Photobiol., 72 146
–150
(2000). https://doi.org/10.1562/0031-8655(2000)072<0146:IVNIRS>2.0.CO;2 0031-8655 Google Scholar
G. J. Puppels,
T. C. Bakker Schut,
P. J. Caspers,
R. Wolthuis,
M. G. Shim, and
B. C. Wilson,
“In vivo Raman spectroscopy,”
Handbook of Raman Spectroscopy, 549
–574 Marcel Dekker, New York
(2001). Google Scholar
D. I. Ellis and
R. Goodacre,
“Metabolic fingerprinting in disease diagnosis: biomedical applications of infrared and Raman spectroscopy,”
Analyst (Cambridge, U.K.), 131 875
–885
(2006). https://doi.org/10.1039/b602376m 0003-2654 Google Scholar
L. M. Wong Kee Song,
A. Molckovsky,
K. K. Wang,
L. J. Burgart,
B. Dolenko,
R. J. Somorjai, and
B. C. Wilson,
“Diagnostic potential of Raman spectroscopy in Barrett’s esophagus,”
Proc. SPIE, 5692 140
–146
(2005). https://doi.org/10.1117/12.584986 0277-786X Google Scholar
C. Kendall,
N. Stone,
N. Shepherd,
K. Geboes,
B. Warren,
R. Bennett, and
H. Barr,
“Raman spectroscopy, a potential tool for the objective identification and classification of neoplasia in Barrett’s oesphagus,”
J. Pathol., 200 602
–609
(2003). https://doi.org/10.1002/path.1376 0022-3417 Google Scholar
M. G. Shim and
B. C. Wilson,
“The effects of ex vivo handling procedures on the near-infrared Raman spectra of normal mammalian tissues,”
Photochem. Photobiol., 63 662
–671
(1996). 0031-8655 Google Scholar
J. T. Motz,
S. J. Gandhi,
O. R. Scepanovic,
A. S. Hake,
J. R. Kramer,
R. R. Dasari, and
M. S. Feld,
“Real-time Raman system for disease diagnosis,”
J. Biomed. Opt., 10 031113
(2005). https://doi.org/10.1117/1.1920247 1083-3668 Google Scholar
S. Koljenovic,
T. C. Bkker Schut,
R. Wolthuis,
B. de Jong,
L. Santos,
P. J. Caspers,
J. M. Kros, and
G. J. Puppels,
“Tissue characterization using high wave number Raman spectroscopy,”
J. Biomed. Opt., 10 031116
(2005). https://doi.org/10.1117/1.1922307 1083-3668 Google Scholar
G. Shetty,
C. Kendall,
N. Shepherd,
N. Stone, and
H. Barr,
“Raman spectroscopy: elucidation of biochemical changes in carcinogenesis of oesophagus,”
Br. J. Cancer, 94 1460
–1464
(2006). https://doi.org/10.1038/sj.bjc.6603102 0007-0920 Google Scholar
C. L. Evans,
E. O. Potma,
M. Puoris’haag,
D. Cote,
C. P. Lin, and
X. S. Xie,
“Chemical imaging of tissue in vivo with video-rate coherent anti-Stokes Raman scattering microscopy,”
Proc. Natl. Acad. Sci. U.S.A., 102 16807
–16812
(2005). https://doi.org/10.1073/pnas.0508282102 0027-8424 Google Scholar
D. A. Stuart,
J. M. Yuen,
N. Shah,
O. Lyandres,
C. R. Yonzon,
M. R. Glucksberg,
J. T. Walsh, and
R. P. Van Duyne,
“In vivo glucose measurement by surface-enhanced Raman spectroscopy,”
Anal. Chem., 78 7211
–7215
(2006). https://doi.org/10.1021/ac061238u 0003-2700 Google Scholar
H. Inoue,
T. Kazawa,
Y. Sato,
H. Satodate,
K. Sasajima,
S. E. Kudo, and
A. Shiokawa,
“In vivo observation of living cancer cells in the esophagus, stomach and colon using catheter-type contact endoscope: ‘Endo-cytoscopy system’,”
Gastrointest Endosc Clin. N. Am., 14 589
–594
(2004). 1052-5157 Google Scholar
M. George,
“Optical methods and sensors for in situ histology in surgery and endoscopy,”
Minimally Invasive Ther. Allied Technol., 13 95
–104
(2004). 1364-5706 Google Scholar
V. X. D. Yang,
S. J. Tang,
M. L. Gordon,
B. Qi,
G. Gardinar,
P. Kortan,
G. B. Haber,
G. Kandel,
I. A. Vitkin,
B. C. Wilson, and
N. E. Marcon,
“Endoscopic Doppler optical coherence tomography in the human GI tract: initial experience,”
Gastrointest. Endosc., 61 879
–890
(2005). 0016-5107 Google Scholar
B. E. Bouma,
G. J. Tearney,
C. C. Compton, and
N. S. Nishioka,
“High resolution imaging of the human esophagus and stomach in vivo using optical coherence tomography,”
Gastrointest. Endosc., 2 467
–474
(2000). 0016-5107 Google Scholar
A. Das,
M. V. Sivak,
A. Chak,
R. C. K. Wong,
V. Westphal,
A. M. Rollins,
J. Willis,
G. Isenberg, and
J. A. Izatt,
“High-resolution endoscopic imaging of the GI tract: a comparative study of optical coherence tomography versus high-frequency catheter probe EUS,”
Gastrointest. Endosc., 54 219
–224
(2001). 0016-5107 Google Scholar
G. Isenberg,
M. V. Sivak,
M. Chak,
R. C. K. Wong,
J. E. Willis,
B. Wolf,
D. Y. Rowland,
A. Das, and
A. Rollins,
“Accuracy of endoscopic optical coherence tomography in the detection of dysplasia in Barrett’s esophagus: a prospective, double-blinded study,”
Gastrointest. Endosc., 62 825
–831
(2005). 0016-5107 Google Scholar
S. A. Boppart,
A. L. Oldenburg,
C. Xu, and
D. L. Marks,
“Optical probes and techniques for molecular contrast enhancement in coherence imaging,”
J. Biomed. Opt., 10 041208
(2005). https://doi.org/10.1117/1.2008974 1083-3668 Google Scholar
J. S. Bredfeldt,
C. Vinegoni,
D. L. Marks, and
S. A. Boppart,
“Molecularly sensitive optical coherence tomography,”
Opt. Lett., 30 495
–497
(2005). https://doi.org/10.1364/OL.30.000495 0146-9592 Google Scholar
M. Choma,
M. Sarunic,
C. Yang, and
J. A. Izatt,
“Sensitivity advantage of swept-source and Fourier-domain optical coherence tomography,”
Opt. Express, 11 2183
–2189
(2003). 1094-4087 Google Scholar
S. H. Yun,
G. J. Tearney,
B. J. Vakov,
M. Shishkov,
W. Y. Oh,
A. E. Desjardins,
M. J. Sutter,
R. C. Chan,
J. A. Evans,
I.-K. Jang,
N. S. Nishioka,
J. F. de Boer, and
B. E. Bouma,
“Comprehensive volumetric optical microscopy in vivo,”
Nat. Med., 12 1429
–1433
(2006). 1078-8956 Google Scholar
B. J. Vakoc,
M. Shishkov,
S. H. Yun,
W. Y. Oh,
M. Suter,
A. Desjardins,
J. Evans,
N. S. Nishioka,
G. J. Tearney, and
B. E. Bouma,
“Comprehensive esophageal microscopy using optical frequency-domain imaging,”
Gastrointest. Endosc., 65 898
–905
(2007). 0016-5107 Google Scholar
M. A. Kara,
F. P. Peters,
P. Fockens,
F. J. W. ten Kate, and
J. J. G. H. M. Bergman,
“Endoscopic video-autofluorescence imaging followed by narrow band imaging for detecting early neoplasia in Barrett’s esophagus,”
Gastrointest. Endosc., 64 176
–185
(2006). 0016-5107 Google Scholar
P. K. Nijhawan and
K. K. Wang,
“Endoscopic resection for lesions with endoscopic features suggestive of malignancy and high-grade dysplasia with Barrett’s esophagus,”
Gastrointest. Endosc., 52 328
–332
(2000). 0016-5107 Google Scholar
G. S. Dulai,
D. M. Jensen,
G. Cortina,
L. Fontana, and
A. Ippoliti,
“Randomized trial of argon plasma coagulation vs multipolar electrocoagulation for ablation of Barrett’s esophagus,”
Gastrointest. Endosc., 61 232
–240
(2005). 0016-5107 Google Scholar
R. Ackroyd,
N. J. Brown,
M. F. Davis,
T. J. Stephenson,
S. L. Marcus,
C. J. Stoddard,
A. G. Johnson, and
M. W. R. Reed,
“Photodynamic therapy for dysplastic Barrett’s oesophagus: a prospective, double blind, randomised, placebo controlled trial,”
Gut, 47 612
–617
(2000). 0017-5749 Google Scholar
P. D. Siersema,
“Photodynamic therapy for Barrett’s esophagus: not yet ready for the premier league of endoscopic interventions,”
Gastrointest. Endosc., 62 503
–507
(2005). 0016-5107 Google Scholar
L. B. Lovat,
N. F. Jamieson,
M. R. Novelli,
C. A. Mosse,
C. Selvasekar,
G. D. Mackenzie,
S. M. Thorpe, and
S. G. Bown,
“Photodynamic therapy with m-tetrahydroxyphenyl chlorin for high-grade dysplasia and early cancer in Barrett’s columnar lined esophagus,”
Gastrointest. Endosc., 62 617
–623
(2005). 0016-5107 Google Scholar
J. Etienne,
N. Dorme,
G. Bourge-Heckley,
P. Raimbert, and
J. Flijou,
“Photodynamic therapy with green light and m-tetrahydroxyphenyl chlorin for intramucosal adenocarcinoma and high-grade dysplasia in Barrett’s esophagus,”
Gastrointest. Endosc., 59 880
–889
(2004). 0016-5107 Google Scholar
C. J. Buskens,
J. B. F. Hulscher,
T. M. van Gulik,
F. J. ten Kate, and
J. J. van Lanschot,
“Histopathologic evaluation of an animal model for Barrett’s esophagus and adenocarcinoma of the distal esophagus,”
J. Surg. Res., 135 337
–344
(2006). https://doi.org/10.1016/j.jss.2006.04.023 0022-4804 Google Scholar
P. A. Constantinou,
B. C. Wilson,
T. Nicklee,
D. W. Hedley, and
S. Damaskinos,
“High-resolution confocal MACROscope with differential phase contrast, transmitted light, confocal fluorescence and hyperspectral capabilities for large-area tissue imaging,”
IEEE J. Sel. Top. Quantum Electron., 11 766
–777
(2005). https://doi.org/10.1109/JSTQE.2005.857708 1077-260X Google Scholar
M. E. Martin,
M. Wabuyele,
M. Panjehpour,
B. Overholt,
R. DeNovo,
S. kennel,
G. Cunningham, and
T. Vo-Dinh,
“An AOTF-based dual-modality hyperspectral imaging system (DMHIS) capable of simultaneous fluorescence and reflectance imaging,”
Med. Eng. Phys., 28 149
–155
(2006). https://doi.org/10.1016/j.medengphy.2005.04.022 1350-4533 Google Scholar
E. Lindsley,
E. S. Wachman, and
D. L. Farkas,
“The hyperspectral imaging endoscope: a new tool for in vivo cancer detection,”
Prog. Biomed. Opt. Imaging, 5 72
–82
(2004). Google Scholar
A. A. Ghazani,
J. A. Le,
J. Klostranec,
Q. Xiang,
R. DaCosta,
B. C. Wilson,
M. S. Tsao, and
W. C. W. Chan,
“High throughput quantification of protein expression of cancer antigens in tissue microarrays using quantum dot nanocrystals,”
Nano Lett., 6 2881
–2886
(2006). Google Scholar
C. E. Talley,
T. Huser,
C. W. Hollars,
L. Jusinski,
T. Laurence, and
S. Lane,
“Nanoparticle-based surface-enhanced Raman spectroscopy,”
Advances in Biophotonics, 210
–227 IOS Press, Netherlands
(2005). Google Scholar
|


