
|
|
1.IntroductionThe primary function of the National Institute of Health (NIH) is to reduce patient morbidity and mortality from disease through basic science and clinical research. In other words, going from the bench to bedside. This requires convincing physicians and scientists in the community that the basic work is, or will be, of value to the patient. This objective is difficult to achieve without well-validated, hypothesis-driven research. Validation or comparison with the appropriate gold standard is critical in achieving scientific credibility. With imaging technologies, for example, simply generating images and providing interpretation without the comparison to a gold standard is likely not to be considered sound science. Similarly, building an imaging technology without at least some data for a well-defined, clinically relevant application likely will not be greeted with much enthusiasm by the general community. These two important principles can often be forgotten when an excess amount of focus is placed on technological advances. Therefore, technology advances, which are often the only focus of many reviews, will only be touched on in this paper. In this paper, an invited presentation based on a recent NIH/SPIE workshop, I outline the very rapid transition of optical coherence tomography (OCT) from the bench to the patient. This occurred for a variety of reasons. These include a clear focus on hypothesis-driven research directed at specific clinical scenarios, an absolute understanding that validation with a gold standard was critical, and technological development. Without these three arms, obtaining funding and successfully publishing in high-profile clinical journals would have been difficult to achieve. OCT is analogous to ultrasound, measuring the backreflection of IR light rather than sound.1, 2, 3 It is based on low-coherence interferomtery and principles have been described elsewhere in great detail.1, 2, 3 Advantages of OCT include its high resolution (between 3 and ), its high dynamic range (in excess of ), and its video-rate imaging. OCT is also compact and portable and can be combined with a range of adjuvant techniques including polarization-sensitive imaging (PS-OCT) and elastography.4, 5, 6, 7 While initially applied to the transparent tissue of the eye,3, 8, 9 since 1994 our team has worked to develop the technology for imaging in nontransparent tissue.1, 2, 3 This has led to a wide range of applications, including those in cardiology, musculoskeletal disease, oncology, and surgical guidance.1, 10 This paper focuses on two specific clinical applications. The first is the identification of the unstable plaques that are responsible for most myocardial infarctions, with some mention of guiding stent placement. The second application is the early identification of osteoarthritis (OA) and monitoring its progression in patients with medial meniscus resections. The former was brought to the bedside primarily through a commercial route, while the latter was developed through NIH-funded research. Figure 1 illustrates the point that clinical science is not a simple progression of basic work to the bedside. After initial bench work is transitioned to the patient, bench research continues and clinical feedback is generated. For these reasons, advances continue to be made, resulting in improved techniques being utilized for the patient. Therefore, both bench and animal work, along with technology development, must continued funding for years to come. Fig. 1Some of the dynamics between bench and bedside research. After initial bench work is transitioned to the patient, bench research continues, and clinical feedback is generated. For these reasons, advances continue to be made, resulting in improved techniques being utilized for the patient. Therefore, both bench and animal work, along with technology development, require continued funding for years after initial patient studies.  2.Results2.1.Time Course of Advances in CardiologyOCT was initially pioneered for imaging transparent tissue, with the eye being the chief clinical area, as discussed in other papers in this special section.8, 9 However, at the time of the early initial nontransparent tissue bench work in 1994, the state of OCT was that it had been used essentially exclusively in transparent tissue with little success in nontransparent tissue.1, 8, 9 Its penetration was limited to a few hundred micrometers, which was of little clinical value. It was slow, imaging at approximately /image. In addition, it was not catheter or endoscope based, detection sensitivity was also limited, and few adjuvant approaches existed. The initial studies focused on demonstrating feasibility for characterizing coronary plaque, improving penetration, and micrometer-scale comparisons with histology for validation.3 The refinement of correlation techniques between images and histology on a micrometer scale, along with the generation of the appropriate histology of the proper quality, was instrumental in its publication in Circulation at this early stage and starting the progression to the bedside. This initial study not only demonstrated the ability to image in nontransparent tissue, it correlated imaging with plaque morphology, including demonstrating the capacity to identify thin intimal caps, distinguish lipid-from non-lipid-based tissue, and image through calcified regions. This took place in 1994 and 1995. The first dedicated NIH-funded grant was in 1996. The first commercialization occurred in 1998 and patient studies began11, 12, 13 in 2000 and 2001. Since the funding of the initial grant, the NIH has supported our group and others in continuing to move this field forward.14 2.2.Early Cardiovascular ImagingThe major applications of OCT in cardiology are in the identification of unstable plaque and the guidance of interventional procedures, in particular, stent placement. Its other potential applications include the management of carotid and intracranial atherosclerosis, pulmonary hypertension, and arrhythmias, particularly, atrial fibrillation that can be treated with pulmonary vein ablation. This paper historical in nature, first showing initial results demonstrating feasibility and then progressing to patient studies. The initial paper focused on the application of OCT to the identification of those plaques that lead to most myocardial infarctions (MIs, heart attacks) and this is focus of the next few paragraphs. Most MIs are caused by small, thin walled plaques, now currently referred to as thin-capped fibroatheromas (TFCAs), which are beyond the detection limit of currently available imaging modalities.15, 16 When these plaques rupture, they release thrombogenic factors into the blood stream. If the release is uncontrolled, a clot forms and the vessel occludes. This is the most prominent mechanism for acute coronary syndrome (ACS) such as MI. Among the initiating mechanisms most likely to lead to rupture mechanically weak plaque are hemodynamic stress (flow changes) or the rupture of angiogenic vessels within the plaque.8 The hypothesis tested by the first paper and part of the first NIH grant was that OCT could identify small, thin-walled lipid-filled plaques. The hypothesis was tested successfully. Figure 2 shows a direct comparison between an OCT image and the histopathology from the same initial publication. In this figure, normal tissue is on the right.3 Plaque is on the left. The arrow identifies a thin intimal layer over a hard plaque. This layer of intima measures less than in diameter. Therefore, OCT demonstrated an ability to identify thin intima at a resolution higher than any other clinical imaging technology. Fig. 2Direct comparison between an OCT image and the histopathology from the initial publication with normal tissue on the right and plaque on the left. The arrow identifies a thin intimal layer over a hard plaque. This layer of intima measures less than in diameter. Therefore, OCT demonstrated an ability to identify thin intima at a resolution higher than any other clinical imaging technology. Courtesy of Ref. 3.  Two early publications tested the hypothesis that the resolution of OCT was superior to that of the current clinical technology with the highest resolution, high-frequency ultrasound17, 18 (IVUS). This represented an important concept to hypothesis test to establish credibility in the medical community. In this case, while validation was performed with histopathology, it was also achieved with direct comparison with a widely accepted clinical imaging technology. In one example, an image from these publications shown in Fig. 3 , we see a direct comparison17 between OCT and IVUS (at ). We can see that the plaque is well delineated in the OCT image and that the imaging is completely through this near-occlusive plaque. In the first image in the upper left-hand corner, you can see a deep fissure near the medial border that is not detected by IVUS. Therefore, in these two studies, OCT demonstrated superior plaque characterization to IVUS. The band in the images represents birefringence and can be confused with a fissure if the polarization paddles are not moved during imaging, which is discussed later (or an alternative procedure for altering birefringence). Over this time period, acquisition rate was increased and the technology became catheter based. These advances became of interest to a much larger population than if clinical relevance had not previously been strongly suggested. Fig. 3Direct comparison between OCT and IVUS . Direct comparison between OCT and the current clinical technology with the highest resolution, IVUS, was performed. We can see that the plaques are well delineated in the OCT image and that the imaging is completely through this near-occlusive plaque. A band is noted in the image due to birefringence of the tissue, which, if the polarization state is not rotated, could be confused with a fissure. In the first image in the upper left-hand corner, you can see a deep fissure near the medial border that is not detected by IVUS. Therefore, in these two studies, OCT demonstrated superior plaque characterization to IVUS. Courtesy of Ref. 17.  OCT has now reached the bedside, where it is important that experienced clinical scientists skilled at performing blind and controlled clinical trials whose results ultimately effect patient management become involved. A 2006 Journal of Biomedical Optics publication from the group Massachuscetts General Hospital reviewed some of their work in this area, so this is only be peripherally discussed here.19 In vivo intracoronary OCT images have been generated in humans using a catheter-based system, but at this time, there is a paucity of double-blind controlled clinical trials generating data to predict long-term outcomes based on either plaque composition or the guidance of interventional procedures.11, 12, 13 This approach was first tested in animal models.20, 21 Most of the human studies were performed either by groups in collaboration with Lightlab Imaging or Massachusetts General Hospital. Several other groups have recently made contributions in this area.22, 23, 24 In Fig. 4 , imaging is done with a Lightlab imaging guide wire that is , as shown in the image and compared with angiography. It can be seen that the intima, media, and adventitia are defined at micron scale resolutions with OCT, but not by angiography.25 In Fig. 5 , in stent restenosis is noted in vivo in an image generated by a group led by Ishikawa and Schmitt.26 In Fig. 6 , a probable thin-capped fiberatheroma is identified in the OCT image where the thin wall is demarcated by the red arrow.26 Fig. 4OCT imaging directly compared with angiography. OCT imaging is done with the Lightlab imaging guide wire that is We can see that the intima, media, and adventitia are defined at micrometer-scale resolutions with OCT, but not by angiography. Courtesy of Dr. Grube, Siegburg (Heart Center, Seigburg) and J. Schmitt PhD (Lightlab Imaging).  Fig. 5In stent restenosis is noted in vivo in an image generated by a group led by Professor Ishikawa and Dr. Schmitt. Courtesy of Ref. 26, Professor Ishikawa (Kinki University), and Dr. Schmitt (LightlabImaging).  Fig. 6Probable thin-capped fiberatheroma is identified in the OCT image where the thin wall is demarcated by the red arrow (Color online only). Courtesy of Ref. 26, Professor Ishikawa (Kinki University), and Dr. Schmitt (LightlabImaging)  2.3.Current and Future Work in the Area of CardiologyA significant number of advances are required before OCT can be considered as a technology capable of risk stratifying patients based on coronary plaque characterization or stent placement. Some recent in vivo studies in the last year include studies evaluating the accuracy of OCT for characterizing plaque, comparisons with ultrasound, and use of attenuation coefficients to characterize plaque.22, 23, 24 For the technology to continue to progress to the bedside, for example, more data correlating OCT imaging with histology, particularly TFCAs, is needed. Furthermore, now that correlations have been established between OCT images and TCFAs,27, 28, 29 we must be able to identify those TCFAs, a small but clinically important percentage, that are most likely to lead to ACS. Some of this information will come from blinded clinical trials but more data with adjuvant techniques, in both basic and patient studies is required. One proposed adjuvant approach has been assessing macrophage concentration.30 It has already been reviewed extensively if macrophages represent a viable clinical marker, in addition to concerns as to whether OCT can effectively measure macrophage concentration.26, 30, 31, 32 Among the most important adjuvant techniques that may be useful in assessing the potential for diagnosing ACS is PS-OCT for assessing collagen concentration.33 This technique shows considerable promise in distinguishing TCFAs that progress to ACS. In addition, identification by OCT of angiogenesis and lipid types may be of additional benefit for subclassifying plaques. However, this data require more validation, including the use of histological techniques, immunohistochemistry, and high-performance liquid chromatography (HPLC). Besides advances in characterization, techniques that enable the ability of OCT to be applied in vivo include the critical need for robust catheters along with techniques to overcome reduced imaging through blood. The latter includes the use of Fourier-based techniques as well as the potential of index matching, although limitations exist for penetration on the former.34, 35, 36 2.4.OCT for Assessing OAIn this section, we discuss the application of OCT to OA, one of the musculoskeletal diseases for which OCT appears to have the greatest potential. OA is the largest cause of morbidity in the United States, effecting in excess of 45 million Americans, and the incidence continues to increase.37 Currently a variety of therapeutics are available that could potentially treat OA. Among the therapeutic techniques that could be potentially beneficial in patients with OA include chondroprotective agents, changing the joint kinetics, penetration of the subchondral plate, tissue transplantation, mesencymal stem cell transplantation, and chondocyte transfer.1 While cartilage breakdown in animals can be assessed postmortem, there is no method in humans for effectively monitoring changes during therapy or after interventions. Therefore, a true clinical necessity exists for an imaging technology to effectively assess therapeutic responses. The first demonstration of OCT imaging of OA was in 1997. The first demonstration of polarization-sensitive imaging identifying collagen breakdown in cartilage was in 2001, the first NIH-dedicated grant was in 1997, and the first patient was performed on in an academic setting in 2001 during total knee replacement.38 In 2006, OCT imaging was performed arthroscopically in vivo in humans in patients undergoing meniscal repair. As stated, we began OCT imaging of cartilage in vitro in 1997. Figure 7 shows an OCT image and the corresponding histology of patella cartilage from the original publication.39 The top image is normal cartilage and the bottom is histology. In this image, c is the cartilage, b is bone, and the red arrows identify the bone/cartilage interface. We can see that the bone cartilage interface is defined at micrometer-scale resolutions. The green arrows show polarization sensitivity, which will be discussed in detail in the following sections. Fig. 7OCT image and the corresponding histology of patella cartilage from the original publication demonstrating feasibility. The top image is normal cartilage and the bottom is histology. In this image, c is the cartilage, b is bone, and the red arrows identify the bone/cartilage interface. We can see that the bone cartilage interface is defined at micrometer-scale resolutions. The green arrows show polarization sensitivity, which is discussed in detail in the following sections. Courtesy of Ref. 49 (Color online only).  In Fig. 8 , severe OA is noted both in the OCT image and the histopathology.39 In this figure of a severe osteoarthritic hip on the left, the cartilage is thin and the nb indicates new bone growth with complete destruction of the bone-cartilage interface. The f shows the fibrous band across the surface, which is pathologic. The homogeneity is lost compared with Fig. 7. Fig. 8Severe OA is noted both in the OCT image and the histopathology. On the left the cartilage is thin and the nb indicates new bone growth with complete destruction of the bone-cartilage interface. The f shows the fibrous band across the surface, which is pathologic. The homogeneity is lost compared with Fig. 7. Courtesy of Ref. 39. 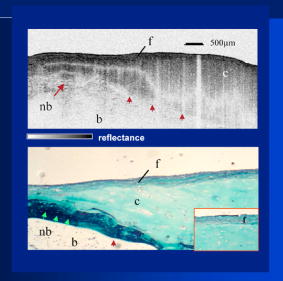 In vivo imaging has also been performed, initially using a handheld probe and later with an OCT arthroscope.38 The handheld probe studies were done in patients prior to joint replacement so that histopathology could be obtained after imaging for correlation. An example series of images is shown in Fig. 9 . In the lower image on the left, we see a banding pattern representing normal cartilage (birefringence) and on the right we see diseased cartilage were the tissue is less dense and no banding pattern exists. On the upper left, relatively normal cartilage is noted although the bands are not as smooth the lower image. On the upper right, severely diseased cartilage is imaged in vivo. Fig. 9Along with Figs. 10 and 11, in vivo imaging is performed of knee joints prior to joint replacement. In vivo imaging is performed using a handheld probe/scanner. These studies done prior to joint replacement enabled correlations with histopathology. In the lower image on the left, we see a banding pattern representing normal cartilage (birefringence) and on the right we see diseased cartilage were the tissue is less dense and no banding pattern exists. On the upper left, relatively normal cartilage is noted although the bands are not as smooth in the lower image. On the upper right, severely diseased cartilage is imaged in vivo. Courtesy of Ref. 38.  Fig. 10Mildly diseased cartilage obtained in vivo shows drop-out areas in the OCT image identified by the red arrows. On the histopathology, the drop out areas in the OCT images correspond to chondrocyte hyperplasia, an indicator of OA. Courtesy of Ref. 38 (Color online only). 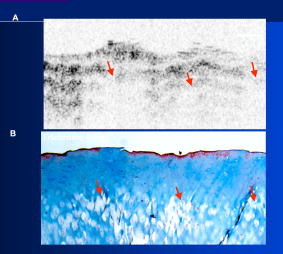 Fig. 11Severely diseased human knee cartilage imaged in vivo. On the right, the cartilage is completely gone, and on the left, we see that the cartilage has lost its homogeneity with dense patches noted. This is confirmed by the histopathology, which is grossly abnormal. Courtesy of Ref. 38.  In Fig. 10 , mildly diseased cartilage obtained in vivo is shown where drop-out areas are noted in the OCT image identified by the red arrows.38 On the histopathology, the drop out areas in the OCT images correspond to chondrocyte hyperplasia. In Fig. 11 , a severely diseased joint is seen in vivo.38 On the right, the cartilage is completely gone, and on the left, we see that the cartilage has lost its heterogeneity with dense patches noted. This is confirmed by the histopathology, which is grossly abnormal. In addition to in vivo studies using a handheld probe, arthroscopic studies have also been performed and these blinded clinical trials are continuing to recruit patients. These include patients undergoing menisectomy and microawl procedures. The protocol for the menisectomy study is shown in Table 1 . The patients receive an initial magnetic resonance imagining (MRI) prior to arthroscopy and then OCT imaging during the menisectomy. They are then followed for by MRI. This is done to ascertain if lesions identified by OCT, but not by MRI or arthroscopy, ultimately develop signs of OA by MRI at . This and the microawl study are double-blind controlled clinical trials looking at the predictive power of OCT imaging. 2.5.Technology DevelopmentsAs stated, this paper does not focus on technology development. However, a brief mention of this topic is appropriate. Some technologic advances were developed to meet a clinical need, such as catheters and faster delays lines. Some were adopted from other fields, such as certain source and delay line technologies. However, other technologies were novel to OCT research, including ultra-high-resolution sources, certain delay lines (i.e., CAMs), free-space optical coupling on OCT rotational catheters, and swept source OCT advances.21, 40, 41 2.6.Return to the BenchContinued basic studies, with both in vitro tissue and with animal models are being performed currently in parallel with in vivo human studies to advance the technology. During the conference that generated this publication, five areas of new basic research were discussed. These were single-detector PS-OCT imaging, ultrasound reduction of multiple scattering (improve imaging penetration), the use of quantum mechanical dispersion to characterize tissue composition, classical/quantum mechanical noise in OCT systems, and guiding tissue engineering of cartilage. Only the first is discussed due to space limitations. Other advances in the field include the development of OCT probes, Fourier-based OCT, high-resolution OCT, second-harmonic-generation OCT, and OCT elastography. 7, 36, 42, 43, 44, 45, 46, 47, 48 We have been studying single-detector PS-OCT in both cardiology and musculoskeletal disease for over a decade, feeling it is one of the most important adjuvant OCT techniques for diagnosis. OCT imaging of most tissue is not sensitive to the polarization state of the incident light. This is not true for highly organized structure that can exhibit significant birefringence. Organized collagen, which is birefringent, plays an important role both in the pathophysiology of unstable plaque and in OA. Alterations in its concentration are among the earliest changes in both disorders. Polarization imaging can therefore, by assessing collagen organization, be a more sensitive method than structural imaging for identifying pathology. Collagen’s highly organized structure has as its base unit tropocollagen, a triple helix, and is progressively organized into more and more organized layers. In OA, collagen breaks down before cartilage begins to thin. Therefore, it is a very early marker. Similarly, loss of organized collagen in intimal caps of plaque can be a sign of instability that may lead to rupture and MI. In our studies of these pathophysiological processes, we validated collagen organization with either picrosirus or scanning electron electron microscopy (SEM). Unfortunately, papers in the literature almost exclusively use standard hematoxylin and eosin or trichrome blue to “quantify” collagen. Figure 12 illustrates the importance of using the appropriate validation technique to assess collagen.26 In this figure, we see picrosirus-stained sections where the bright areas show organized collagen. On the bottom left and right we see the OCT images with two different polarization states. The birefringent changes in the OCT images correlate with the picrosirius. The trichrome, on the other hand, is relatively homogenous and therefore of little use. This emphasizes the importance of using the appropriate technique for validation, a major theme of this paper.26 Fig. 12Importance of using the appropriate validation technique to assess collagen. Top right picrosirus-stained sections, where the bright areas show organized collagen. Bottom left and right, the OCT images with two different polarization states. The birefringent changes in the OCT images correlate with the picrosirius. The trichrome, on the other hand, is relatively homogenous and therefore of little use. This emphasizes the importance of using the appropriate technique for validation, as trichrome-stained samples have been used by other groups to “quantify” collagen. Courtesy of Ref. 31.  Single-detector PS-OCT, the focus of our group, enables imaging to be performed in real time and polarization sensitivity to be assessed off the screen.4, 33, 38, 49 No complex data analysis is required, and we have demonstrated the technique can be performed in real time, in vivo in humans. The alternative techniques are based on dual-detector OCT (dual channel), used by many groups.1 Dual-detector techniques range from measurement of phase retardation to the Müller matrix.50, 51, 52, 53, 54 The use of dual detectors enables the measurement of the absolute intensity and relative phase of orthogonal polarization states arriving at the detector. This by no means suggests it detects absolute values of the sample. On the other hand, the single-detector approach measures relative changes in polarization with changes in polarization of the incident light, which has its advantages. The first is that OCT systems are not designed to measure absolute values, particularly since the polarization state of backreflected light from the sample (and the reference arm) can be altered with fiber and optical component movement. Attempts at assessing tissue polarization states (and therefore collagen) with the dual-detector approach in vivo have for the most part failed in part because the polarization state incident on the tissue changes as the catheter/endoscope bends or stretches. This is because bends in the imaging device as it moves through the imaging site result in an unpredictable birefringence that is asymmetric through the rotation of the catheter. Therefore, measurements of the absolute polarization state at 0 and , for example, yield different values, even if the tissue composition is homogeneous as the measurements are relative rather than absolute. This comparison is discussed in detail elsewhere1, 55 and is shown in Fig. 13 . By using a single detector and measuring the change in backreflected polarization with change in the polarization of the source (or reference arm), the measurements become independent of birefringence changes resulting from the fiber optics. This can be measured quantitatively from A-scans or qualitatively from the B-scan. Single-frame data is shown in the following. The third reason for using the single-detector approach is that the system is less expensive, which is important for routine clinical use. Fourth, the changes in the image of the single-detector system are easy to interpret on the screen in real time (change in backscattering intensity as the polarization of the incident light is changed). Current dual-detector approaches do not obtain birefringence data in real time, with the exception of the phase retardation technique of some Lightlab systems. With the Lightlab system though the “birefringence” image is not actually a direct measure of birefringence. Instead, it is calculated as where is a constant, and and are the intensity values ( numbers) from the orthogonal polarization channels A and B. The color is mapped into a red-blue color scale.Fig. 13Dual-detector OCT with and without catheter bending. Images of Achilles’ tendon in dual-detector mode with the catheter bent (left) and straight (right). When the catheter is bent, the incident light on the tissue changes its polarization, depending on which portion of the tissue is examined. This difference in intensities shows that the bending of the catheter could lead to the erroneous interpretation of birefringence data with the dual-detector approach. Courtesy of Ref. 55.  With more sophisticated techniques, dual-detector techniques, to generate one B-scan via a Müller matrix of the tissue, up to 16 polarization images may be required to be analyzed. The question remains whether any clinically significant information can be gained from either having the absolute value or the optical axis above the relative changes seen with single detector. It can for illustrative purposes be viewed as analogous to a mass on a chest x-ray or left ventricular dysfunction on an echocardiograph (ECHO). In both cases, diagnosis is generally made from the image, and neither densitometry is required on chest x-rays nor is absolute velocity necessary on the ECHO. Fifth, dual-detector approaches generally do not provide data as a function of depth as opposed to a single detector. Finally, in the dual-detector system, multiple polarization filters are integrated into the system, leading to a reduction of power incident on the sample. Since portable sources, such as quantum-well devices or doped fibers, have limited power, the addition of these filters into the OCT system may result in power levels dropping below what is necessary for in vivo use. I will begin demonstrating single-detector PS-OCT imaging of human cartilage49 in Fig. 14 . On the left, is a series of OCT images where the polarization state is rotated, resulting in a smooth band moving steadily through the tissue due to birefringence. In the upper right, we see relatively normal cartilage by . In the lower right, a picrosirus-stained section is seen, showing a large amount of organized collagen type II (bright, yellow). Figure 15 shows mildly diseased cartilage.49 In the OCT image there is a band that slowly moves with changes in polarization state of incident light, consistent with a birefringent sample. However, the band is no longer smooth, as in Fig. 14. In the picrosirus sections, the birefringence is no longer homogeneous. Figure 16 is probably the most important image. In the lower right we see in the picrosirus-stained section with no evidence of organized collagen.49 In the OCT images, no evidence of polarization sensitivity is noted, yet the section of cartilage stained by in the upper right demonstrates that it is over in depth. Figure 17 is provided for comparison of biceps tendon, which has an extremely high concentration of collagen and represents a strongly birefringent tissue.56 The banding pattern that results from the high birefringence is clearly noted. This is confirmed from the picrosirus section, were the section is bright and yellow, consistent57, 58 with high concentrations of collagen type II. Fig. 14Single-detector PS-OCT imaging of human cartilage. On the left, a series of OCT images where the polarization state is rotated, resulting in a smooth band moving steadily through the tissue due to birefringence. In the upper right, relatively normal cartilage by . In the lower right, a picrosirus-stained section showing a large amount of organized collagen type I (bright, yellow). Courtesy of Ref. 49 (Color online only).  Fig. 15Mildly diseased cartilage. In the OCT image, there is a band that slowly moves with changes in the polarization state of incident light, consistent with a birefringence sample. However, the band is no longer smooth, as in Fig. 14. In the picrosirus sections, the birefringence is no longer homogeneous, with drop out areas shown by the arrows. Courtesy of Ref. 49.  Fig. 16Probably the most important image. In the lower right, the picrosirus-stained section shows no evidence of organized collagen. In the OCT images, no evidence of polarization sensitivity is noted, yet the section of cartilage stained by in the upper right demonstrates that it is over in depth and relatively homogeneous. Therefore, OCT can identify early OA prior to significant cartilage thinning. Courtesy of Ref. 49.  Fig. 17Example of a strongly birefringent tissue, biceps tendon, which has an extremely high concentration of collagen and represents a strongly birefringent tissue. The banding pattern that results from the high birefringence is clearly noted. This is confirmed from the picrosirus-stained section, were the section is bright and yellow, consistent with high concentrations of collagen type I. Courtesy of Ref. 56 (Color online only).  Assessing collagen concentration is also important in assessing plaque vulnerability, as shown in Fig. 18 . The accompanying image demonstrates single-detector PS-OCT in a minimally diseased artery where a faster rate of band movement, caused by movement of the polarization paddles, means higher birefringence. In coronary arteries, lack of birefringence suggests minimally organized collagen and plaque vulnerability.33 The top two upper-left images show a coronary artery imaged at two different polarization states. The backscattering intensity changes with changing polarization of incident light in most of the image. However, the red arrow shows an area that lacks birefringence (polarization does not change) that on the picrosirus-stained section represents an area depleted in collagen. As this area is thin intima overlying a lipid-laden region, it is vulnerable to rupture. If we look at the corresponding trichrome section, we see that the collagen-depleted area is predominately acellular, with the exception of deeper areas within the plaque, emphasizing that it is not inflamed and raising the question as to whether inflammation is a good marker for unstable plaque. The issue of the relevance of inflammatory cells in ACS, as well as whether OCT can identify macrophages is discussed elsewhere.1, 8, 31, 32 The approach had a statistically significant high positive and negative predictive value. We are now exploring using the fast Fourier transform (FFT) on A-scans to distinguish different collagen types.57 Fig. 18Assessing collagen is also important in assessing plaque instability. The top two upper-left images show a coronary artery imaged at two different polarization states. The backscattering intensity changes with changing polarization of incident light in most of the image. However, the red arrow shows an area that lacks birefringence (polarization does not change) that on the picrosirus-stained section represents an area depleted in collagen. As this area is thin intima overlying a lipid-laden region, it is vulnerable to rupture. If we look at the corresponding trichrome section, we see that the collagen-depleted area is predominately acellular, with the exception of deeper areas within the plaque, emphasizing that it is not inflamed and raising the question as to whether inflammation is a good marker for unstable plaque. The issue of the relevance of inflammatory cells in ACS, as well as whether OCT can identify macrophages is discussed elsewhere.1, 31  Table 1OCT menisectomy study. In addition to in vivo studies using a handheld probe, arthroscopic studies have also been performed and these blinded clinical trials are continuing to recruit patients. These include patients undergoing menisectomy and microawl procedures. The protocol for the menisectomy study is shown here. The patients receive an initial MRI prior to arthroscopy and then OCT imaging during the menisectomy. They are then followed for 2yr by MRI. This is done to ascertain if lesions identified by OCT, but not by MRI or arthroscopy, ultimately develop signs of OA by MRI at 2yr . This and the microawl study are double-blind controlled clinical trials looking at the predictive power of OCT imaging on the ultimate outcome.
3.LimitationsThe most significant limitation with OCT is penetration. Its penetration is generally between 2 and in most scattering tissue. We have used a parallel ultrasound beam to further improve penetration.59 This is particularly a problem when imaging through blood, where flushing or index matching may be of use, and with swept source OCT, which has a higher level of multiple scattering. Additional limitations lie more in the requirement for more hypothesis-based research and a better understanding of underlying OCT theory. 4.ConclusionThis paper focused on the topic of the original conference, the transition of research from the bench to the bedside. Specifically, the discussion focused on OCT imaging in the cardiovascular and musculoskeletal system. OCT has transitioned rapidly from the bench to the bedside. The paper emphasizes three important factors that has led to its fast transition. These are hypothesis-driven research, validation by the appropriate gold standard [e.g., histological special stains, scanning electron microscopy, immunohistochemistry, high-performance liquid chromatography (HLPC), high-frequency ultrasound], and technology development. It is important to note that most of the technology development was directed at addressing specific clinical objectives as opposed to developing technology then later searching for an application in which it was applicable. Significant advances are required before the technology becomes a routine clinical imaging system in either the cardiovascular or musculoskeletal system. First, randomized clinical trails that go beyond observation studies are necessary to establish credibility among both physicians and regulatory agencies that a benefit is gained above current imaging modalities. Second, robust, controllable catheters and arthroscopes are required with optimized cross-sectional diameters that provide the physician ease of use. Third, more hypothesis-driven basic studies with appropriate validation are required utilizing either in vitro samples or animal studies. Fourth, in the cardiovascular system, methods to overcome reduced penetration through blood are necessary, including index matching and higher data acquisition rates. In conclusion, OCT has transitioned rapidly from the bench to the bedside. While the technology has demonstrated tremendous potential, more scientifically sound future bench and bedside research is necessary before it can be accepted as a routine clinical imaging modality in these fields. AcknowledgmentsThe data presented represents the efforts of a large number of individuals whose contributions are acknowled in the reference section. Dr. Brezinski’s work is currently funded by National Institute of Health Grants R01 AR44812, R01 HL55686, R01 EB02638/HL63953, R01 AR46996 and R01 EB000419. ReferencesM. E. Brezinski, Optical Coherence Tomography: Principle and Practice, Academic Press/ Elsevier, Burlington, MA
(2006). Google Scholar
D. Huang,
E. A. Swanson,
“Optical coherence tomography,”
Science, 254 1178
–1181
(1991). https://doi.org/10.1126/science.1957169 0036-8075 Google Scholar
M. E. Brezinski,
G. J. Tearney,
“Optical coherence tomography for optical biopsy: properties and demonstration of vascular pathology,”
Circulation, 93 1206
–1213
(1996). 0009-7322 Google Scholar
W. Drexler,
D. Stamper,
“Correlation of collagen organization with polarization sensitive imaging in cartilage: implications for osteoarthritis,”
J. Rheumatol., 28 1311
–1318
(2001). 0315-162X Google Scholar
M. R. Hee,
D. Huang,
“Polarization sensitive low coherence reflectometer for birefringence characterization and ranging,”
J. Opt. Soc. Am. B, 9 903
–908
(1992). 0740-3224 Google Scholar
J. Rogowska,
J. G. Fujimoto, and
M. E. Brezinski,
“Optical coherence tomographic elastography technique for measuring deformation and strain of atherosclerotic tissues,”
Heart, 90 556
–562
(2004). 1355-6037 Google Scholar
J. Rogowska,
N. Patel,
“Quantitative optical coherence tomography elastography: method for assessing arterial mechanical properties,”
Br. J. Radiol., 79 707
–711
(2006). https://doi.org/10.1259/bjr/22522280 0007-1285 Google Scholar
D. Huang,
J. Wang,
“Micron-resolution ranging of cornea anterior chamber by optical reflectometry,”
Lasers Surg. Med., 11 419
–425
(1991). https://doi.org/10.1002/lsm.1900110506 0196-8092 Google Scholar
J. S. Schuman,
C. A. Puliafito, Optical Coherence Tomography of Ocular Diseases, 2nd ed.Slack Inc., Thorofare, NJ
(2004). Google Scholar
M. E. Brezinski and
J. G. Fujimoto,
“Optical coherence tomography: high resolution imaging in nontransparent tissue,”
IEEE J. Quantum Electron., 5 1185
–1192
(1999). https://doi.org/10.1109/2944.796345 0018-9197 Google Scholar
H. Yabushita,
B. E. Bouma,
“Characterization of human atherosclerosis by optical coherence tomography,”
Circulation, 106 1640
–1605
(2002). https://doi.org/10.1161/01.CIR.0000029927.92825.F6 0009-7322 Google Scholar
G. J. Tearney,
H. Yabushita,
“Quantification of macrophage content in atherosclerotic plaques by optical coherence tomography,”
Circulation, 107
(1), 13
–119
(2003). https://doi.org/10.1161/01.CIR.0000044384.41037.43 0009-7322 Google Scholar
R. Virmani,
P. Burke,
“Pathology of unstable plaque,”
Prog. Cardiovasc. Dis., 44 349
–356
(2002). https://doi.org/10.1053/pcad.2002.122475 0033-0620 Google Scholar
F. D. Kolodgie,
A. P. Burke,
“The thin cap fibroatheroma: a type of vulnerable plaque,”
Curr. Opin. Cardiol., 16 285
–292
(2001). 0268-4705 Google Scholar
P. Patwari,
N. J. Weissman,
“Assessment of coronary plaque with optical coherence tomography and high frequency ultrasound,”
Am. J. Cardiol., 85 641
–644
(2000). https://doi.org/10.1016/S0002-9149(99)00825-5 0002-9149 Google Scholar
M. E. Brezinski,
G. J. Tearney,
“Assessing atherosclerotic plaque morphology: comparison of optical coherence tomography and high frequency intravascular ultrasound,”
Heart, 77 397
–404
(1997). 1355-6037 Google Scholar
G. J. Tearney,
I. K. Jang, and
B. E. Bouma,
“Optical coherence tomography for imaging the vulnerable plaque,”
J. Biomed. Opt., 11 021002-1-10
(2006). https://doi.org/10.1117/1.2192697 1083-3668 Google Scholar
J. G. Fujimoto,
S. A. Boppart,
“High resolution in vivo intra-arterial imaging with optical coherence tomography,”
Heart, 82 128
–133
(1999). 1355-6037 Google Scholar
G. J. Tearney,
M. E. Brezinski,
“In vivo endoscopic optical biopsy with optical coherence tomography,”
Science, 276 2037
–2039
(1997). https://doi.org/10.1126/science.276.5321.2037 0036-8075 Google Scholar
T. Kume,
T. Akaska,
T. Kawamoto,
“Assessment of coronary arterial plaque by optical coherence tomography,”
Am. J. Cardiol., 97 1172
–1178
(2005). https://doi.org/10.1016/j.amjcard.2005.11.035 0002-9149 Google Scholar
F. J. van der Meer,
D. J. Faber,
D. M. Baraznji Sassoon,
M. C. Aalders,
G. Pasterkamp, and
T. G. van Leeuwen,
“Localized measurement of optical attenuation coefficients of atherosclerotic plaque constituents by quantitative optical coherence tomography,”
IEEE Trans. Med. Imaging, 24 1369
–1376
(2005). https://doi.org/10.1109/TMI.2005.854297 0278-0062 Google Scholar
O. Manfrini,
E. Mont,
O. Leone,
“Sources of error and interpretation of plaque morphology by optical coherence tomography,”
Am. J. Cardiol., 98 156
–160
(2006). https://doi.org/10.1016/j.amjcard.2006.01.097 0002-9149 Google Scholar
J. Schmitt, Courtesy Dr. Grube (Heart Center, Seigburg), Google Scholar
M. E. Brezinski,
“Optical coherence tomography for identifying unstable coronary plaque,”
Int. J. Cardiol., 107 154
–165
(2006). https://doi.org/10.1016/j.ijcard.2005.07.066 0167-5273 Google Scholar
J. A. Goldstein,
D. Demetriou,
“Multiple complex coronary plaques in patients with acute myocardial infarction,”
N. Engl. J. Med., 343 915
–922
(2000). https://doi.org/10.1056/NEJM200009283431303 0028-4793 Google Scholar
A. P. Burke,
A. Farb,
“Coronary risk factors and plaque morphology in men with coronary disease who died suddenly,”
N. Engl. J. Med., 336 1276
–1282
(1997). https://doi.org/10.1056/NEJM199705013361802 0028-4793 Google Scholar
R. Virmani,
A. P. Burke,
“Pathology of unstable plaque,”
Prog. Cardiovasc. Dis., 44
(3), 349
–356
(2002). https://doi.org/10.1053/pcad.2002.122475 0033-0620 Google Scholar
B. D. MacNeil,
I. K. Jang,
“Focal and multi-focal plaque macrophage distributions in patients with acute and stable presentations of coronary artery disease,”
J. Am. Coll. Cardiol., 44 972
–979
(2004). https://doi.org/10.1016/j.jacc.2004.05.066 0735-1097 Google Scholar
D. Stamper,
N. J., and
M. E. Brezinski,
“Plaque characterization with optical coherence tomography,”
J. Am. Coll. Cardiol., 47 C69
–C79
(2006). https://doi.org/10.1016/j.jacc.2005.10.067 0735-1097 Google Scholar
A. Buffo,
L. M. Biasucci, and
G. Liuzzo,
“Widespread coronary inflammation in unstable angina,”
N. Engl. J. Med., 347 5
–12
(2002). https://doi.org/10.1056/NEJMoa012295 0028-4793 Google Scholar
S. Giattina,
S. D. Courtney,
“Assessment of coronary plaque collagen with polarization sensitive optical coherence tomography (PS-OCT),”
Int. J. Cardiol., 107 400
–409
(2006). https://doi.org/10.1016/j.ijcard.2005.11.036 0167-5273 Google Scholar
M. Brezinski,
K. Saunders,
“Index matching to improve OCT imaging through blood,”
Circulation, 103 1999
–2003
(2001). 0009-7322 Google Scholar
M. A. Choma,
M. V. Sarunic,
“Sensitivity advantage of swept source and Fourier domain optical coherence tomography,”
Opt. Express, 11
(18), 2183
–2189
(2003). 1094-4087 Google Scholar
B. Liu and
M. E. Brezinski,
“Theoretical and practical considerations on detection performance of time domain, Fourier domain, and swept source optical coherence tomography,”
J. Biomed. Opt., 12 044007
(2007). https://doi.org/10.1117/1.2753410 1083-3668 Google Scholar
X. Li,
S. Martin,
“High-resolution optical coherence tomographic imaging of osteoarthritic cartilage during open knee surgery,”
Arthritis Res. Ther., 7
(2), R318
–323
(2005). https://doi.org/10.1186/ar1491 1478-6354 Google Scholar
J. Herrmann,
C. Pitris,
“High resolution imaging of normal and osteoarthritic cartilage with optical coherence tomography,”
J. Rheumatol., 26
(3), 627
–635
(1999). 0315-162X Google Scholar
S. R. Chinn,
E. A. Swanson,
“Optical coherence tomography using a frequency-tunable optical source,”
Opt. Lett., 22 340
–342
(1997). 0146-9592 Google Scholar
E. A. Swanson, Google Scholar
S. A. Boppart,
B. E. Bouma,
“In vivo cellular optical coherence tomography imaging,”
Nat. Med., 4
(7), 861
–865
(1998). 1078-8956 Google Scholar
S. R. Chinn,
E. A. Swanson, and
J. G. Fujimoto,
“Optical coherence tomography using a frequency-tunable optical source,”
Opt. Lett., 22
(5), 340
–342
(1997). 0146-9592 Google Scholar
B. E. Applegate,
C. Yang,
A. H. Rollins, and
J. A. Izatt,
“Polarization resolved second harmonic generation optical coherence tomography,”
Opt. Lett., 29 2252
–2254
(2004). https://doi.org/10.1364/OL.29.002252 0146-9592 Google Scholar
W. Drexler,
“Ultra-high resolution optical coherence tomography,”
J. Biomed. Opt., 9 47
–74
(2004). https://doi.org/10.1117/1.1629679 1083-3668 Google Scholar
M. E. Brezinski,
“Quantum mechanical noise in OCT,”
Google Scholar
K. Rao,
M. A. Choma,
S. Yandanfar,
“Molecular contrast in optical coherence tomography by use of pump,”
Opt. Lett., 28 340
–342
(2003). https://doi.org/10.1038/425340a 0146-9592 Google Scholar
J. Rogowska,
N. A. Patel,
J. G. Fujimoto,
M. E. Brezinski,
“Optical coherence tomographic elastography technique for measuring deformation and strain of atherosclerotic tissues,”
Heart, 90
(5), 556
–62
(2004). 1355-6037 Google Scholar
W. Drexler,
D. Stamper,
“Correlation of collagen organization with polarization sensitive imaging in cartilage: implications for osteoarthritis,”
Opt. Lett., 28 1311
–1318
(2001). 0146-9592 Google Scholar
M. J. Everett,
K. Schoenenberger,
B. W. Colston, and
L. B. DaSilva,
“Birefringence characterization of biological tissue by use of optical coherence tomography,”
Opt. Lett., 23 228
–230
(1998). 0146-9592 Google Scholar
C. E. Saxer,
J. F. de Boer,
B. H. Park,
“High speed fiber based polarization sensitive optical coherence tomography of in vivo human skin,”
Opt. Lett., 25 1355
–1357
(2000). https://doi.org/10.1364/OL.25.001355 0146-9592 Google Scholar
S. Jiao,
W. Yu,
G. Stoica, and
L. V. Wang,
“Optical fiber based Mueller optical coherence tomography,”
Opt. Lett., 28 1206
–1208
(2003). https://doi.org/10.1364/OL.28.001206 0146-9592 Google Scholar
S. Guo,
J. Zhang,
L. Wang,
“Depth resolved birefringence and differential optical axis orientation measurements with fiber based polarization sensitive optical coherence tomography,”
Opt. Lett., 29 2025
–2027
(2004). https://doi.org/10.1364/OL.29.002025 0146-9592 Google Scholar
H. E. Park,
M. C. Pierce,
B. Cense, and
J. F. de Boer,
“Jones matrix analysis for a polarization sensitive optical coherence tomography system using fiber optic components,”
Opt. Lett., 29 2512
–2514
(2004). https://doi.org/10.1364/OL.29.002512 0146-9592 Google Scholar
K. Zheng and
M. E. Brezinski,
“Comparison of single and dual detector OCT with and without catheter bending,”
Google Scholar
S. D. Martin,
N. A. Patel,
“New technology for assessing microstructural components of tendons and ligaments,”
Int. Orthop., 27
(3), 84
–189
(2003). 0341-2695 Google Scholar
B. Liu,
M. Harman,
“Characterizing of tissue microstructure with single-detector polarization-sensitive optical coherence tomography,”
Appl. Opt., 45 4464
–4479
(2006). https://doi.org/10.1364/AO.45.004464 0003-6935 Google Scholar
L. C. Junqueira,
M. Figueiredo,
“A study on human osteosarcoma collagen by the histochemical picrosirus-polarization method,”
J. Pathol., 148 189
–196
(1986). 0022-3417 Google Scholar
L. C. Junqueira,
G. Bignolas,
“Picrosirus staining plus polarization microscopy, a specific method for collagen detection,”
Histochem. J., 11 447
–455
(1979). https://doi.org/10.1007/BF01002772 0018-2214 Google Scholar
J. Schenck and
M. E. Brezinski,
“Ultrasound induced improvement in optical coherence tomography,”
Proc. Natl. Acad. Sci. U.S.A., 99 9761
–9764
(2002). https://doi.org/10.1073/pnas.142155899 0027-8424 Google Scholar
|
||||||||||||||||||||||||||||||||


