

|
|
1.IntroductionNear-infrared (NIR) diffuse optical spectroscopy (DOS) and tomography (DOT) have been employed quantitatively by several groups to characterize breast cancers. 1, 2, 3, 4, 5, 6, 7, 8, 9, 10 In clinical investigations, DOS and DOT have revealed tumor contrast in total hemoglobin concentration, 1, 4, 6, 7, 8, 9, 11, 12, 13, 14, 15, 16, 17 hemoglobin oxygen saturation, 4, 11, 12, 14, 17 water and lipid concentration,14, 17, 18 and tissue scattering.2, 16, 18 Furthermore, DOS and DOT have also shown promise for therapeutic monitoring of breast cancer patients. 14, 15, 16, 17, 19, 20 Studies during neoadjuvant chemotherapy (chemotherapy prior to surgery) have shown that tumor metabolic response can precede anatomical changes (e.g., size) accessible to traditional imaging and clinical palpation methods.21 Thus, new diagnostic methodologies focusing on physiological properties of the tumor, for example, hemodynamic response, may offer benefits beyond those of traditional imaging and palpation during the early course of chemotherapy. In a recent case study, for example, Jakubowski 14 used DOS and observed significant changes in total hemoglobin concentration and water fraction within 5 days of the start of treatment. Another important hemodynamic parameter is blood flow. Measurements of blood flow provide insight about oxygen delivery and the clearance of metabolic by-products, complementary to information about tissue chromophores and scattering available to DOS. In vivo diffuse optical measurement of blood flow has recently been explored using diffuse correlation spectroscopy 22, 23, 24, 25 (DCS) in brain, 26, 27, 28, 29, 30, 31 muscle,32, 33 and in the tumor tissues 34, 35, 36, 37 of animal models and humans. A recent DCS study in human breast tumors37 showed increased blood flow contrast in tumor regions relative to adjacent healthy tissue, consistent with results from ultrasound,38 positron emission tomography39 (PET), and magnetic resonance imaging40 (MRI). In some cases, the DCS technique has been validated33, 34 with ultrasound and MRI, and in a few cases the therapy monitoring capability of hybrid DCS/DOS instruments has been demonstrated.34, 35, 36 The latter instruments are particularly exciting because, in principle, the oxygen delivery information derived from blood flow can be used in combination with blood oxygenation measurements to estimate the metabolic rate of oxygen consumption in tissue. In this paper, we describe a case study of a breast cancer patient during the early stages of neoadjuvant chemotherapy. In contrast to previous optical measurements of breast tumors, the current work used both DOS and DCS in the same patient to derive information about tumor chromophores, tumor scattering, and tumor blood flow. Significant changes in tissue hemodynamic parameters were detected as early as 3 days post-therapy. To date, several studies have focused on measurements of parameters related to cancer metabolism and blood flow after few cycles of chemotherapy, i.e., after several weeks. 39, 41, 42, 43, 44, 45 The present study has focused on daily measurements within the first week. The observations of blood flow changes are the first of their kind during early stage chemotherapy. The combined DOS/DCS information provides a more complete picture of tumor tissue hemodynamics and enables us to construct new indices reflecting changes in oxygen metabolism that require knowledge about flow and oxy- and/or deoxyhemoglobin concentrations. 2.Materials and Methods2.1.ProtocolThe patient measurements were conducted at the Beckman Laser Institute of the University of California, Irvine (UCI), and were approved by the Internal Review Board at UCI. The subject was a 45-year-old premenopausal Caucasian woman undergoing neoadjuvant chemotherapy treatment; she provided informed written consent for Human Subjects protocol 95-563. The patient was diagnosed by core biopsy revealing invasive ductal carcinoma in the left breast. Clinical palpation identified an area at 3 o’clock [Fig. 1a ]. Dynamic contrast-enhanced MRI (DCE-MRI) detected several strongly enhanced masses within this area. The outer edge of the tumor was located 0.5 to underneath the skin. In addition, the patient had multiple benign lesions at 1 o’clock (by ultrasound). The tumor position was identified by palpation and ultrasound and was marked with a surgical pen to ensure the scans on different days were performed at the same location. The surgical pen marks were visible after day 3, and they were redrawn every day afterward. The accuracy for redrawing was within 2 to . The optical probe repositioning accuracy was of similar order (i.e., 2 to ). Measurements were made with the patient in the supine position. DOS and DCS measurements were acquired using handheld probes at 10 discrete points in a line along the curved surface at 1-cm intervals across the tumor and surrounding tissue (“line scan”). The same measurement pattern was used on the contralateral breast for comparison. Figures 1a and 1b show the tumor position and line-scan directions on the patient, where the tumor center was located at the 5-cm position. One line scan took about 10 (8) min per breast for DOS (DCS), respectively, resulting in a measurement time of about per session. Extra care was taken during the DCS measurement to gently press the probe on the patient’s breast; the operator attempted to keep that pressure relatively constant and the probe stable. Fig. 1(a) Tumor position and line-scan directions. Starting from point 1 in the upper outer quadrant, optical measurements were performed at 1-cm intervals, ending at point 10 in the lower outer quadrant. (b) Illustration of the line scans over the tumor. (c) Timing diagram for chemotherapy monitoring.  The patient was treated with neoadjuvant chemotherapy delivered in multiple stages. The initial treatment stage consisted of doxorubicin (Adriamycin) and cyclophosphamide (Cytoxan, A/C) therapy. A/C treatments were administered once per cycle for four cycles, with each cycle lasting 2 weeks. Doxorubicin is a cytoxic anthracycline antibiotic, and its mechanism of action is thought to prevent DNA and possibly RNA synthesis by intercalation. Doxorubicin was administered at a dose of once per cycle. Cyclophosphamide is biotransformed principally in the liver to activate alkylating metabolites, which cross-link to tumor cell DNA. Cyclophosphamide was administered at a dose of once per cycle. DOS and DCS measurements were performed on the same day prior to the therapy (day 0), and every day between 3 to 7 days after the first A/C cycle [day 3 to day 7, Fig. 1c]. Additional stages using other therapies were administered, but no DOS/DCS measurements were recorded during these treatment stages (DOS/DCS measurements ended on day 7). The most relevant radiologic assessment was the DCE-MRI study done 12 days after the first A/C therapy, which showed shrinkage of multiple lesions, the largest lesion of which shrunk by (in diameter). Ultrasound measurements were performed after the completion of all four A/C cycles (8 weeks) and detected an irregular hypoechoic lesion of in diameter, indicating a partial response to A/C therapy. At the end of chemotherapy, DCE-MRI showed several tiny enhanced foci. The surgical pathology from lumpectomy at the conclusion of chemotherapy revealed residual intraductal and invasive ductal carcinoma with extensive fibrosis. 2.2.Instrumentation2.2.1.DOSA broadband DOS system developed46 at UCI was utilized to determine tissue optical properties and tissue blood oxygenation in vivo. The system combined a steady state (SS) tungsten-halogen light source and spectrophotometer operating in the 600 to range and a frequency-domain photon migration (FDPM) component (based on a network analyzer) consisting of six laser diodes (operating at discrete wavelengths in the 660 to 850-nm range). The combination of the cw and discrete spectral components enabled determination of complete and spectra from 600 to . Measurements were made using a handheld probe consisting of the SS and FDPM source fibers, one avalanche photodiode (APD) detector and one spectrometer detector fiber. The source-detector separation was and the time to perform SS and FDPM measurements at a single position was typically about 30 to . A detailed description of the performance of this device in 58 breast cancer patients has recently been reported.10 2.2.2.DCSA portable two-channel DCS instrument was built at the University of Pennsylvania and transported to UCI for the measurements of blood flow. Briefly, a compact cw 785-nm long coherence laser (coherence length , Crystalaser, Reno, Nevada) was used as the light source. Two fast-photon-counting APDs (Perkin-Elmer, Canada) were used to register the photons collected with single-mode fibers. A custom-built two-channel correlator board (www.correlator.com, New Jersey) took the transistor-to-transistor logic (TTL) output from the APDs and calculated normalized temporal intensity autocorrelation functions of the detected light, , where is the measured intensity at time , is the correlation delay time, and the angle brackets denote an average over time. A single source fiber and two detector fibers were used in the handheld probe with 2.5-cm source-detector separations. Thus, the DCS measurement probed approximately the same volume of breast tissue as the DOS measurement and a typical photon count rate of was obtained from the breast measurement. Each temporal autocorrelation curve was averaged for , and multiple DCS measurements (typically ) were performed at a single position to ensure a good signal-to-noise ratio (SNR). 2.3.Data Analysis2.3.1.DOS MeasurementsThe algorithm for analyzing the DOS data was described in detail by Bevilacqua 46 Briefly, the frequency domain measurements at six discrete wavelengths were used to extract the reduced scattering coefficient at each wavelength. A power law function,47, 48, 49 , was then fit to the wavelength-dependent to estimate the scattering information at all other wavelengths. With input from the frequency-domain measurements, the data measured with the spectrometer system was employed to extract accurate absorption coefficients over the whole spectral range. As a result, tissue concentrations of oxy-, deoxy-, and total hemoglobin ( , and ), water and lipid (ctLipid) were reconstructed by decomposing the absorption spectra.46 Note that our notation is designed to comply with Zander and Mertzlufft,50 where the prefix “ct” indicates tissue-level concentration (see Table1 ). Table 1Table of abbreviations.
Notes on nomenclature: (1) a prefix ct indicates tissue-level concentration of the parameter; (2) subscripts T and N indicate values of tumor and normal tissues, respectively, where a subscript
T∕N
indicates the tumor/normal contrast; (3) a prefix r indicates relative change compared to prechemotherapy value (day 0). 2.3.2.DCS MeasurementsWe used the intensity temporal autocorrelation curves measured with the DCS instrument to extract tissue blood flow information. The decay rate of the correlation curves is correlated with the blood flow, e.g., faster decay reflects higher blood flow. In our analysis, the photon correlation diffusion equation24, 25 was used to model the propagation of the electric field autocorrelation function, , inside tissues, Here, is the electric field at position and time , is the correlation delay time, is the light speed in the media, is the light diffusion constant, is the optical wave vector, is the mean-square displacement of the moving scatters in time , and is the point source term located at . The normalized electric field autocorrelation function is related to the measured intensity autocorrelation function through the Siegert relation51:where depends on the detection optics (e.g., it is inversely proportional to the number of detected speckles). We determined for each measurement. The decay of the correlation function depends on tissue and , the mean square displacement , of the moving scatterers inside the tissue, and a unitless factor that represents the fraction of scatterers that are moving (i.e., red blood cells). A semi-infinite solution to Eq. 1 (Ref. 25) was used in our data analysis. We have observed that a diffusion model, i.e., , fits the autocorrelation curves rather well over a broad range of tissue types, including the present experiments. 26, 32, 34, 52 Here, is the effective Brownian motion coefficient of the scatterers (distinct from the well known thermal Brownian motion coefficient due originally to Einstein53). Although the units of (square centimeters per second) is different from the traditional blood perfusion unit (milliliters per minute per ), we have verified that changes in are proportional to the changes in tissue blood flow in a wide range of measurements. 32, 33, 34, 52, 54 Determination of is difficult. Therefore in the current study, we report as the blood flow index . Bulk optical properties of the breast, and at , were obtained from the DOS measurements and used in the DCS data analysis to minimize the influence of optical property changes on the accuracy of BFI. In our fitting process, the noise in the correlation curve was estimated as a function of delay time , and was used in calculating , e.g., , where and are the measured and calculated intensity autocorrelation curves, respectively. A more stable BFI is usually obtained from the fitting by minimizing as defined in this way.302.3.3.Tissue Optical IndexThe tissue optical index (TOI) is a multiparameter contrast function created to maximize both the contrast and the specificity of the optical measurement. The TOI is defined as10, 19 The parameters in this contrast function were chosen based on a statistical study of 58 malignant breast lesions.10 In this study, deoxy-hemoglobin was identified as the single best discriminator between malignant tumors and normal tissue, and it was found that addition of water and lipid concentrations further improved malignant/normal discrimination. The simplest index combining these parameters used ctHHb and in the numerator and ctLipid in the denominator. As such, increased TOI reflects a higher chance of tumor malignancy. Conceptually, the TOI takes into account functional (ctHHb and ) and structural (ctLipid and ) information. TOI is also related to metabolic activity since increases in deoxy-hemoglobin are often a symptom of unmet metabolic demand. 2.3.4.Oxygen MetabolismAnother, and perhaps more direct, estimate of tissue oxygen metabolism can be calculated by combining information about blood flow (delivery of oxygen) measured by DCS with chromophore concentration information such as blood oxygen saturation (i.e., oxygen availability) measured by DOS. This approach is often employed in studies of cerebral metabolic rate of oxygen 55, 56, 57, 58, 59, 60 . In the simplest model, is proportional to the tissue arterial-venous oxygenation difference or oxygen extraction fraction (OEF) as well as the rate of oxygen delivery (i.e., the cerebral blood flow, CBF). Several assumptions are typically made in the steady-state model, including constant vasculature compartmentalization. The model has been fairly well studied, validated and its limits examined. 27, 28, 55, 56, 57, 58, 59, 60, 61 In this paper, we construct a mammary oxygen metabolism model that closely follows the approach in brain (see the appendix). We define the tumor/normal contrast of the mammary metabolic rate of oxygen as, where and represent the values for tumor and normal breast tissue (i.e., normal tissues within the same breast), and is the ratio of tumor (or normal) deoxy-to total-hemoglobin in the venous compartment (v) compared to the ratio of deoxy-to total-hemoglobin in the total vasculature (see the appendix). The simplest approximation, which we adopt here, assumes the ratio of to be 1 and constant over time. The relative tumor/normal contrast of mammary metabolic rate of oxygen , see Table 1) can now be estimated from our measurements. We note, however, that these assumptions are unverified. The precise quantification of and requires better understanding of the microcirculation in tumor and normal tissues, and such precision is beyond the scope of the current study.2.3.5.Characterization of ResponsesTo quantify tumor response to chemotherapy, the tumor/normal contrast for the parameters at each time point was determined. Tumor/normal contrast was calculated as the ratio of the average tumor value (positions 3 to 7 in the line scans) to the average value of the normal tissue on the same side of the breast (i.e., positions 8 to 10), for example, , , etc. The positions were chosen based on palpation, and positions 1 and 2 were excluded as normal tissue because they were too close to other benign lesions. This calculation effectively accounts for the global variations in response to chemotherapy by normalizing to the daily normal tissue values. Thus, the tumor specific responses of each parameter are “pulled” out of the measurement. The tumor/normal contrast for each time point was then normalized to prechemotherapy values (day 0) to reflect relative changes, indicated by a prefix “r” for each parameter (see Table 1). Wilcoxon rank-sum tests were conducted comparing the optically measured differences between tumor and normal on day 0. Significant changes were observed and marked in the figures with an ‘ ’, representing a significance level of compared to prechemotherapy values. 3.Results and DiscussionFigure 2 exhibits representative DCS temporal autocorrelation curves measured on the tumor before and after the first A/C treatment (days 0, 3, and 7). The figure also shows data from normal tissue from both breasts on day 0. The symbols are raw data and the solid lines are fitted curves. The correlation curves measured on the tumor have significantly faster decay rates compared to those from normal breast tissues, indicating higher blood flow in the tumor. The measurements from the tumor on different days are clearly distinguishable from one another with good SNR, thus enabling us to quantify tumor blood flow changes due to chemotherapy. Fig. 2Raw (symbols) and fitted intensity autocorrelation curves (solid lines) measured from the patient before and after chemotherapy (day 0, day 3, and day 7). Both and the BFI were fit. Similar values were obtained for both normal and tumor breast tissues. The correlation curves measured on the tumor have larger decay rates compared to the curves measured on the contralateral breast, indicating higher blood flow in the tumor.  Figure 3 shows line scans of blood flow index [ , Fig. 3a] and total hemoglobin concentration [ctTHb, Fig. 3b] from both the tumor breast and the contralateral breast before and after the first chemotherapy treatment (days 0, 3, and 7). Error bars in the figures represent the standard deviation of repeated measurements. The measurements conducted on different days were reproducible, which can be seen from the scans on the contralateral breast and the normal tissues on the tumor-bearing breast (positions 8 to 10). BFI exhibited significant increases in the tumor breast (i.e., folds) relative to the heterogeneity of normal breast tissue on the contralateral side (i.e., ). ctTHb also showed clear tumor/normal contrast (i.e., ). For clarity, line–scans for other hemodynamic parameters, such as ctHHb, , and water and lipid concentrations, are not plotted. The observed tumor/normal contrast of these parameters is consistent with previous reports,10, 14 i.e., ctHHb had a contrast of , had a contrast of , water had a contrast of , ctLipid had a contrast of , and at had a contrast of prior to the A/C treatment. Fig. 3Line scans of (a) BFI and (b) ctTHb before and after the first chemotherapy cycle (day 0, day 3, and day 7). On the tumor side of the breast, BFI showed clear contrast, which was much larger than the heterogeneity of the breast tissue on the contralateral side. The ctTHb also showed clear contrast on the tumor. Tumor contrasts changed in response to the chemotherapy. For clarity, line scans of other hemodynamic parameters, such as ctHHb, , and water and lipid concentrations, are not plotted. Error bars represent the standard deviation of repeated measurements. Plots were slightly offset along the axis for better illustration of the error bars. 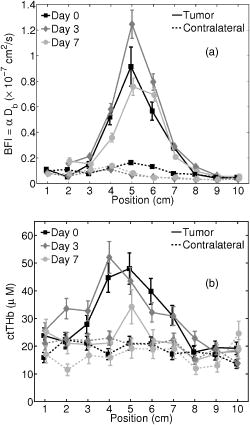 Neoadjuvant chemotherapy can induce hemodynamic changes in both tumor and normal tissues.14, 16 To investigate the tumor specific changes in response to the chemotherapy, relative tumor/normal contrast of ctHHb, , and ctTHb with respect to pretherapy values ( , , and ) were calculated and are plotted in Fig. 4 . Notice that significant changes in these hemodynamic parameters were observed as early as 4 days after the start of A/C therapy , i.e. dropped to of its original value (day 0); dropped to ; and dropped to . By the end of the monitoring period (day 7), there were continued small hemodynamic reductions and all values remained substantially lower than pre-treatment levels (day 0): dropped to ; dropped to ; and dropped to . Fig. 4Relative tumor/normal ctHHb, , and ctTHb contrast ( , and ) in response to chemotherapy. The contrasts were calculated as the ratio of the average tumor value (positions 3 to 7 in the line scans) to the average value of the normal tissue on the same side of the breast (positions 8 to 10). The contrasts were then normalized to the pre-chemotherapy values to reflect relative changes. Significant decreases in the contrast occurred in all three parameters 4 days after the chemotherapy. Asterisks denote the data points significantly different from the pre-chemotherapy values (day 0, ). Plots were slightly offset along the axis for better illustration of the error bars.  Relative tumor/normal contrast of blood flow , concentration of water and lipid , and reduced scattering coefficient in response to the chemotherapy are plotted in Fig. 5 . Blood flow measured with DCS showed good SNR ratio and substantial tumor-to-normal contrast. increased initially on day 3 after the A/C therapy , followed by a sharp and sustained drop on days 4 , 5 , and 7 . increased significantly from day 5 to day 7 . Since the lipid concentration in tumor was lower than in the normal breast tissues before the therapy, the increase in suggests that lipid concentration in the tumor is normalized over time. The at had a small increase within the week , despite the increase on day 5, which was significant . No significant changes for the relative contrast of water concentration were observed within the first week. However, the subject was also enrolled in a separate study for DOS, wherein significant decrease in water contrast was observed after 4 months (i.e., decreased to ). Fig. 5Relative tumor/normal blood flow index, water, lipid and contrast ( , , , and ) in response to chemotherapy. The contrasts were calculated as the ratio of the average tumor value (positions 3 to 7 in the line scans) to the average value of the normal tissue on the same side of the breast (positions 8 to 10). The contrasts were then normalized to the pre-chemotherapy values to reflect relative changes. showed an significant initial increase on day 3 and a significant decrease on day 5 . Water contrast did not change significantly in response to the chemotherapy, while lipid contrast increased significantly after day 5 . Asterisks denote the data points significantly different from the pre-chemotherapy values (day 0, ). Plots were slightly offset along the axis for better illustration of the error bars.  Note, the optical properties ( and ) of the breast tissue at were measured by the DOS instrument. Measured absorption and scattering effects are incorporated into the DCS data analysis. As a result, the influence of oxygenation state of the breast should not influence our blood flow results. On the other hand, probe contact pressure and the movement of fiber optics could have an effect on our DCS measurements. In a previous experiment,32 we have carried out tests that suggest the movement of fiber optics do not influence the DCS measurements after the optical probe was secured in place. An indication that the pressure and motion effects are minimal can be seen from the relatively small variations measured on the contralateral side of the breast (Fig. 3), i.e., the day-to-day tumor contrast and variation were large compared to the combination of measurement noise, physiological noise, motion artifact noise, and pressure related variations experienced on the contralateral breast. Chemotherapy treatment alters tumor angiogenesis.62 Therefore, optical properties of the tumor are expected to change due to chemotherapy, which is observed in our measurements. Although chemotherapy may also induce changes of other kinds of microscopic motions inside the tumor, we believe such an effect is likely small compared to the changes in tumor vasculature and blood flow. In our previous study of photodynamic therapy treatment of mouse tumors,34 blood flow changes measured with both ultrasound Doppler and DCS showed comparable results, indicating the tumor responses measured with DCS are mainly due to blood flow. The relative tumor blood flow reduction in response to neoadjuvant chemotherapy observed in the current study ( within the first week) is also consistent with results from PET studies,39, 63 wherein a 30% to 50% blood flow decrease after 2 months of chemotherapy was reported. Yet blood flow changes exhibit distinct features compared to other hemodynamic parameters measured with DOS. For example, we have observed an initial increase in on day 3 in this patient (Fig. 5), accompanied by an decrease in (Fig. 4). Although the mechanism is not clear, this may be due to an early tumor vascular response to cellular damage. The decrease in on day 3 could be consistent with reduced oxygen extraction given that remained roughly constant and flow was elevated. By day 4, A/C therapy has continued to damage both cells and vasculature; , , and all decreased because of significant damage to tumor cells. A similar initial increase followed by a significant decrease of blood flow was observed during the first few days after radiation therapy in patients with breast tumors.64 In patients with head and neck tumors,36, 65 and rectal carcinoma,66 similar patterns of blood flow changes were also reported in the early weeks after radiation therapy. Further studies involving more patients are underway to confirm the observations in this case study. As described in Sec. 2.3, the combination of DCS and DOS measurements enable oxygen metabolic changes in the tumor to be calculated using Eq. 4. Compared to flow, hemoglobin concentrations, and other tissue parameters alone, this relative metabolism index is a potentially more direct indicator of tumor metabolic activities that integrates many factors and may provide further insight about tumor physiological responses to therapy. Figure 6 displays the relative changes in tumor/normal contrast of mammary metabolic rate of oxygen and the tissue optical index based on chromophore concentrations [i.e., and ]. Values of relative tumor/normal contrast for all the optically derived parameters are listed in Table 2 . and differed on day 3, e.g. had an initial drop and had an initial increase , but both parameters were only marginally different from day 0. The initial increase observed in is most probably a result of the initial increase of blood flow, although further evidence is needed for this hypothesis to be confirmed. However, after day 4, both metabolic indices dropped significantly ( , and , on day 4) and then stabilized at this level until the end of the monitoring period. We note that although both and are considered to be related to tumor metabolic responses, provides information about tumor cellular metabolic activities,19, 67 while provides an estimation of tumor oxygen metabolic changes. Note that tumors have abnormal vasculatures and the input and output circulations to and from the tumor are not well characterized. Our assumption of (see the appendix) may not be true, but in the absence of more information, we believe this is a reasonable starting assumption. (Eq. 4) functions more as a relative index of oxygen consumption than as a quantitative measure of true oxygen metabolism. We have introduced as a potentially useful index for monitoring cancer physiology accessible to the optical method. Its utility, however, must be determined by more clinical studies. To date only a few in vivo studies on human tumors have probed oxygen metabolism. 68, 69, 70, 71 Further studies and validation in animal models using methods presented in this paper may be useful to improve the oxygen metabolism model in tumors, to reveal the connections between TOI and oxygen metabolism, and to provide potential diagnostics for chemotherapy efficacy. Fig. 6Relative tumor/normal tissue optical index and mammary metabolic rate of oxygen contrast [ and ] in response to chemotherapy. The contrasts were calculated as the ratio of the average tumor value (positions 3 to 7 in the line scans) to the average value of the normal tissue on the same side of the breast (positions 8 to 10). The contrasts were then normalized to the pre-chemotherapy values to reflect relative changes. Significant decreases were observed in both and after day 4. Asterisks denote the data points significantly different from the pre-chemotherapy values (day 0, ). Plots were slightly offset along the axis for better illustration of the error bars. 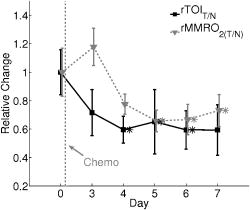 Table 2Tumor/normal contrast changes normalized to day 0 values of all parameters within the first week of chemotherapy.
Asterisks
(*)
denote the data points significantly different from the prechemo therapy values (day 0,
p<0.05
). 4.ConclusionWe reported a case study wherein we monitored hemodynamic and tissue optical property changes in a breast tumor patient undergoing neoadjuvant chemotherapy. Our approach employed a combination of DOS and DCS to measure simultaneously blood oxygenation, lipid, water, and blood flow. We demonstrated the feasibility of this methodology and detected significant changes in tissue parameters as early as day 3 following the first chemotherapy infusion. This study introduced optical measurement of blood flow as a new parameter for therapy monitoring along with multiparameter indices that may provide further physiological insight, such as tissue metabolic rate of oxygen. Overall, the hybrid diffuse optical approach shows promise for therapy monitoring, optimization, and personalization by potentially detecting physiological changes that may precede anatomical changes accessible to traditional radiological diagnostics procedures. AppendixIn this section, we derive the equation for the calculation of the tumor/normal contrast of the mammary metabolic rate of oxygen following the steps in deriving the cerebral metabolic rate of oxygen . 27, 55, 56, 57, 58, 59, 60 Using Fick’s law, the tumor (or normal) mammary metabolic rate of oxygen can be calculated as The tumor (or normal) oxygen extraction factor is by definition the fractional conversion of oxygen from arterioles to venules, i.e., , where and are the tumor (or normal) arteriolar and venous concentrations of oxygen. is the tumor (or normal) blood flow. In steady-state, assuming a balance between oxygen concentration and oxyhemoglobin saturation in the arteriolar and venous compartments , we have As a result, the tumor/normal contrast of mammary metabolic rate of oxygen can be expressed as given the assumption that the changes of BFI are proportional to the changes of tissue blood flow (see Sec. 2.3). Assuming , we will haveThe diffuse optical signal originates from the hemoglobin in the tissue within the view of the probe, and represents a mixture of arterial, capillary and venous blood. The mixed tissue compartment (MTC) viewed by the optical probe is a weighted average of the arterial (a), capillary (c), and venous (v) compartments, and the weight is proportional to the optical cross section of the corresponding compartment. For example, , where , , and are the respective weights and . If we further assume the quantities in the venous compartment are proportional to the MTC values, i.e., We can further simplify by defining , which is the ratio of deoxy to total hemoglobin in the venous compartment compared to the ratio of deoxy to total hemoglobin in the total mixed vasculature. As a result, we will have where and are two unknowns. The ratio of reflects the relative oxygen extraction ability of the vasculature. For example, a ratio larger than 1 means a higher tumor deoxyhemoglobin fraction in the venous compartment relative to the total mixed vasculature compared to the normal tissue, reflecting a larger portion of oxygen is extracted from the tumor tissue.AcknowledgmentsThis work was supported by the National Institutes of Health (NIH) grants NTROI-1U54CA105480 (BJT, AGY), LAMMP-P41-RR01192 (BJT), and RO1-HL-077699 (AGY), and RO1-EB-002109 (AGY) and the California Breast Cancer Research Program (BJT). The authors thank Montana Compton and Tran Du for their assistance in this study and the facilities and staff of the Chao Family Comprehensive Cancer Center (P30-CA-62203). The authors also thank Ulas Sunar and Britton Chance for useful discussions. ReferencesB. W. Pogue,
S. P. Poplack,
T. O. McBride,
W. A. Wells,
K. S. Osterman,
U. L. Osterberg, and
K. D. Paulsen,
“Quantitative hemoglobin tomography with diffuse near-infrared spectroscopy: pilot results in the breast,”
Radiology, 218
(1), 261
–266
(2001). 0033-8419 Google Scholar
H. B. Jiang,
N. V. Iftimia,
Y. Xu,
J. A. Eggert,
L. L. Fajardo, and
K. L. Klove,
“Near-infrared optical imaging of the breast with model-based reconstruction,”
Acad. Radiol., 9
(2), 186
–194
(2002). 1076-6332 Google Scholar
A. Li,
E. L. Miller,
M. E. Kilmer,
T. J. Brukilacchio,
T. Chaves,
J. Stott,
Q. Zhang,
T. Wu,
M. Chorlton,
R. H. Moore,
D. B. Kopans, and
D. A. Boas,
“Tomographic optical breast imaging guided by three-dimensional mammography,”
Appl. Opt., 42 5181
–5190
(2003). https://doi.org/10.1364/AO.42.005181 0003-6935 Google Scholar
B. Chance,
S. Nioka,
J. Zhang,
E. F. Conant,
E. Hwang,
S. Briest,
S. G. Orel,
M. D. Schnall, and
B. J. Czerniecki,
“Breast cancer detection based on incremental biochemical and physiological properties of breast cancers: a six-year, two-site study,”
Acad. Radiol., 12 925
–933
(2005). 1076-6332 Google Scholar
C. H. Schmitz,
D. P. Klemer,
R. Hardin,
M. S. Katz,
Y. Pei,
H. L. Graber,
M. B. Levin,
R. D. Levina,
N. A. Fraco,
W. B. Solomon, and
R. L. Barbour,
“Design and implementation of dynamic near-infrared optical tomographic imaging instrumentation for simultaneous dual-breast measurements,”
Appl. Opt., 44 2140
–2153
(2005). https://doi.org/10.1364/AO.44.002140 0003-6935 Google Scholar
T. Yates,
J. C. Hebden,
A. Gibson,
N. Everdell,
S. R. Arridge, and
M. Douek,
“Optical tomography of the breast using a multi-channel time-resolved imager,”
Phys. Med. Biol., 50
(11), 2503
–2518
(2005). https://doi.org/10.1088/0031-9155/50/11/005 0031-9155 Google Scholar
D. Grosenick,
K. T. Moesta,
M. Möller,
J. Mucke,
H. Wabnitz,
B. Gebauer,
C. Stroszczynski,
B. Wassermann,
P. M. Schlag, and
H. Rinneberg,
“Time-domain scanning optical mammography: I. Recording and assessment of mammograms of 154 patients,”
Phys. Med. Biol., 50
(11), 2429
–2450
(2005). https://doi.org/10.1088/0031-9155/50/11/001 0031-9155 Google Scholar
D. Grosenick,
H. Wabnitz,
K. T. Moesta,
J. Mucke,
P. M. Schlag, and
H. Rinneberg,
“Time-domain scanning optical mammography: II. Optical properties and tissue parameters of 87 carcinomas,”
Phys. Med. Biol., 50
(11), 2451
–2468
(2005). https://doi.org/10.1088/0031-9155/50/11/002 0031-9155 Google Scholar
X. Intes,
“Time-Domain optical mammography SoftScan: initial results,”
Acad. Radiol., 12 934
–947
(2005). 1076-6332 Google Scholar
A. Cerussi,
N. Shah,
D. Hsiang,
A. Durkin,
J. Butler, and
B. J. Tromberg,
“In vivo absorption, scattering, and physiologic properties of 58 malignant breast tumors determined by broadband diffuse optical spectroscopy,”
J. Biomed. Opt., 11
(4), 044,005
(2006). 1083-3668 Google Scholar
V. Ntziachristos,
A. G. Yodh,
M. D. Schnall, and
B. Chance,
“MRI-guided diffuse optical spectroscopy of malignant and benign breast lesions,”
Neoplasia, 4 347
–354
(2002). https://doi.org/10.1038/sj.neo.7900244 1522-8002 Google Scholar
H. Dehghani,
B. W. Pogue,
S. P. Poplack, and
K. D. Paulsen,
“Multiwavelength three-dimensional near-infrared tomography of the breast: initial simulation, phantom, and clinical results,”
Appl. Opt., 42 135
–145
(2003). https://doi.org/10.1364/AO.42.000135 0003-6935 Google Scholar
Q. I. Zhu,
M. M. Huang,
N. G. Chen,
K. Zarfos,
B. Jagjivan,
M. Kane,
P. Hedge, and
S. H. Kurtzman,
“Ultrasound-guided optical tomographic imaging of malignant and benign breast lesions: initial clinical results of 19 cases,”
Neoplasia, 5
(5), 379
–388
(2003). 1522-8002 Google Scholar
D. B. Jakubowski,
A. E. Cerussi,
F. Bevilacqua,
N. Shah,
D. Hsiang,
J. Butler, and
B. J. Tromberg,
“Monitoring neoadjuvant chemotherapy in breast cancer using quantitative diffuse optical spectroscopy: a case study,”
J. Biomed. Opt., 9
(1), 230
–238
(2004). https://doi.org/10.1117/1.1629681 1083-3668 Google Scholar
Q. N. Zhu,
S. H. Kurtzman,
P. Hegde,
S. Tannenbaum,
M. Kane,
M. M. Huang,
N. G. Chen,
B. Jagjivan, and
K. Zarfos,
“Utilizing optical tomography with ultrasound localization to image heterogeneous hemoglobin distribution in large breast cancers,”
Neoplasia, 7
(3), 263
–270
(2005). https://doi.org/10.1593/neo.04526 1522-8002 Google Scholar
R. Choe,
A. Corlu,
K. Lee,
T. Durduran,
S. D. Konecky,
M. Grosicka-Koptyra,
S. R. Arridge,
B. J. Czerniecki,
D. L. Fraker,
A. DeMichele,
B. Chance,
M. A. Rosen, and
A. G. Yodh,
“Diffuse optical tomography of breast cancer during neoadjuvant chemotherapy: a case study with comparison to MRI,”
Med. Phys., 32
(4), 1128
–1139
(2005). https://doi.org/10.1118/1.1869612 0094-2405 Google Scholar
N. Shah,
J. Gibbs,
D. Wolverton,
A. Cerussi,
N. Hylton, and
B. J. Tromberg,
“Combined diffuse optical spectroscopy and contrast-enhanced magnetic resonance imaging for monitoring breast cancer neoadjuvant chemotherapy: a case study,”
J. Biomed. Opt., 10
(5), 051,503
(2005). 1083-3668 Google Scholar
P. Taroni,
A. Torricelli,
L. Spinelli,
A. Pifferi,
F. Arpaia,
G. Danesini, and
R. Cubeddu,
“Time-resolved optical mammography between 637 and : clinical study on the detection and identification of breast lesions,”
Phys. Med. Biol., 50
(11), 2469
–2488
(2005). https://doi.org/10.1088/0031-9155/50/11/003 0031-9155 Google Scholar
B. J. Tromberg,
A. Cerussi,
N. Shah,
M. Compton,
A. Durkin,
D. Hsiang,
J. Butler, and
R. Mehta,
“Imaging in breast cancer—diffuse optics in breast cancer: detecting tumors in pre-menopausal women and monitoring neoadjuvant chemotherapy,”
Breast Cancer Res., 7
(6), 279
–285
(2005). Google Scholar
J. C. Hebden,
T. D. Yates,
A. Gibson,
N. Everdell,
S. R. Arridge,
D. W. Chicken,
M. Douek, and
M. R. S. Keshtgar,
“Monitoring recovery after laser surgery of the breast with optical tomography: a case study,”
Appl. Opt., 44
(10), 1898
–1904
(2005). https://doi.org/10.1364/AO.44.001898 0003-6935 Google Scholar
E. Bombardieri,
“Nuclear medicine applications for bone metastases—foreward,”
Q. J. Nucl. Med., 45
(1), 1
–1
(2001). 1125-0135 Google Scholar
G. Maret and
P. Wolf,
“Multiple light scattering from disordered media. The effect of Brownian motion of scatterers,”
Z. Phys. B, 65
(4), 409
–413
(1987). https://doi.org/10.1007/BF01303762 0340-224X Google Scholar
D. Pine,
D. Weitz,
P. Chaikin, Herbolzheimer,
“Diffusing-wave spectroscopy,”
Phys. Rev. Lett., 60 1134
–1137
(1988). https://doi.org/10.1103/PhysRevLett.60.1134 0031-9007 Google Scholar
D. A. Boas,
L. E. Campbell, and
A. G. Yodh,
“Scattering and Imaging with diffusing temporal field correlations,”
Phys. Rev. Lett., 75
(9), 1855
–1858
(1995). https://doi.org/10.1103/PhysRevLett.75.1855 0031-9007 Google Scholar
D. A. Boas and
A. G. Yodh,
“Spatially varying dynamical properties of turbid media probed with diffusing temporal light correlation,”
J. Opt. Soc. Am. A, 14
(1), 192
–215
(1997). 0740-3232 Google Scholar
C. Cheung,
J. P. Culver,
K. Takahashi,
J. H. Greenberg, and
A. G. Yodh,
“In vivo cerebrovascular measurement combining diffuse near-infrared absorption and correlation spectroscopies,”
Phys. Med. Biol., 46
(8), 2053
–2065
(2001). https://doi.org/10.1088/0031-9155/46/8/302 0031-9155 Google Scholar
J. P. Culver,
T. Durduran,
T. Furuya,
C. Cheung,
J. H. Greenberg, and
A. G. Yodh,
“Diffuse optical tomography of cerebral blood flow, oxygenation, and metabolism in rat during focal ischemia,”
J. Cereb. Blood Flow Metab., 23 911
–924
(2003). https://doi.org/10.1097/01.WCB.0000076703.71231.BB 0271-678X Google Scholar
T. Durduran,
G. Q. Yu,
M. G. Burnett,
J. A. Detre,
J. H. Greenberg,
J. Wang,
C. Zhou, and
A. G. Yodh,
“Diffuse optical measurement of blood flow blood oxygenation and metabolism in a human brain during sensorimotor cortex activation,”
Opt. Lett., 29 1766
–1768
(2004). https://doi.org/10.1364/OL.29.001766 0146-9592 Google Scholar
J. Li,
G. Dietsche,
D. Iftime,
S. E. Skipetrov,
G. Maret,
T. Elbert,
B. Rockstroh, and
T. Gisler,
“Noninvasive detection of functional brain activity with near-infrared diffusing-wave spectroscopy,”
J. Biomed. Opt., 10
(4), 1
–12
(2005). 1083-3668 Google Scholar
C. Zhou,
G. Q. Yu,
D. Furuya,
J. H. Greenberg,
A. G. Yodh, and
T. Durduran,
“Diffuse optical correlation tomography of cerebral blood flow during cortical spreading depression in rat brain,”
Opt. Express, 14 1125
–1144
(2006). https://doi.org/10.1364/OE.14.001125 1094-4087 Google Scholar
F. Jaillon,
J. Li,
G. Dietsche,
T. Elbert, and
T. Gisler,
“Activity of the human visual cortex measured non-invasively by diffusing-wave spectroscopy,”
Opt. Express, 15 6643
–6650
(2007). https://doi.org/10.1364/OE.15.006643 1094-4087 Google Scholar
G. Q. Yu,
T. Durduran,
G. Lech,
C. Zhou,
B. Chance,
R. E. Mohler, and
A. G. Yodh,
“Time-dependent blood flow and oxygenation in human skeletal muscles measured with noninvasive near-infrared diffuse optical spectroscopies,”
J. Biomed. Opt., 10 024027
(2005). https://doi.org/10.1117/1.1884603 1083-3668 Google Scholar
G. Q. Yu,
T. Floyd,
T. Durduran,
C. Zhou,
J. J. Wang,
J. A. Detre, and
A. G. Yodh,
“Validation of diffuse correlation spectroscopy for muscle blood flow with concurrent arterial spin labeled perfusion MRI,”
Opt. Express, 15
(3), 1064
–1075
(2007). https://doi.org/10.1364/OE.15.001064 1094-4087 Google Scholar
G. Q. Yu,
T. Durduran,
C. Zhou,
H. W. Wang,
M. E. Putt,
H. M. Saunders,
C. M. Sehgal,
E. Glatstein,
A. G. Yodh, and
T. M. Busch,
“Noninvasive monitoring of murine tumor blood flow during and after photodynamic therapy provides early assessment of therapeutic efficacy,”
Clin. Cancer Res., 11
(9), 3543
–3552
(2005). 1078-0432 Google Scholar
G. Q. Yu,
T. Durduran,
C. Zhou,
T. C. Zhu,
J. C. Finlay,
T. M. Busch,
S. B. Malkowicz,
S. M. Hahn, and
A. G. Yodh,
“Real-time in situ monitoring of human prostate photodynamic therapy with diffuse light,”
Photochem. Photobiol., 82
(5), 1279
–1284
(2006). https://doi.org/10.1562/2005-10-19-RA-721 0031-8655 Google Scholar
U. Sunar,
H. Quon,
T. Durduran,
J. Zhang,
J. Du,
C. Zhou,
G. Q. Yu,
R. Choe,
A. Kilger,
R. Lustig,
L. Loevner,
S. Nioka,
B. Chance, and
A. G. Yodh,
“Noninvasive diffuse optical measurement of blood flow and blood oxygenation for monitoring radiation therapy in patients with head and neck tumors: a pilot study,”
J. Biomed. Opt., 11 064,021
(2006). 1083-3668 Google Scholar
T. Durduran,
R. Choe,
G. Q. Yu,
C. Zhou,
J. C. Tchou,
B. J. Czerniecki, and
A. G. Yodh,
“Diffuse optical measurement of blood flow in breast tumors,”
Opt. Lett., 30 2915
–2917
(2005). https://doi.org/10.1364/OL.30.002915 0146-9592 Google Scholar
H. Madjar,
W. Sauerbrei,
H. J. Prompeler,
R. Wolfarth, and
H. Gufler,
“Color Doppler and duplex flow analysis for classification of breast lesions,”
Gynecol. Oncol., 64
(3), 392
–403
(1997). https://doi.org/10.1006/gyno.1996.4585 0090-8258 Google Scholar
D. A. Mankoff,
L. K. Dunnwald,
J. R. Gralow,
G. K. Ellis,
E. K. Schubert,
J. Tseng,
T. J. Lawton,
H. M. Linden, and
R. B. Livingston,
“Changes in blood flow and metabolism in locally advanced breast cancer treated with neoadjuvant chemotherapy,”
J. Nucl. Med., 44
(11), 1806
–1814
(2003). 0161-5505 Google Scholar
J. P. Delille,
P. J. Slaneta,
E. D. Yeh,
E. F. Halpern,
D. B. Kopans, and
L. Garrido,
“Invasive ductal breast carcinoma response to neoadjuvant chemotherapy: noninvasive monitoring with functional MR imaging—pilot study,”
Radiology, 228
(1), 63
–69
(2003). https://doi.org/10.1148/radiol.2281011303 0033-8419 Google Scholar
G. M. McDermott,
A. Welch,
R. T. Staff,
F. J. Gilbert,
L. Schweiger,
S. I. Semple,
T. A. Smith,
A. W. Hutcheon,
I. D. Miller,
I. C. Smith, and
S. D. Heys,
“Monitoring primary breast cancer throughout chemotherapy using FDG-PET,”
Breast Cancer Res. Treat., 102
(1), 75
–84
(2007). 0167-6806 Google Scholar
C. Rousseau,
A. Devillers,
C. Sagan,
L. Ferrer,
B. Bridji, L. Campion, M. Ricaud,
E. Bourbouloux,
I. Doutriaux,
M. Clouet,
D. Berton-Rigaud,
C. Bouriel,
V. Delecroix,
E. Garin,
S. Rouquette,
I. Resche,
P. Kerbrat,
J. F. Chatal, and
M. Campone,
“Monitoring of early response to neoadjuvant chemotherapy in stage II and III breast cancer by [18F]fluorodeoxyglucose positron emission tomography,”
J. Clin. Oncol., 24
(34), 5366
–5372
(2006). https://doi.org/10.1200/JCO.2006.05.7406 0732-183X Google Scholar
C. P. Chou,
M. T. Wu,
H. T. Chang,
Y. S. Lo,
H. B. Pan,
H. Degani, and
E. Furman-Haran,
“Monitoring breast cancer response to neoadjuvant systemic chemotherapy using parametric contrast-enhanced MRI: a pilot study,”
Acad. Radiol., 14
(5), 561
–573
(2007). 1076-6332 Google Scholar
R. L. Wahl,
K. R. Zasadny,
G. D. Hytchins,
M. Helvie, and
R. Cody,
“Metabolic monitoring of breast cancer chemohormonotherapy using positron emission tomography (PET): initial evaluation,”
J. Clin. Oncol., 11 2101
–2111
(1993). 0732-183X Google Scholar
E. Bombardieri and
F. Crippa,
“PET imaging in breast cancer,”
Q. J. Nucl. Med., 45
(3), 245
–255
(2001). 1125-0135 Google Scholar
F. Bevilacqua,
A. J. Berger,
A. E. Cerussi,
D. Jakubowski, and
B. J. Tromberg,
“Broadband absorption spectroscopy in turbid media by combined frequency-domain and steady-state methods,”
Appl. Opt., 39
(34), 6498
–6507
(2000). 0003-6935 Google Scholar
R. Graaff,
J. G. Aarnoudse,
J. R. Zijp,
P. M. A. Sloot,
F. F. M. de Mul,
J. Greve, and
M. H. Koelink,
“Reduced light-scattering properties for mixtures of spherical particles: a simple approximation derived from Mie calculations,”
Appl. Opt., 31
(10), 1370
–1376
(1992). 0003-6935 Google Scholar
J. R. Mourant,
T. Fuselier,
J. Boyer,
T. M. Johnson, and
I. J. Bigio,
“Predictions and measurements of scattering and absorption over broad wavelength ranges in tissue phantoms,”
Appl. Opt., 36
(4), 949
–957
(1997). 0003-6935 Google Scholar
J. M. Schmitt and
G. Kumar,
“Optical scattering properties of soft tissue: a discrete particle model,”
Appl. Opt., 37
(13), 2788
–2797
(1998). 0003-6935 Google Scholar
R. Zander and
F. Mertzlufft,
“Tentative recommendations on terminology and definitions in the respiratory physiology: resume of the ISOTT consensus session 1992,”
Oxyg. Transp. Tiss., 15 913
–919
(1994). Google Scholar
S. Rice,
“Mathematical analysis of random noise,”
Noise and Stochastic Processes, 133 Dover, New York (1954). Google Scholar
T. Durduran,
“Noninvasive measurements of tissue hemodynamics with hybrid diffuse optical methods,”
University of Pennsylvania,
(2004). Google Scholar
A. Einstein,
“On the motion of small particles suspended in liquids at rest required by the molecular-kinetic theory of heat,”
Ann. Phys., 17 549
–560
(1905). https://doi.org/10.1002/andp.19053220806 0003-3804 Google Scholar
C. Menon,
G. M. Polin,
I. Prabakaran,
A. Hsi,
C. Cheung,
J. P. Culver,
J. F. Pingpank,
C. S. Sehgal,
A. G. Yodh,
D. G. Buerk, and
D. L. Fraker,
“An integrated approach to measuring tumor oxygen status using human melanoma xenografts as a model,”
Cancer Res., 63
(21), 7232
–7240
(2003). 0008-5472 Google Scholar
F. Hyder,
R. G. Shulman, and
D. L. Rothman,
“A model for the regulation of cerebral oxygen delivery,”
J. Appl. Physiol., 85
(2), 554
–564
(1998). 8750-7587 Google Scholar
R. D. Hoge,
J. Atkinson,
B. Gill,
G. R. Crelier,
S. Marrett, and
G. B. Pike,
“Investigation of BOLD signal dependence on cerebral blood flow and oxygen consumption: the deoxyhemoglobin dilution model,”
Magn. Reson. Med., 42
(5), 849
–863
(1999). https://doi.org/10.1002/(SICI)1522-2594(199911)42:5<849::AID-MRM4>3.0.CO;2-Z 0740-3194 Google Scholar
J. B. Mandeville,
J. J. Marota,
C. Ayata,
M. A. Moskowitz,
R. M. Weisskoff, and
B. R. Rosen,
“MRI measurement of the temporal evolution of relative CMRO(2) during rat forepaw stimulation,”
Magn. Reson. Med., 42
(5), 944
–951
(1999). https://doi.org/10.1002/(SICI)1522-2594(199911)42:5<944::AID-MRM15>3.0.CO;2-W 0740-3194 Google Scholar
J. Mayhew,
D. Johnston,
J. Martindale,
M. Jones,
J. Berwick, and
Y. Zheng,
“Increased oxygen consumption following activation of brain: theoretical footnotes using spectroscopic data from barrel cortex,”
Neuroimage, 13
(6), 975
–987
(2001). 1053-8119 Google Scholar
M. Jones,
J. Berwick,
D. Johnston, and
J. Mayhew,
“Concurrent optical imaging spectroscopy and laser-Doppler flowmetry: the relationship between blood flow, oxygenation, and volume in rodent barrel cortex,”
Neuroimage, 13
(6, Pt 1), 1002
–1015
(2001). 1053-8119 Google Scholar
B. Ances,
D. Wilson,
J. Greenberg, and
J. Detre,
“Dynamic changes in cerebral blood flow, tension, and calculated cerebral metabolic rate of during functional activation using oxygen phosphorescence quenching,”
J. Cereb. Blood Flow Metab., 21 511
–516
(2001). https://doi.org/10.1097/00004647-200105000-00005 0271-678X Google Scholar
D. A. Boas,
G. Strangman,
J. P. Culver,
R. D. Hoge,
G. Jasdzewski,
R. A. Poldrack,
B. R. Rosen, and
J. B. Mandeville,
“Can the cerebral metabolic rate of oxygen be estimated with near-infrared spectroscopy?,”
Phys. Med. Biol., 48 2405
–2418
(2003). https://doi.org/10.1088/0031-9155/48/15/311 0031-9155 Google Scholar
A. Makris,
T. J. Powles,
S. Kakolyris,
M. Dowsett,
S. E. Ashley, and
A. L. Harris,
“Reduction in angiogenesis after neoadjuvant chemoendocrine therapy in patients with operable breast carcinoma,”
Cancer, 85
(9), 1996
–2000
(1999). 0008-543X Google Scholar
J. Tseng,
L. K. Dunnwald,
E. K. Schubert,
J. M. Link,
S. Minoshima,
M. Muzi, and
D. A. Mankoff,
“F18-FDG kinetics in locally advanced breast cancer: correlation with tumor blood flow and changes in response to neoadjuvant chemotherapy,”
J. Nucl. Med., 45
(11), 1829
–1837
(2003). 0161-5505 Google Scholar
R. Johnson,
“Thermodynamic method for investigation of radiation-induced changes in microcirculation of human tumors,”
Int. J. Radiat. Oncol., Biol., Phys., 1 659
–670
(1976). 0360-3016 Google Scholar
M. J. Mantyla,
J. T. Toivanen,
M. A. Pitkanen, and
A. H. Rekonen,
“Radiation-induced changes in regional blood flow in human tumors,”
Int. J. Radiat. Oncol., Biol., Phys., 8
(10), 1711
–1717
(1982). 0360-3016 Google Scholar
A. F. DeVries,
C. Kremser,
P. A. Hein,
J. Griebel,
A. Krezcy,
D. Ofner,
K. P. Pfeiffer,
P. Lukas, and
W. Judmaier,
“Tumor microcirculation and diffusion predict therapy outcome for primary rectal carcinoma,”
Int. J. Radiat. Oncol., Biol., Phys., 56
(4), 958
–965
(2003). https://doi.org/10.1016/S0360-3016(03)00208-6 0360-3016 Google Scholar
N. Shah,
A. E. Cerussi,
D. Jakubowski,
D. Hsiang,
J. Butler, and
B. J. Tromberg,
“The role of diffuse optical spectroscopy in the clinical management of breast cancer,”
Dis. Markers, 19 95
–105
(2003). 0278-0240 Google Scholar
R. P. Beaney,
A. A. Lammertsma,
T. Jones,
C. G. McKenzie, and
K. E. Halnan,
“Positron emission tomography for in-vivo measurement of regional blood flow, oxygen utilisation, and blood volume in patients with breast carcinoma,”
Lancet, 1 131
–134
(1984). https://doi.org/10.1016/S0140-6736(84)90063-1 0140-6736 Google Scholar
A. A. Lammertsma,
“Positron emission tomography and in vivo measurements of tumour perfusion and oxygen utilisation,”
Cancer Metastasis Rev., 6 521
–539
(1987). 0891-9992 Google Scholar
P. Vaupel,
F. Kallinowski, and
P. Okunieff,
“Blood flow, oxygen and nutrient supply, and metabolic microenvironment of human tumors: a review,”
Cancer Res., 49
(23), 6449
–6465
(1989). 0008-5472 Google Scholar
P. Vaupel and
M. Hockel,
“Blood supply, oxygenation status and metabolic micromilieu of breast cancers: characterization and therapeutic relevance (review),”
Int. J. Oncol., 17
(5), 869
–879
(2000). 1019-6439 Google Scholar
|


