|
|
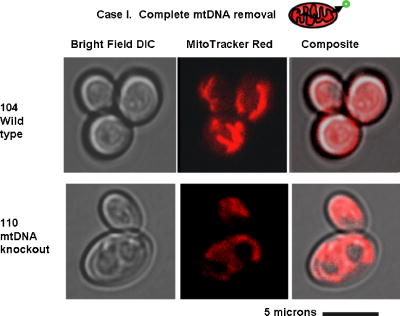
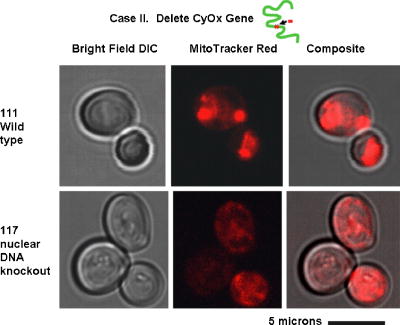
1.IntroductionNew light sources derived from semiconductor nanolasers offer efficient new tools for bioanalytical spectroscopy because they are small, easily integrated with microfluidics, and are well adapted to flow spectrocytometry and high-speed analysis.1 Importantly, no fluorescent probes are needed, so specimens can be analyzed in minutes with no special preparation for rapid front-end screening of specimen spectral properties. In this work, we apply these new tools for high-speed statistical analysis of yeast cell biomolecular composition. Of particular interest are the statistical variations of yeast and mitochondria determined in a biocavity laser. The father of modern biological statistics was Gossett (1876–1937), who developeded the Student’s t-test for assessing properties of a statistically small sample.2 He measured the concentration of yeast cells using a microscope and hemocytometer as a way of determining how closely the yeast cell content of a particular batch of beer corresponded to the brewery’s standard. The present studies are a modern adaptation of Gossett’s initial studies some ago, as the biomolecular composition and spatial organization are measured in cells and mitochondria with a biocavity laser. The results of this study have applications for basic cell biology, cell culture, detection of disease, environmental screening of toxins, pharmaceuticals, agricultural, and fermentation processes. The biocavity laser was used to measure , a laser wavelength shift arising from loading a microlaser cavity with a cell or mitochondrion. This shift arises from the optical density of a cell or a mitochondrion that is a unique biophysical property that reflects their physical size and biomolecular composition (through the refractive index). As such, is a uniquely powerful parameter that integrates the “omic” state—genomics, proteomics, lipidomics, glycomics, and metabolomics—of single cells and mitochondria, and the subcellular organization of these biomolecular structures. For theoretical computation, the laser shift can be viewed as a frequency detuning of the cavity resonance in dimensionless units as , where and are the fluid-filled cavity (without cell) resonance wavelength and frequency, respectively. Experimentally, is measured in nanometers as the difference between a longitudinal laser mode of the fluid-filled cavity and the red-shifted laser wavelength produced by flowing cells or mitochondria through the cavity. The statistical variation of within each population was studied and modeled. The population distributions of produced by wild-type and mutant cells and mitochondria showed striking differences in symmetry and shape, permitting the rapid diagnosis of healthy and disease states. Wild-type cells and mitochondria produced near-Gaussian distributions with a single peak and short tails that were nearly symmetric. In contrast, mutant cells and mitochondria produced leptokurtotic distributions that were asymmetric and highly skewed to the right. These features reflect a new state of stressed or diseased cells that have undergone what we call a reactive biomolecular divergence (RBD), whereby the normally small statistical variance of increased by a thousand-fold! This divergent state is a biophysical consequence of dramatic changes that occur in the “omic” state and subcellular organization of healthy cells under stress, or in disease states that produce cellular dysfunction. We discovered that all four distributions could be self-consistently modeled with a single, log-normal distribution function. In addition, we discovered that the reactive biomolecular divergence of sick and stressed mitochondria cascaded to a parallel RBD in the cell as a whole, reflecting the vital interdependence of mitochondria and the nucleus. These results indicate that the biocavity laser is a uniquely powerful new tool for studying cells and organelles in health, stress, and disease. Yeast (Saccharomyces cerevisiae, common and brewers yeast) are unicellular fungi that multiply as single cells by budding. Yeast cells are easy to grow and to genetically alter, and their basic cell mechanics (replication, recombination, cell division, and metabolism) form a model for human cells. They are well suited for genetic research, and a genetic code was completed in 1996.3 It reveals some 6000 genes arranged on 16 chromosomes. Mitochondria are key regulators of the cellular metabolic network and play a pivotal role in orchestrating both ultradian cycles and adaptive physiologic changes with the nucleus through processes that regulate cellular redox.4 Mitochondria help to sense and respond to the physical and chemical changes produced by changes in environmental conditions by communicating with the nucleus via the retrograde response.5 This communication allows the cell to match metabolic supply and demand, and to respond to threats that endanger health by altering its biophysical state. The biophysical state of a cell is a reflection of its “omic” profile, which in turn results from the sum total of changes in biomolecular composition and subcellular organization of structures within the cell. It is dictated by changes in the genomics, proteomics, lipidomics, glycomics, and metabolomics that are coordinated between the cytoplasm and the nucleus. The biophysical state of the cell determines its functionality, health, fitness, and disease, and entrains dynamic processes such as apoptosis and cell division. We developed the biocavity laser to quantify the biophysical state of cells and their isolated mitochondria. In this work, we report our discovery that the degree of health or disease at the cellular level can be quantified by biocavity laser spectroscopy. 2.Specimen PreparationWe examined two normal wild-type yeast and their mutants to assess the effect of fundamental mitochondrial perturbations by biocavity laser spectroscopy. A schematic of the genetic changes induced in the two strains is shown in Fig. 1 . In case 1, the normal strain 1046 is a wild-type strain of Saccharomyces cerevisiae. Strain 1107 was derived from strain 104 by removal of its mitochondrial DNA (mtDNA). This was accomplished by exposing the whole cell to ethidium bromide, which binds to mtDNA such that it cannot replicate and is entirely eliminated in successive generations of cell growth [Fig. 1b]. Removal of mtDNA causes strain 110 to grow as a petite , named because it forms small colonies (of fewer cells because it grows more slowly) on agar plates supplemented with a variety of different carbon sources. The absence of mitochondrial DNA results in the complete loss of all the mtDNA-encoded proteins and RNAs, and loss of the pigmented, heme-containing cytochromes a and b. These cells have mitochondria, but the mitochondria lack the normal respiratory chain complexes 1, 3, 4, and 5. Complex 2 (succinate dehydrogenase) is preserved because its subunits are encoded by genes located in nuclear DNA. A second mutant strain (case 2, strain 117)8 was produced from wild-type 1119 by disrupting the nuclear gene for the Cox4 protein [Fig. 1c]. This is a less severe modification that eliminates only complex 4 of the respiratory chain. The yeast cells were grown in liquid media overnight at room temperature to achieve exponential growth, with raffinose as the nonrepressive carbon source. Cell suspensions were collected for analysis, or the mitochondria were isolated by cell disruption in a French press, followed by differential centrifugation. To optimize statistics, the specimens were concentrated about for microscopy and diluted for laser spectroscopy to achieve particle densities of about and , respectively. Fig. 1Schematic diagram showing (a) the whole yeast cell and the locus of nuclear and mitochondrial DNA. (b) Case 1 genetic alteration by complete removal of mitochondrial DNA. (c) Case 2 inactivation of cytochrome oxidase forming gene in the nucleus. (d) Specimen designation numbers for the two different cases of genetic alterations in the yeast cells. 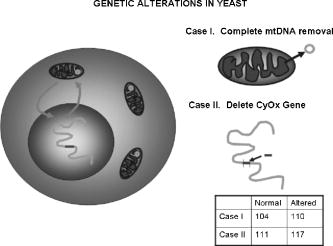 3.Laser Scanning MicroscopyThe size distribution and morphology of wild-type 104 yeast cell isolated mitochondria are shown in Fig. 2 . Figure 2a was obtained by laser scanning Nomarski differential interference contrast at and objective. The yeast cells are typically round to oval, and exhibit average diameters that vary between for both strains. The nucleus is evident in most cell images and has a diameter of about . Internal granules are also evident in most cells. Figure 2b was recorded with excitation of mitotracker red probe emitting at and a oil immersion objective. Isolated mitochondria are spherical in shape after removal from the cell. Fig. 2Laser scanning micrographs of (a) wild-type yeast cells and (b) isolated mitochondria. The size distributions were measured and recorded in histograms for (c) cells and (d) mitochondria. 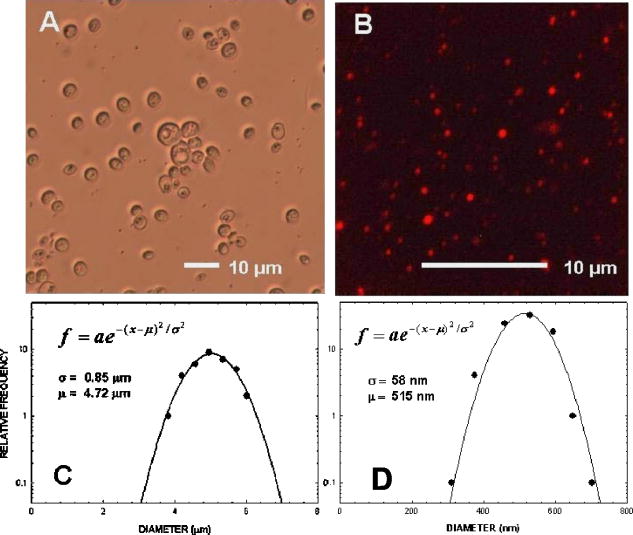 It is also important to determine how the cells and mitochondria are distributed in size, as this provides insight into the regulation of cell growth and division. Also, it could have an influence on the laser spectra to follow. Using micrographs and custom software implementing machine vision techniques, a number of cells and mitochondria were measured for size and shape. The results are shown in the histograms in Figs. 2c and 2d. Note that the average cell diameter is about with a coefficient of variation of about 17%. The mitochondria exhibit an average diameter of about and coefficient of variation of about 12%. Both distributions were fit numerically with normal (Gaussian) distributed random variables [solid lines in Figs. 2c and 2d]. On the semilog plots in Fig. 2, these fitting functions are inverted parabolas with limbs representing the tails of the distribution that diminished rapidly away from the mean. The relatively small values for the standard deviations indicate that the cell and mitochondria sizes are highly regulated, and their variation will have only a small effect on the spectroscopy to follow. Detailed images of all cell strains were also obtained by laser-scanning microscopy using a Zeiss LSM 510 system with excitation. Laser-scanned brightfield, mitotracker red fluorescence and composite images are shown in Figs. 3 and 4 for cases 1 and 2, respectively. For both wild-type cells in Figs. 3 and 4, the mitotracker red fluorescence is much more intense and spatially more discrete. Also, the variety of mitochondria morphology is evident. It is thread-like in wild-type 104, but more ball-like in wild-type 111. In contrast, both the 110 and 117 genetically modified cells exhibit low fluoresence intensity that is spatially much more diffuse, making it hard to resolve individual mitochondria in these cells. These images suggest that the mitochondria in the mutant cells are less functional than in the wild-type cells and have lost metabolic cooperativity. 4.Biocavity Laser SpectroscopyBiocavity laser spectroscopy employs a flow of single cells or mitochondria through an intracavity laser region, and generates spectra that characterize the cell morphology and biomolecular content. It has been described previously.10, 11 The biocavity laser comprises a sophisticated semiconductor wafer that emits in the near-infrared range, at about . The wafer is integrated with a microfluidic glass chip about the size of a dime (photograph in Fig. 5 ) to form a closed cavity with high-quality optical resonance required for lasing. The cavity is formed between reflective multilayers in the semiconductor and dielectric mirror on the glass (Fig. 5). The cavity spacing is on the order of the cell or mitochondrion size, and is formed by dry etching channels into the glass substrate. The microfluidic chip comprises inlet and outlet ports, reservoirs, and microchannels to entrain cells to flow one at a time through the lasing region where they are analyzed. When a cell flows through this cavity, it acts as an internal waveguide, permitting light to bounce between the mirrors, and permitting the cell to be sampled hundreds of times during its course through the chamber. The waveguiding of the rays of light reflected back through the cell establishes an image of the transverse cell modes within the semiconductor gain region. Because the refractive index of the cell is higher than that of the bare fluid, the spectrum is red shifted with respect to the bare fluid spectral peak [top arrow in Fig. 5a] and comprises a series of spectral peaks from the cytoplasmic and nuclear modes [Fig. 5a]. Peak spacing, intensity, and the spectral shift are sensitively dependent on the cell size, shape, and biochemistry (protein packing and membrane complexity), respectively. The laser also works with smaller bacterial cells or mitochondria, in a process where light is “nano-squeezed” through the organelle and a single lasing mode is supported. This results in a discrete band of laser light produced [Fig. 5b] and a simpler spectrum to analyze compared to whole cells. The band is red shifted by from the bare fluid reference peak [Fig. 5b]. Fig. 5Top photograph: the biocavity laser microfluidic chip. Cells are introduced and exit via the capillary tubes at the right and left of the flow chip. Lower diagrams: schematic of the biocavity laser flow chip and example spectra of eukaryotic and prokaryotic cells. The layers of the chip are labeled from bottom to top: gallium-arsenide substrate (gray), semiconductor mirror (light red), optical gain region (red), fluid cavity (blue), dielectric mirror (pink), and glass substrate (green). (a) Typical spectrum of a liver cell. (b) Typical spectrum of a mitochondrion. (Color online only.)  Experiments were performed to demonstrate the utility of biocavity laser spectroscopy to rapidly measure the effect of genetic disturbances in mitochondrial function. Cells and mitochondria were suspended in phosphate buffered saline (PBS) without calcium or magnesium and flowed through the biocavity laser. Spectra were collected and the resulting laser peak shifts (relative to fluid only) were analyzed. Delta is measured in nanometers as the difference between the reference wavelength of the biocavity laser, and the wavelength of red-shifted laser light that cells or mitochondria emit as they flow through the biocavity laser. It is a function of the refractive index difference between the cells or mitochondria, and the surrounding aqueous medium (PBS) and particle size. Since refractive index is a function of biomolecular composition and concentration, and subcellular organization, cells and mitochondria that contain more densely packed proteins, especially cytochromes, will show greater peak shifts. Figure 6 shows histograms of laser wavelength shifts for whole yeast cells. Figures 6a and 6b show the frequency distributions of intact cells from wild-type (104 ) yeast on linear and semilog plots. Figure 6a shows that the distribution is peaked similar to a normal Gaussian distribution. However, the semilog plot in Fig. 6b, shown to scrutinize the shape of the distribution in greater detail, reveals a long exponential tail falling at a rate of (Table 1 ) to higher wavelengths. A normal distribution would exhibit a more dramatic cutoff as an inverted parabolic profile, not a linear fall, as viewed on a semilog plot. Thus, is not necessarily a normally distributed parameter in living cells and mitochondria. Figures 6c and 6d show the results for yeast that lack mitochondrial DNA (110 ). In contrast to Fig. 6a, the petite cell exhibits a highly skewed distribution with low average laser wavelength shift. Interestingly, this distribution has an even longer exponential tail that falls at (Table 1). Figure 7 shows corresponding histograms of laser wavelength shifts for isolated mitochondria. Figures 7a and 7b show the frequency distributions of mitochondria isolated from wild-type (104 ) cells on linear and semilog plots. Figures 7c and 7d show the results for mitochondria that lack mtDNA (110 ). These distributions are self-similar to those in Fig. 6, though they are scaled to lower wavelength by a factor of about 2.5. Strikingly, these distributions also exhibit long exponential tails. The fall rate for the strain mitochondria is (Table 1). On the other hand, the rate for the strain mitochondria is (Table 1). All distributions in Figs. 6 and 7 exhibit tails that grow with removal of mtDNA. Also, the similar shapes of the distributions between mitochondria and cells suggest that the statistics of the isolated mitochondria are similar to the statistics of the whole cell. This indicates that changes in the biomolecular composition of mitochondria have a cascading effect on the biomolecular composition of the whole cell. The distribution shows that changes in mitochondrial function produce a cascade of reactive changes in the biochemistry of the cell. We call this phenomenon reactive biomolecular divergence (RBD) for reasons to be described later in the text. Fig. 6Histograms of laser wavelength shifts for whole yeast cells. (a) and (b) show the frequency distributions of intact cells from wild-type (104 ) yeast on linear and semilog plots. (c) and (d) show the results for yeast that lack mitochondrial DNA (110 ). 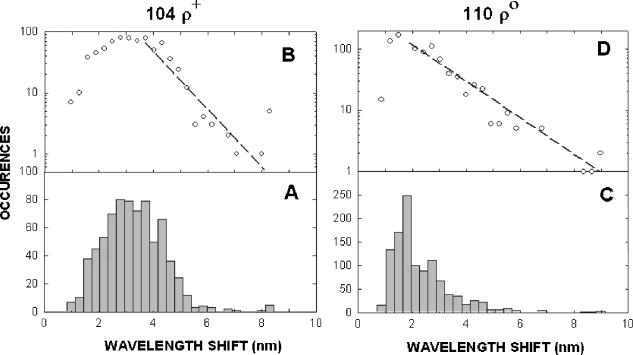 Fig. 7Histograms of laser wavelength shifts for isolated mitochondria. (a) and (b) show the frequency distributions of mitochondria from wild-type (104 ) cells on linear and semilog plots. (c) and (d) show the results for mitochondria that lack DNA (110 ).  Table 1Descriptive statistics. Right tail slope is quantified by least squares regression analysis of right-skewed tail in the Δ population distribution, plotted as the log of the frequency in the y axis and Δ in nanometers in the x axis.
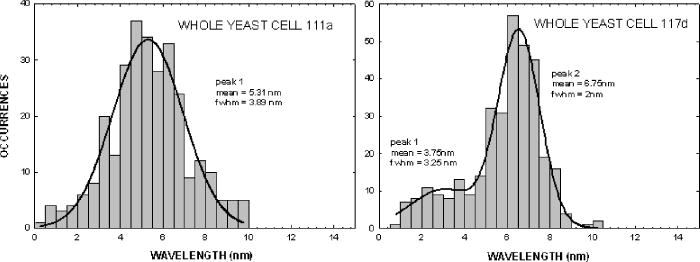
The same flow experiments were repeated for the second pair of yeast strains. The mutant was derived from the wild-type by insertional interruption of the Cox4 gene in the nucleus. The data and statistics here are more limited, and isolated mitochondria were not studied. In Fig. 8a , the frequency distribution for the wild type 111 exhibits a Gaussian-like peak centered near , but the tail was not studied in detail to confirm the distribution type. The mutant 117 specimen exhibits a bimodal distribution with peaks near 3.8 and , and the overall mean is near , close to that of the wild type. The presence of two peaks suggests a heterogeneous distribution of cells. This separation of peaks arises because the yeast cells are slightly larger and the buds smaller (as observed in microscopy), such that they can be resolved in the latter distribution. 5.Interpreting the DistributionsTo measure the distributions of biomolecules, we have employed a biocavity laser technique to measure the parameter . Delta is a function of the refraction index, a quantity that is closely related to the cell biomolecular composition, concentration, and particle size. Although the technique has been described previously,10, 12 it is discussed in some detail here. The laser spectra are basically Maxwell’s equations solved for the case of an internal semiconductor light source within a planar microcavity.13 The emitted light is an oscillatory function of the parameter , where is the wavelength of light. The transmittance spectra of the microcavity exhibit a series of narrow longitudinal transmittance modes. Also, the spectral band of spontaneous emission from the semiconductor overlaps a few of these modes, thereby allowing lasing at these wavelengths. When the internal refractive index is increased (say, by the addition of a cell to the microcavity), the emitted light mode will experience a red shift in proportion to the index change. The red shift is a function of the cell and cavity geometry and optical parameters, and the general 3-D case can be analyzed by finite element methods. The mitochondrion in the cavity was approximated by a sphere centered in a rectangular box with boundary conditions chosen to simulate the laser cavity. The frequency of the fundamental mode was computed by finite element methods as a function of sphere diameter, refractive index, and cavity length. The results show that the red shift is given approximately by , where is the refractive index difference of the cell relative to the index of the fluid, is the cell diameter, the laser wavelength, is the effective cavity length, and is an electromagnetic volume fraction for mitochondria determined by the finite element calculations.14 Thus, the red shift is proportional to , which in turn is a sum over biomolecule contributions. In the experiments the induced by a yeast cell or isolated mitochondrion was studied as population distributions shown in Figs. 6 and 7. The laser technique has two important features. First, it is sensitive to very small changes in biomolecular composition of cells. Tiny changes in laser wavelength can be detected, since the laser linewidth is very narrow, on the order of . So, we expect to be able to detect small biomolecular changes that occur with genetic manipulation. Second, the laser is sensitive to very small objects like mitochondria, and exploits a newly discovered nano-optical transduction method.15 Basically, this ultrasensitive detection of submicron particles uses “nano-squeezing” of light into photon modes imposed by ultrasmall dimensions in a submicron laser cavity. The condition for nano-squeezing is that the organelle must be approximately smaller than the wavelength of light. This is a critical advantage of the biocavity laser. Because the mitochondria are so tiny (about in diameter), it has been difficult to study them using standard light microscope or flow cytometry techniques. And, electron or atomic force microscopies are limited to nonviable fixed organelles, so they cannot reproduce physiologic measurements. Thus, the biocavity laser is an ideal tool for studying biomolecular changes in metabolically active mitochondria. 6.Refractive Index and BiomoleculesThe speed of light through a biofluid or biological cell is inversely related to the biomolecular concentration. By flowing a fluid or cells through a semiconductor microcavity laser, these decreases in light speed can be observed as small wavelength red shifts in the emitted laser output spectrum. Barer16 has shown a linear relationship between the refractive index and the biomolecular concentration as , where is the index of the solvent, is the specific refractive increment of the molecule, and is the concentration in grams per . A change in index arises from a change in concentration in a particular molecular species. In general, the refractive index is related to the molecular absorption coefficient , where is the molecular extinction coefficient and is the molecular concentration, by the Kramers-Kronig relationship,17, 18 where is the principle value of the complex integral over photon energy , is Planck’s constant, and is the speed of light. To illustrate these ideas, we have calculated the refractive index change as a function of wavelength for a cytochrome c molecule absorbing near with a peak width of . The index change (in units of ) is shown in Fig. 9 . The plot exhibits a divergence near the peak wavelength that is limited to finite values by a damping factor. The change near is about due to a single cytochrome c specie. Summing all of the cytochromes in Table 2 and converting to refractive index gives a change in index of about 0.007, about 10% of the dry weight contribution in mitochondria.Fig. 9Computed refractive index change for a cytochrome absorption peak near with bandwidth of , in units of .  Table 2Summary of abundance and optical absorption of biomolecules in mitochondria.
We have repeated this calculation to estimate the refractive changes for other biomolecules. The change in the refractive index at (in units of ) for a absorption peak located at different spectral positions spanning the ultraviolet to near-infrared was computed from Eq. 1 and is shown in Fig. 10 . The shaded bands represent regions where proteins, nucleic acids, and cytochromes absorb. Because of its spectral proximity to the measured wavelength, the spectral weighting of the cytochromes is about ten times higher than that from other biomolecular species like proteins and DNA. Fig. 10Change in the refractive index at (in units of ) for a absorption peak located at different spectral positions spanning the ultraviolet to near-infrared. The shaded bands represent regions where proteins, nucleic acids, and cytochromes absorb. 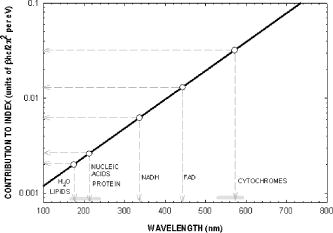 The refractive properties of biomolecules originate in the electronic structure of their internal chemical bonds. Protein molecules possess covalent bonds that absorb strongly in the ultraviolet, but are transparent in the visible and near-infrared region where most semiconductor materials emit. For proteins in general, the -electron systems are the main origin of absorption in the region. In small -electron systems of proteins, the absorption maximum occurs in the range . The larger -electron systems of the nucleic acid base units absorb near and longer. The more extended larger -electron systems of -carotene absorb between 400 and . Absorption beyond occurs in the very large -electron system of the porphyrin rings, important in natural pigments like chlorophyll, heme, and cytochrome oxidase found in mitochondria. Previous experiments have shown that cytochrome complexes play an important role in the absorption spectra of cells and solubilized mitochondria in the visible19, 20 and near-infrared.21, 22 These complexes comprise metal porphyrin rings and large bonds that delocalize electrons, lowering optical transition energies into the visible range, between . We have measured and confirmed the existence of this absorption in isolated and solubilized yeast mitochondria.23 Whole cells comprise a complex milieu of thousands of molecule types, including the cyclical molecular complexes and metal-containing porphyrin rings. A detailed listing of the major classes of biomolecules in mitochondria are presented in Table 2. The table includes spectral absorption properties of biomolecular species and estimated concentration in mitochondria. The metal content of cells and mitochondria is found principally in the cytochrome complexes responsible for the respiratory chain. The large systems of cytochrome complexes play an important role in determining the refractive index near , where the biocavity laser operates. And, each of the cytochrome molecules contributes to the refractive index at this laser wavelength, making it a sensitive measure of total cytochrome content. When certain genes are deleted or altered in mitochondria, fundamental changes occur in cytochrome content and other pigmented molecules, leading to changes in the refractive index that can be quantified by the lasing spectra. The refractive index contribution from a biomolecule increases as the product of the spectral weighting due to absorption in Eq. 1, and its concentration or biomolecular abundance in the mitochondrion. To connect spectral properties with biomolecular abundance, we have composed Fig. 11 to estimate the spectral weight of a biomolecule (determined from Fig. 10 as it contributes to the near-IR refractive index at ) as a function of the weight fraction in the mitochondrion as a whole. The latter quantity is taken from literature values or best estimates and includes a range of uncertainty (represented by the horizontal error bars). Some structural biomolecules and osmolytes are tightly regulated by homeostasis, i.e., total water, protein, lipids, and salt concentration, and exhibit very small uncertainty in abundance. These biomolecules form the basic cell structure and chemistry, and if altered radically, preclude cell viability. On the other hand, metabolic enzymes and metabolites exhibit a larger variation in abundance due to the existence of a wide dynamic range in respiratory states of the mitochondrion. Some of these biomolecules vary several orders of magnitude in concentration without changing the basic structure or viability of the cell. This is reasonable because they occur in much lower abundance than the structural biomolecules. Fig. 11Spectral weight versus fractional composition in organelle for biomolecules in mitochondria. The dashed lines are optical density (product of spectral weight and weight fraction) and are labeled in relative orders of magnitude.  Molecules with high spectral weight and abundance yield the highest optical density. In Fig. 11, we have also plotted isoclines of constant optical density (inclined dashed lines) that increase in value to the upper right-hand side of the diagram. Most of the functional structural molecules have high concentration but low spectral weight. On the other hand, respiratory enzymes containing pigmented biomolecules like cytochrome c, , and NAD(P)H have high spectral weight but low abundance. Water is the primary contributor to the refractive index (accounting for 0.333), followed by structural proteins (about 0.06 to 0.08), cytochromes (about 0.007), and lipids and carbohydrates . The cytochromes stand out as unusual biomolecules because they are present in lower abundance but have the highest spectral weight for the refractive index at the laser wavelength of . 7.Thermodynamics and Statistical Distributions in Cells and MitochondriaA basic biological function of the cell membrane is the selective uptake of ions or molecules from the environment to concentrate them in the interior and assemble them into new biomolecules for increasing the cell functionality. A variety of passive and active mechanisms are used to establish these concentration differences, which in turn produce a differential pressure across the membrane. In the present case, we consider the small differential pressure arising from biomolecules in a cell placed in a phosphate-buffered salt solution (PBS). In thermodynamic terms, we can define a function that is the probability of finding a cell with a given biomolecular concentration at a temperature surrounded by a solution of concentration . We can use the theory of dilute solutions to illustrate this model. The osmotic pressure, here used loosely for any molecule enclosed by a semipermeable boundary, is , which is the well known van’t Hoff relation.24 The net energy to raise the concentration from to against the diffusive force is , where is the cell volume. If an ensemble of cells was treated in analogy to a population of particles in thermal equilibrium, the chemical potentials of the cytosols of each cell would be equal to the chemical potential of the exterior solution. In this case, the differential probability of finding a cell with energy is proportional to . The probability distribution would take the form , where is the number of molecules. is the number of accessible states, a rapidly increasing function of conspiring with the exponential to produce a sharply peaked function in . These arguments apply to precursor molecules and to biomolecules assembled from them. Statistical physics25 shows that we can describe this peaked function as the fluctuations in similar to fluctuations of particles in a gas or solutes in a dilute solution. The distribution in a fixed volume is where is the total number of solute particles and is the mean value of . This distribution assumes that the volume of the cell is sufficiently large, so that the deviation is small compared with . This is the case for large cells that contain the order of , like hemoglobin proteins in a red blood cell. There may be additional homeostatic regulatory mechanisms that place other restrictions on the deviations. On the other hand, there may be cells or organelles of much smaller volume, such that the deviation is large compared to the mean. In this case, the distribution is given by Poisson’s formula,In this case, the distribution exhibits an asymmetric shape with a cutoff near low and a long tail for high values of . In the present study, mitochondria have volume with the number of biomolecules of a given prevalent type (from Fig. 11) ranging from to . Yeast cells have volume and biomolecules numbers some 3 orders of magnitude higher.8.Distribution Functions for Isolated MitochondriaAt first glance, Figs. 6 and 7 suggest that wild-type mitochondria and cells exhibit a Gaussian distribution and that the mutant mitochondria and cells exhibit a Poisson-like distribution. However, the distributions of Eqs. 2, 3 do not fit the data, especially the long exponential tails extending to longer wavelengths. The actual distribution is more complicated, because the measured variable depends on the product of the particle diameter and index difference as , where and is an electromagnetic volume factor for mitochondria.14 Thus, we expect to be the product of two independent and randomly distributed variables, the mitochondrial size and its refractive index. We have already seen that (and hence the volume ) is a normally distributed variable in Fig. 2. Using Fig. 11 to estimate the refractive index of cells and mitochondria, we can derive the following equation, where is the specific refractive increment for biomolecule (relative contributions vary, as shown in Figs. 10 and 11) and is its concentration, and the sum is over all biomolecules. If the are normally distributed variables (since and from Eq. 2 are), then so is , with and . The distribution then takes the form of a convolution integral of variables (distributed with mean and deviation ) and (distributed with mean and deviation ),This equation can be simplified by a logarithmic transformation of into a log-normal distribution,26 which takes the formwhere is the fitting variable, and and are the log-normal fitting parameters. Equation 6 provides the best self-consistent fitting function to all of these data. The results (solid lines) are shown in Fig. 12 in log-log plots that now provide an explanation of the shapes of the distribution functions arising from a physical optics interpretation. The single fitting function of Eq. 6 with only two adjustable shape parameters describes the data much better than Gaussian or Poisson functions (dotted lines in Fig. 12). Using the log-normal transformations and , we find the physical mean, standard deviation, and variance of , which are all summarized in Table 3 .Fig. 12Log-log plots of data (points) for isolated mitochondrial samples 104 (left) and 110 (right) and best-fit log-normal fitting function. Best-fit parameters are shown tabulated in each figure. Subpopulations (not included in fit) are indicated with arrows. The dotted lines are best fits using (a) Gaussian and (b) Poissonian. 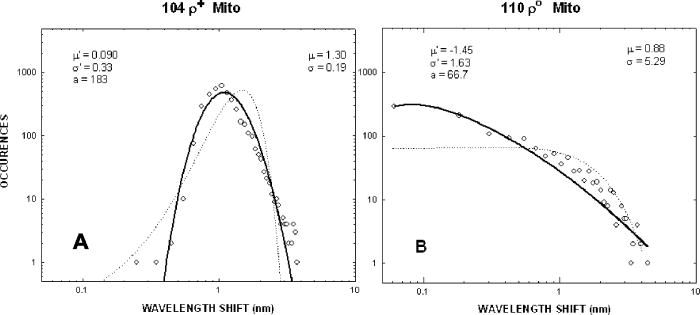 In Table 3, the most dramatic change occurs in the mitochondrial variance of from 0.036 for 104 to 27.9 for 110 . This represents a nearly 1000-fold increase in variance and suggests a spectacular change in the biomolecular composition when mitochondrial function is disturbed! This far exceeds the meager 10% spread arising from mitochondrial diameter contribution to variance (0.12). The explanation for this dramatic increase is given by large changes in given by Eq. 4. Despite the high molar extinction coefficients and relatively high abundance of cytochromes in mitochondria (Fig. 11), cytochrome content alone does not account for the 1000-fold changes observed in the distribution. If the cytochrome contribution to Eq. 4 were removed and all other background concentrations remained constant, the distribution for would simply collapse, giving a lower mean and lower variance (i.e., the measured variance of 104 already includes the variance of the cytochromes and background). Instead, the background concentrations of the terms present to the right in Eq. 4 must increase by orders of magnitude to account for the measured changes. These myriad changes in the biomolecular composition of cells and mitochondria result from a cascading effect of reactive changes that occur with mitochondrial dysfunction. We call this reactive biomolecular divergence (RBD). RBD is easily measured in the biocavity laser and correlates with the massive changes that occur in the “omic” state of cells under stress, which has been described by others.27 Finally, we can now describe the distributions produced by whole cells. Figures 6 and 7 reveal the self-similarity of the cell wavelength shift distribution to that of the individual mitochondrial distribution. Intuition immediately suggests that the cell distribution is determined by the organelle distribution. However, a closer inspection shows that the tails of the cell distributions fall at least slower than those for the organelle. Further, the volume fraction , where the organelle volume relative to the total cell volume is much less than 1. This reduces the organelle contribution to the physical optics of the cell. An accounting of these effects gives the cell wavelength shift as, where is the number of mitochondria per yeast cell (described by a sparse Poisson distribution with mean between 3 to 6, as estimated from microscopy), is the index of the mitochondria relative to PBS, , is another electromagnetic volume factor for whole cells,20 is the diameter of the whole cell, and is the index of the whole cell relative to PBS without mitochondria. The first term is a product of normally distributed variables , , and , and is log-normally distributed. The second term is a product of two normally distributed variables (measured in Fig. 2) and , and is similarly log-normally distributed. Since Eq. 6 is the sum of two log-normally distributed products, its variance is likewise the sum of the two component variances. Figure 13 shows that log-normal distribution functions accurately fit the whole yeast cell data of Fig. 6. The best-fit parameters are summarized in Table 3.Fig. 13Log-log plots of data (points) for whole yeast cells 104 (left) and 110 (right) and best-fit log-normal fitting functions (solid lines). Best-fit log-normal parameters (primed variables) are in the upper left and transformed standard parameters (mean and standard deviation) are shown in the upper right of each figure.  Table 3Summary of statistical parameters used in fitting data.
Our best estimates show that the second term in Eq. 7 is about ten times larger than the first. Thus, the measured changes in variance induced by mitochondrial dysfunction in the whole cell are mostly due to the variance in the extra-mitochondrial biomolecules. This is evident in Table 3, as the variance increases about six-fold from the 104 cell to the 110 cell. These observations indicate that the reactive biomolecular divergence of stressed mitochondria cascaded to a parallel RBD in the cell as a whole, reflecting the vital interdependence of the mitochondria and nucleus. 9.SummaryThe mitochondrion’s optical properties are a function of its biomolecular composition. Removal of either mitochondrial DNA or a nuclear gene required for assembly of cytochrome c oxidase (Cox4) results in radical changes in the measured distribution of spectral changes in the biophysical optical parameter of mitochondria measured in the biocavity laser. These changes in mitochondria produced a cascading effect in the distribution , measured for the whole cells containing those altered mitochondria. The shift from a peaked distribution [Figs. 7a and 7b] to a skewed and leptokurtotic [Figs. 7c and 7d] distribution also implies a fundamental change in the distribution of the remaining biomolecules in the mitochondria. If the dominant cytochromes (high , low ) are removed and the less dominant background biomolecules (low , high ) remain unchanged in mean concentration and standard deviation, then both the mean and standard deviation of the milieu would decrease, the former significantly and the latter slightly. The experiments show, in fact, that the mean decreases, but the deviation increases dramatically. This implies that the composition and concentration of the background molecules are changed significantly, characteristic of the altered biochemical state of the cell in a stressed condition. We called this phenomenon, measured in a biocavity laser, a reactive biomolecular divergence. These observations also suggest changes in the way that the cells, and the mitochondria within them, interact during growth. Correlated growth, of the type that results from cell-cell communication and metabolic cooperativity, would be predicted to result in a peaked distribution of the type produced by wild-type cells that are autocorrelated. Less correlated, more independent growth of both cells and the mitochondria within them would be predicted to result in a more skewed distribution as growth of cells became completely independent and uncorrelated. Interestingly, we observed a similar shift from correlated to uncorrelated light scattering in mitochondria from normal and cancer cells.28 The biocavity laser represents a unique and powerful new tool for the rapid analysis of cells and mitochondria. In the measurements reported here, we discover that mitochondrial dysfunction resulting from genetic changes in either mtDNA or nuclear DNA not only reduces the refractive index (primarily a function of protein and cytochrome density) in the mutant cells and mitochondria, but also changes the remaining biomolecular composition of both the mitochondria and whole cell. The quantitative reduction in magnitude is expected. However, the striking change in the pattern of the frequency distributions is not. By studying mitochondria from cells with genetically and biochemically defined abnormalities, we hope to develop the biocavity laser into a powerful analytical tool for studying disease in general. The biocavity laser permits the precise measurement of a powerful new parameter of cells and mitochondria. Unlike any other single chemical or biophysical measurement, is a measure of the overall biophysical state of the cell and mitochondria. The biophysical state of a cell is a reflection of its “omic” profile—genomics, proteomics, lipidomics, glycomics, and metabolomics—which in turn results from the sum total of changes in biomolecular composition and subcellular organization of structures within the cell. This tool is unique in its ability to probe the interface between statistical thermodynamics and cell growth and respiration, to allow quantitative testing of new biophysical models of cells. AcknowledgmentsGourley is supported by the Office of Basic Energy Sciences of the Department of Energy. Sandia National Laboratory is a multiprogram laboratory operated by Sandia Corporation, a Lockheed Martin Company, for the U.S. Department of Energy NNSA under contract DEAC04-94AL85000. Yaffe was supported by NIH grant GM44614. Naviaux is supported by the UCSD Foundation Christini Fund. ReferencesP. L. Gourley,
“Brief overview of biomicronanotechnologies,”
Biotechnol. Prog., 21 2
–10
(2005). https://doi.org/10.1021/bp0498239 8756-7938 Google Scholar
E. S. Pearson, Student—A Statistical Biography of William Sealey Gosset, Oxford Press, New York
(1990). Google Scholar
B. G. Barrell,
A. Goffeau,
H. Bussey,
R. W. Davis,
B. Dujon,
H. Feldmann,
F. Galibert,
J. D. Hoheisel,
C. Jacq,
M. Johnston,
E. J. Louis,
H. W. Mewes,
Y. Murakami,
P. Philippsen,
H. Tettelin, and
S. G. Oliver,
“Life with 6000 genes,”
Science, 274
(546), 563
–567
(1996). 0036-8075 Google Scholar
D. Murray and
D. B. Lloyd,
“The temporal architecture of eukaryotic growth,”
FEBS Lett., 580 2830
–2835
(2006). https://doi.org/10.1016/j.febslet.2006.02.066 0014-5793 Google Scholar
R. A. Butow,
“Mitochondrial signaling: the retrograde response,”
Mol. Cell, 14 1
–15
(2004). https://doi.org/10.1016/S1097-2765(04)00179-0 1097-2765 Google Scholar
B. Meyhack,
W. Bajwa,
H. Rudolph, and
A. Hinnen,
“Two yeast acid phosphatase structural genes are the result of a tandem duplication and show different degrees of homology in their promoter and coding sequences,”
EMBO J., 1 675
–680
(1982). 0261-4189 Google Scholar
M. P. Yaffe and
G. Schatz,
“Two nuclear mutations that block mitochondrial protein import in yeast,”
Proc. Natl. Acad. Sci. U.S.A., 81 4819
–4823
(1984). https://doi.org/10.1073/pnas.81.15.4819 0027-8424 Google Scholar
W. Dowhan,
C. R. Bibus, and
G. Schatz,
“The cytoplasmically-made subunit IV is necessary for assembly of cytochrome c oxidase in yeast,”
EMBO J., 4 179
–184
(1985). 0261-4189 Google Scholar
E. Van Eijk,
A. P. G. M. Van Loon, and
L. A. Grivell,
“Biosynthesis of the ubiquinol-cytochrome c reductase complex in yeast. Discoordinate synthesis of the 11-kd subunit in response to increased gene copy number,”
EMBO J., 2 1765
–1770
(1983). 0261-4189 Google Scholar
P. L. Gourley,
“Biocavity laser for high-speed cell and tumor biology,”
J. Phys. D, 36
(14), R228
–R239
(2003). https://doi.org/10.1088/0022-3727/36/14/202 0022-3727 Google Scholar
P. L., R. K. Naviaux Gourley,
“Optical phenotyping of human mitochondria in a biocavity laser,”
IEEE J. Sel. Top. Quantum Electron., 7 818
–826
(2005). https://doi.org/10.1109/JSTQE.2005.857680 1077-260X Google Scholar
P. L. Gourley,
J. D. Cox,
J. K. Hendricks,
A. E. McDonald,
G. C. Copeland,
D. Y. Sasaki,
M. Curry, and
S. L. Skirboll,
“Semiconductor microcavity laser spectroscopy of intracellular protein in human cancer cells,”
Proc. SPIE, 4265 113
–125
(2001). https://doi.org/10.1117/12.427967 0277-786X Google Scholar
E. Wolf and
M. Born, Principles of Optics, Pergamon, Oxford, UK
(1980). Google Scholar
P. L. Gourley,
(2006) Google Scholar
P. L. Gourley,
P. Chen,
R. G. Copeland,
J. D. Cox,
J. K. Hendricks,
A. E. McDonald, and
D. Y. Sasaki,
“Nano-squeezed light for probing mitochondrial membrane swelling and study of neuroprotectants,”
Proc. SPIE, 5345 51
–60
(2004). https://doi.org/10.1117/12.532188 0277-786X Google Scholar
R. Barer,
“Refractometry and Interferometry of living cells,”
J. Opt. Soc. Am., 47 545
–552
(1957). 0030-3941 Google Scholar
H. A. Kramers,
“Some remarks of the theory of absorption and refraction of x-rays,”
Nature (London), 117 775
(1926). 0028-0836 Google Scholar
R. de L. Kronig,
“On the theory of dispersion of x-rays,”
J. Opt. Soc. Am., 12 547
(1926). 0030-3941 Google Scholar
P. Ludovico,
F. Rodrigues,
A. Almeida,
M. T. Silva,
A. Barrientos, and
M. Côrte-Real,
“Cytochrome release and mitochondria involvement in programmed cell death induced by acetic acid in saccharomyces cerevisiae,”
Mol. Biol. Cell, 13
(8), 2598
–2606
(2002)
(1059-1524) Google Scholar
H. Gest,
“Landmark discoveries in the trail from chemistry to cellular biochemistry, with particular reference to mileposts in research on bioenergetics,”
Biochem. Mol. Biol. Educ., 30 9
–13
(2002). 1470-8175 Google Scholar
B. Beauvoit,
T. Kitai, and
B. Chance,
“Contribution of the mitochondrial compartment to the optical properties of the rat liver: a theoretical and practical approach,”
Biophys. J., 67
(6), 2501
–2510
(1994). 0006-3495 Google Scholar
T. I. Karu,
L. V. Pyatibrat,
S. F. Kolyakov, and
N. I. Afanasyeva,
“Absorption measurements of a cell monolayer relevant to phototherapy: Reduction of cytochrome c oxidase under near IR radiation,”
J. Photochem. Photobiol., B, 81 98
–106
(2005). 1011-1344 Google Scholar
R. K. Naviaux,
(2006) Google Scholar
J. H. Van’t Hoff,
“The role of osmotic pressure in the analogy between solutions and gases,”
Z. Phys. Chem., 1 481
–508
(1887). 0942-9352 Google Scholar
L. D. Landau and
E. M. Lifshitz, Statistical Physics, 277
–279 2 ed.Pergamon Press, New York
(1970). Google Scholar
B. Lindgren, Statistical Theory, 4th ed.Chapman and Hall/CRC, Boca Raton, FL
(1993). Google Scholar
D. S. Coffey,
“Self-organization, complexity and chaos: the new biology for medicine,”
Nat. Med., 4 882
–885
(1998). 1078-8956 Google Scholar
J. K. Hendricks,
P. L. Gourley,
A. E. McDonald,
R. G. Copeland,
K. E. Barrett,
C. R. Gourley,
K. K. Singh, and
R. K. Naviaux,
“Mitochondrial correlation microscopy and nanolaser spectroscopy—new tools for biophotonic detection of cancer in single cells,”
Technol. Cancer Res. Treat., 4 585
–592
(2005). 1533-0346 Google Scholar
|
||||||||||||||||||||||||||||||||||||||||||||||||||||||||||||||||||||||||||||||||||||||||||||||||||||||||||||||||||||||||||||||||||||||||||||||||||||||||||||||||||||||||||||||||||||||||||||||||||||||||||||||||||||||||||||||||||||||||||||||||||||||||||||||||||||||||||||||||||||||||||||||||||||||||||||||||||||||||||||||||||||||||||||||||||||||||||||||||||||||||||||||||||||||||||||||||||||||||||||||||||||||