
|
|
1.IntroductionThe depth profile of a local blood region in skin tissue is an important parameter in clinical diagnosis and treatments in dermatology. Various vascular malformations have their own histopathological pattern throughout the depths of lesions and are classified by the depth profile of lesions.1 In laser treatment of port wine stains, the depth profile of a lesion may be used to optimize the pulse duration and radiant exposure of light. 1, 2, 3, 4, 5, 6, 7 Conventional methods such as magnetic resonance imaging and ultrasound imaging have been utilized for differential diagnoses of such diseases,1 but they often provide insufficient contrast between different types of soft tissue. Several techniques based on light-tissue interactions have been reported for profiling the depth of local blood region in skin tissue. Nelson 8 reported a technique for imaging the depth distribution of port wine stains using a fast infrared focal plane array camera that acquires the infrared emission due to temperature rise created by the absorption of pulsed laser radiation in blood vessels. An optoacoustic technique has also been studied for imaging a strongly absorbing region such as localized blood or bloody tissue. This technique detects a pressure wave generated by thermoerastic expansion of an absorbing object within tissue, due to a temperature rise that is induced by pulsed laser radiation. Time-resolved pressure wave signals are used to reconstruct depth profiles of the object. Various methods using the optoacoustic technique have been studied to probe depth profiles of port wine stain lesions,7 forearm veins,9 breast tumors,10 and mouse brain.11 Although those techniques are promising for in-vivo imaging of subsurface absorbing regions, all of them require a pulsed laser source, and thus, can be costly for practical uses at present. Diffuse reflectance measurements for skin tissue can be achieved with a simple apparatus, and thus have been used to evaluate physiological information of tissue, such as melanin and hemoglobin in skin tissue. 12, 13, 14, 15, 16, 17, 18, 19, 20 To deduce structural information such as the depth of a blood region, a few methods21, 22, 23 using diffusely backscattered light were also reported. Iwai and Kimura21 introduced the maximum path length for the path-length probability distribution of light backscattered from an optically turbid medium. They deduced the depth, via a numerical model of light propagation, by assuming that the maximum path length was proportional to the depth and related to measured integrated backscattered intensity. This approach, however, suffers from misestimation of the depth due to variation in the maximum path length, which is due to the oxygenation of hemoglobin. Furthermore, scanning of a source and detector set or sample is required for imaging. Jacques, Saidi, and Tittel22 reported an approach utilizing a ratio of optical densities at two isosbestic wavelengths of hemoglobin (420 and ), which make it possible to estimate the average depth of capillary network regions in dermis, independently of the oxygenation. However, it may be affected by the variation of melanin content among individuals, and has not been implemented yet for imaging modality. We have previously proposed a method,23 based on the approach by Jacques, Saidi, and Tittel, for imaging the depth of a local blood region such as veins under skin tissue. Diffuse reflectance images of skin surfaces covering a local blood region, together with the surrounding skin site at the two isosbestic wavelengths, were acquired by a charge-coupled device (CCD) camera. The concentration of melanosomes in epidermis and hemoglobin in dermis estimated from the reflectances on the surrounding skin site was used to compensate variation in the ratio of optical densities among individuals. In the present study, we expand the method for visualization of both depth and thickness of a local blood region using reflectance images acquired at three isosbestic wavelengths of 420, 585, and . A ratio of optical densities at 420- and 800-nm wavelengths is newly introduced to obtain the thickness of a blood region. Monte Carlo simulation of light transport for layered skin tissue structure specifies a relation among optical densities, depth, and thickness of the region under given concentrations of melanin in epidermis and blood in dermis. Experiments with tissue-like agar gel phantoms having a circular blood inclusion and in-vivo imaging for human veins under skin tissue are performed to confirm the ability of the method. Errors expected in the estimated depth and thickness of the blood region due to variations in scattering coefficients of skin tissue and hematocrit of blood are numerically investigated for diffuse reflectance samples generated by Monte Carlo simulation. 2.Principle2.1.Layered Skin Tissue Model for Light TransportIn this study, we treat a simple layered skin tissue model shown in Fig. 1 , where site A consists of planar epidermis and dermis, representing the common skin tissue site. Usually, the main chromophores in this site are melanosomes containing melanin at the basal layer of epidermis and hemoglobin in blood within the superficial plexus in dermis. For convenience, it is assumed that melanosomes and hemoglobin are distributed homogeneously over the epidermis and dermis, respectively. Site B, contiguous to site A, is assumed to have a local blood region within the dermis. This blood region is a target of estimation in this study. Fig. 1Multilayered skin tissue model. Site A represents the common skin region and site B has a local blood region within dermis. 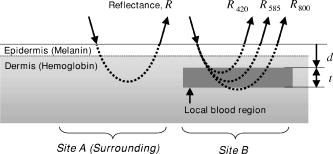 To simulate diffuse reflectance from the skin tissue, we use the Monte Carlo code developed by Wang, Jacques, and Zheng,24 in which the diffuse reflectance from multilayered tissue can be calculated. This code utilizes the Heney-Greenstein phase function. Each epidermis, dermis, and local blood region can be characterized by the scattering coefficient , absorption coefficient , anisotropy factor , and refractive index as a function of wavelength and thickness . Table 1 shows the optical parameters used for the Monte Carlo simulation in this study. The absorption coefficient of epidermis depends on the volume concentration of melanosomes in epidermis . We assumed that the absorption coefficient of a standard amount of melanosomes given in the literature25 corresponds to that of the epidermis in the case of . Then we derived the corresponding absorption coefficients of epidermis for ten different cases of to 10% at intervals of 1%, by simply proportioning it to as Table 1Optical parameters used in the Monte Carlo simulation for the skin tissue model.
Since the proposed method relies on the reflectance at isosbestic wavelengths, the absorption coefficient of dermis is independent of the oxygenation of blood. The absorption and scattering of a local blood region were set to be those of blood with 44% hematocrit (Hct). The absorption coefficient of blood was derived as where is the molar extinction coefficient of hemoglobin reported by Prahl.26 The hemoglobin concentration in blood with 44% hematocrit and the gram molecular weight of hemoglobin were set to be 150 and 65,500, respectively. In a previous study, Roggan 27 indicated that the scattering coefficients of blood increase linearly with hematocrit if . Therefore, the scattering coefficient of blood with 44%-Hct, was scaled based on the data reported for originally by Roggan, 27 We regarded that the anisotropy factor of blood at was 0.98 for in the results by Roggan 27 Furthermore, the anisotropy factors of blood at 420, 585, and are almost equal to that at in their results. Therefore, the anisotropy factor of blood was set to be 0.98 for 420, 585, and in this study.The scattering coefficients and of epidermis and dermis, respectively, were approximated by using the same relation given by Jacques,28 The anisotropy factors of and epidermis and dermis, respectively, were calculated aswhich has been reported by Gemert 29 The absorption coefficient of dermis was obtained by averaging the absorption coefficient of blood proportionally according to their volume concentration or percentage as,Therefore, the absorption coefficient of blood is assumed to be that of blood in the case of . The volume concentration of blood is usually different among individuals and may change due to the physiological condition of tissue. Jacques28 has introduced that the typical volume concentration of blood in dermis is 0.2% in the skin model where the blood distributed homogeneously over the dermis. This value of 0.2% has been referred in the Monte Carlo calculation model of skin tissue reported by Dai 30 Taking the variability of the blood concentration in dermis into account, the absorption coefficients of dermis were derived for three different concentrations of , 0.4, and 0.6%, at 420-, 585-, and 800-nm wavelengths. We define the depth as a distance from the skin surface to the upper surface of the local blood region. Both the depth and thickness of the blood region were set to be from 0.2 to at intervals of . The thicknesses and of epidermis and dermis were assumed to be 0.06 and , respectively. The refractive index for each layer is assumed to be 1.4 at the three wavelengths.18, 19 For each wavelength, therefore, the combination of and values gave 30 diffuse reflectance data for site A, whereas that of , , , and took 3000 data for site B. The total calculation time for reflectance samples was roughly for site A, whereas it was for site B, using Athlon CPU, .2.2.Empirical Formulas for the Depth and ThicknessFigure 1 also illustrates the concept of the method. An optical density at wavelength can be expressed with a diffuse reflectance of skin tissue as, In Fig. 1, for site A represents the absorption of light due to melanosomes in epidermis and hemoglobin in dermis. When a local blood region exists in skin tissue as site B, light propagated in the tissue is absorbed by hemoglobin in the region as well. Then for site B may depend on the depth and thickness of the region. For a visible to near-infrared wavelength range, both the scattering and absorption of light in skin tissue is stronger at the shorter wavelength than at the longer wavelength. Therefore, the shorter wavelength light is backscattered mainly from the superficial layer such as epidermis and reticular dermis, whereas the longer wavelength light penetrates into the deeper region of dermis.Figures 2a and 2b show the dependence of on the depth and thickness , respectively, derived from the Monte Carlo simulations at site B in Fig. 1. In this case, the volume concentrations of melanosomes in epidermis and blood in dermis were and , respectively. In Fig. 2a, and are decreased as the blood region becomes deep, whereas shows decrease only when the blood region with is shallow. In Fig. 2b, is first increased and then becomes constant as the blood region at becomes thick, whereas and are almost constant with respect to the thickness. Thus, depends on both the depth and thickness . Therefore, we can estimate the depth in the range of 0.2 to from and with no influence of thickness . In this case, the ratio , which is increased as the depth becomes large,22, 23 can be used to determine the depth . Once the depth of the local blood region is specified, is used to estimate the thickness without the influence of depth . In this case, a ratio , which is decreased as the thickness becomes large, is available for determination of the thickness . It should be noted that the curve varies according to values of and , but it is not significantly affected by thickness in a range of 0.2 to . On the other hand, the curve depends on values of , , and also .31 These parameters , , and are usually different among individuals, and also change due to physiological or structural conditions of tissue. In this method, we first estimate and from measured values, and then specify the ratio as a function of to determine the depth . The estimated values of , , and are used to specify the ratio as a function of , and finally, we obtain the thickness . The other parameters , , and , which may also affect the diffuse reflectance, are assumed to be known and constant, since their determination is currently unavailable by the proposed method. Some discussions are made in Sec. 4.3 on the effects of the scattering coefficient of skin tissue and the hematocrit of a blood region on the results of depth and thickness. Fig. 2(a) Dependence of , , and their ratio , and on the depth . (b) Dependence of , , and their ratio , and on the thickness , derived by Monte Carlo simulations. 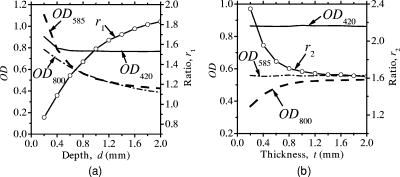 Figure 3 describes an estimation process for imaging the depth and thickness of a local blood region. First of all, we take reflectance images of skin surface, covering a local blood region (site A), together with the surrounding skin site (site B) at the three isosbestic wavelengths, 420, 585, and . These three reflectance images, , , and , are converted into the optical density images , , and , respectively. The concentration images of and are then derived from values according to the modified Beer-Lambert law. In this case, at wavelength is expressed as where , , and are the extinction coefficient, mean path length, and attenuation due to scattering, respectively. Subscripts , , , and indicate melanosomes, blood, epidermis, and dermis, respectively. A linear conversion of Eq. 8 for and yields where and are derived in advance by the multiple regression analysis (MRA) of given values of and , and the corresponding Monte-Carlo results of and at site A.Next, the function is approximated by an exponential function as , and thus, where , , and are approximated as simple linear functions of and , and coefficients of , , and were optimized by MRA for the Monte-Carlo results of the at site B. By applying Eq. 11 to each pixel of the image, a depth image is reconstructed. Then, the function is also approximated by another exponential function , and thus, where , , and are approximated as functions of , , and , and coefficients of , , and were determined by MRA for the Monte-Carlo results of at site B. By applying Eq. 15 to each pixel of the image, a thickness image is finally reconstructed. Equations 8 through 18 are our empirical formulas and are established before measurements.3.Materials and Method3.1.Measuring ApparatusFigure 4 simply shows a measuring apparatus. A 150-W halogen-lamp light source (LA-150SAE, Hayashi, Japan) illuminates the surface of a sample via a light guide, interference filter, and diffuser. The light source covers a range from visible to near-infrared wavelength. The angle of illumination is approximately with respect to the sample surface. The diffuser is used to reduce irregular intensity distribution of the exiting light. By using three interference filters of 420-, 585-, and 800-nm wavelengths with 10-nm spectral full-width at half-maximum (CVI Laser LLC, Albuquerque, NM, USA) alternately, diffuse reflectance images at the three isosbestic wavelengths are acquired by a 16-bit cooled CCD camera (BS-40, Bitran, Japan) with a camera lens (Pentax/Cosmicar, Japan; , 1:1.4), on the basis of reflected intensities from a spectralon white standard with 99% reflectance (SRS-99-020, Labsphere Incorporated, North Sutton, NH, USA) and six self-made grayscale phantoms ranging from 1 to 55% reflectance. The grayscale phantoms were prepared using agar gels with Intralipid 10% solution (Fresenius Kabi AB, Uppsala, Sweden) and India ink (Kaimei Incorporated, Saitama, Japan), and used to compensate the nonlinear sensitivity of the camera with respect to the input light intensity. The integration time of the CCD camera for each reflectance image was , although it is expected to reduce the time by optimizing the arrangement of the optical system. Field of view of the system was with pixels. The reflectance images are stored in a personal computer and analyzed according to the estimation process described in Fig. 3. In this study, human skin tissue on the inner forearm of a Japanese adult male and tissue-like agar gel phantoms were employed as subjects for experiments. 3.2.Tissue-Like Agar Gel PhantomsFigure 5 shows a cross sectional photograph of the phantom. The phantom with an area of consists of epidermis and dermis layers containing a 12-mm-diam circular region with oxygenated blood. The agar solution was prepared by diluting agar powder (Ina Food Industrial Incorporated, Ina, Japan) with saline at a weight ratio of 0.8%. To set the scattering condition, Intralipid 10% solution (Fresenius Kabi AB, Sweden) was added to the agar solution. The resultant solution was used as a base material for epidermis and dermis layers. Coffee solution was introduced as melanosome substitute into the base material, and this mixture was used to make an epidermis layer. In the phantom experiments, therefore, a notation is used instead of . An oxygenated dermis layer was made by adding a small amount of fully oxygenated horse blood with to the base material. The volume concentration of coffee solution was set to be to 10% at an interval of 1%, while that of blood was to be , 0.4, and 0.6%. For the local blood region, an oxygenated blood material was prepared by mixing the agar solution with fully oxygenated red blood cells of horse blood in . In this study, it was difficult to make the local blood region with 44% hematocrit by agar. A phantom with a more dense blood region is under development, and experiments using such a phantom will be reported in the near future. The volume concentrations and of coffee solution in the epidermis layer and blood in the dermis layer were set to be 5.0 and 0.4%, respectively. All these layers were hardened in various molds having the required thickness, size, and shape by being cooled at about for . The epidermis layer, dermis layer, and blood region were 1.0, 5.0, and in thickness, respectively. The depth of a local blood region were set to be , 2.0, and , whereas its thickness was to be , 1.0, 1.5, and . These layers were then piled to be a multilayered phantom, which was put between two slide glasses, as shown in Fig. 5. The slide glass on the epidermis layer was naturally coupled to the phantom by a drop of water. The empirical formulas should be prepared for phantom experiments, separately from in-vivo experiments. Diffuse reflectance samples at wavelengths of 420, 585, and were generated by using the Monte Carlo simulations for the phantom conditions. Optical parameters of and for the phantom were determined by the inverse Monte Carlo method for measured diffuse reflectance and total transmittance.18, 19, 27 The refractive index for each layer was assumed to be 1.33 at the three wavelengths. The anisotropy factor of Intralipid 10%32 was used for the epidermis and dermis layers, while that of whole blood27 was introduced for the blood layer. To compensate difference in the thickness of epidermis between the phantom and human skin, and were controlled so that OD of the phantom came close to that of human skin by regulating the concentration of Intralipid and coffee solution. Table 2 shows typical optical parameters for the phantom with , , and of the local blood region. Details of preparation for the phantom and its optical properties have been publishedpreviously.18, 19 Both the depth and thickness of the blood region were set to be from 0.2 to at intervals of . For each wavelength, therefore, the combination of and gave 30 diffuse reflectance data for site A, whereas that of , , , and took 3000 data for site B. According to the derivation process described in Secs. 2.1 and 2.2, the empirical formulas for the phantom were obtained. Table 2Optical parameters used in the Monte Carlo simulation for phantoms with Cc=5.0% , Cb=0.4% , and Hct=20% of a local blood region.
3.3.Method for Numerical InvestigationAs we mentioned before, the proposed method assumes that the scattering coefficients of epidermis and dermis and the hematocrit Hct% or absorption coefficient of blood are known, and typical values published in literatures are used to derive the empirical formulas. However, these values have subject-to-subject variability and may change due to the physiological or structural condition of tissue. To investigate the effect of variation in scattering coefficients of the tissue and in hematocrit of the blood on the results, we performed numerical estimation for diffuse reflectance samples generated by the Monte Carlo simulation when each value of and Hct% had some variations. For test samples, values of were set with , , 10, and 20% decrement or increment of the value listed in Table 1, whereas those of Hct% in both dermis and a local blood region were with , , 14, and 25% of them. 4.Results and Discussion4.1.Experiments for PhantomsTo investigate the feasibility of the method, we carried out experiments using tissue-like agar gel phantoms. Figure 6 shows typical results of images obtained from the phantom having a local blood region for [Fig. 6a] volume concentration of coffee in the epidermis layer and [Fig. 6b] that of blood in the dermis layer , [Fig. 6c] depth , and [Fig. 6d] thickness . We divided the image into sites A and B by a dashed line in Figs. 6a and 6b. For site A, the average values of and were estimated by Eqs. 9, 10 to be 3.17 and 0.45%, respectively, whereas the original values of and were 5.0 and 0.4% when the phantom was made. These average values of and were used to obtain images of Figs. 6c and 6d, which demonstrate depth and thickness distributions of the circular blood region. The original values of depth and thickness of the blood region set in the phantom were and , respectively. It should be noted that the border of blood region is blurred in the results of both depth and thickness. This is mainly due to diffusion of light from the surrounding dermis to the blood region. The bright areas spreading to the four corners in the thickness image of Fig. 6d seem to be artifacts. Similar artifacts were also observed in the original reflectance image at , whereas the reflectance images at 420 and did not have them (not shown here). Therefore, the artifacts were observed in the thickness image but not in the depth image. The source of these artifacts has not been clearly identified yet. We consider that it is probably due to unexpected light reflected from the slide glass under the phantom or light penetrated from both side faces of the phantom, because the penetration of light at could be larger than that at 420 or for the phantom. This needs further investigation in future work. Fig. 6Concentration images of (a) coffee in epidermis and (b) blood in dermis, obtained from the phantom. Each image was divided into site A (without a blood region) and site B (with a blood region). Images of (c) depth and (d) thickness of a circular blood region were obtained from the phantom. 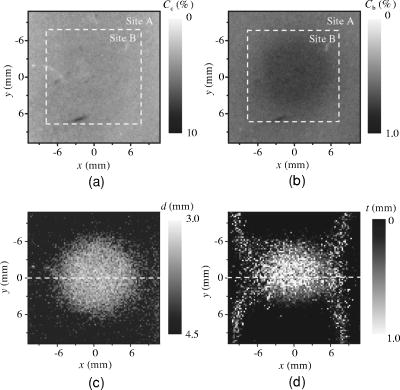 Figures 7a and 7b demonstrate profiles of and along with dashed lines in Figs. 6c and 6d, respectively. The estimated depth has error of about corresponding to 10% of the given value, which is still large for future clinical use and should be improved mainly by more accurate estimation of and . The estimated thickness is close to the original value on average, but it has fluctuation. These profiles are then combined together and reconstructed as shown in Fig. 7c. Squares and circles in Fig. 7c denote estimated plots of the upper surface (depth profile) and the lower surface (sum of depth and thickness profiles), respectively. The estimated outline of the blood region roughly corresponds to the original, but blurring effect occurs in the border again. Figure 8 shows comparison between the estimated and original values of Fig. 8a depth and Fig. 8b thickness . The estimated values are proportional to the original values, but some errors are shown when the blood region is deep and thick. The errors of depth and thickness correspond to and of the given values, respectively. These errors can be caused by properties of the functions and becoming gradually insensitive to and with increasing depth and thickness, respectively, as shown in Figs. 2a and 2b. Therefore, measurable ranges of the depth and thickness are essentially limited by the characteristics of and . Fig. 7Profiles of (a) depth and (b) thickness corresponding to the dashed line in Figs. 6c and 6d, respectively. (c) Outline profile of the blood region reconstructed from (a) and (b). Squares and circles in (c) denote the upper surface (depth profile) and the lower surface (sum of depth and thickness profiles), respectively. 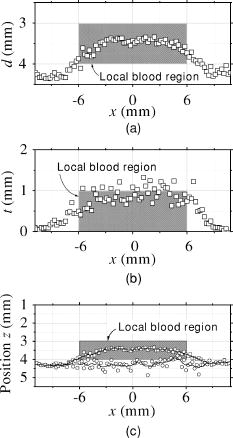 4.2.Experiments for Human VeinsTo investigate the applicability of the method to in-vivo measurements, we next conducted experiments for human skin tissue, including veins. To compare results of the proposed method with the conventional technique, ultrasound imaging of the same veins was also conducted. Figure 9a shows a photograph of a measured skin region including veins and Fig. 9b a classical ultrasound image (B-mode) along with the dashed line in Fig. 9a. We can confirm the positions of veins as two dark elliptical spots in Fig. 9b. The distance between the center of the two spots or veins is about . The depth from the skin surface to the top of the left vein is , whereas that for the right vein is . We evaluated the thickness (diameter) around the center of each vein as to for the left one and to for the right one. Fig. 9(a) Photograph of a measured skin region including veins and (b) example of a classical ultrasound image (B-mode) along with the dashed line in (a). 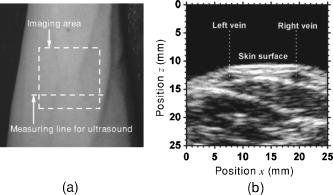 Figure 10 demonstrates images obtained by the proposed method for volume concentration of melanosomes in epidermis [Fig. 10a] and that of blood in dermis [Fig. 10b]. In Figs. 10a and 10b, we used the rectangular area enclosed by a dashed line as site A to estimate the averaged concentrations and . The estimated values of and were 0.71 and 0.90%, respectively, which are close to values reported in the literature.19, 33 Figure 10 also shows 2-D distributions for depth [Fig. 10c] and thickness of veins obtained by the proposed method [Fig. 10d]. However, the border of veins is blurred as we supposed from the phantom experiment. Figure 11 shows profiles of depth [Fig. 11a] and thickness [Fig. 11b] along with the dashed lines in Figs. 10c and 10d, respectively. In both of Figs. 11a and 11b, the distance between two peaks is about , which corresponds to the result from the conventional ultrasound shown in Fig. 9b. Discrepancy between the estimated values from the proposed method and the ultrasound technique are 0.25 to for depth and 0.1 to for thickness. Therefore, the current measurement has the average errors of 30% for depth and 19% for thickness. These errors are probably due to discrepancy in optical properties between the actual human skin and the skin tissue model assumed in the Monte Carlo simulations. This issue is discussed in Sec. 4.3. Fig. 10Concentration images of (a) melanosomes in epidermis and (b) blood in dermis, obtained from human skin tissue. Rectangular areas enclosed by the dashed line were used as site A to estimate the averaged values of and . Images of (c) depth and (d) thickness of human veins. 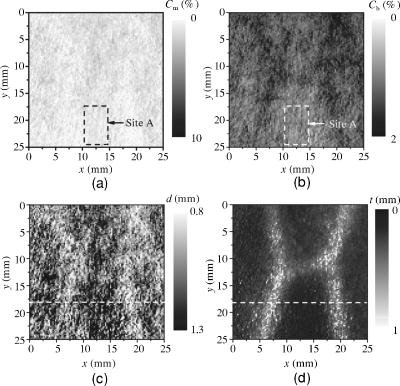 Fig. 11Profiles of (a) depth and (b) thickness corresponding to the dashed line in Figs. 10c and 10d, respectively. Arrows indicate the actual positions of veins. (c) Outline profile of the veins reconstructed from (a) and (b).  Figure 11c shows an outline profile that combines the profiles of and . Plots of squares and circles denote the estimated upper and lower borders of veins, obtained from Figs. 11a and 11b, respectively. There are two possible regions that are supposed to be veins. Separation of veins and surrounding tissue is not clear, as shown in Fig. 11c. This may be due to the diffusion effect of light in addition to the discrepancy between the actual human skin and the skin tissue model in the Monte Carlo simulation. These problems could prevent the method from reconstructing the outline of veins having complex shape and distribution. Assuming a cylindrical blood region model, incident light may diffuse around the blood region and give lower value than that for the simple solid layer model. This diffusion effect could be strong at the longer wavelengths (585 or ) where a tissue scattering coefficient is low compared to that at the shorter wavelength . As a consequence, both and decrease, and thus the depth and thickness may be over- and underestimated, respectively. Moreover, as supposed from the results of phantom experiments, these errors could be more remarkable near the lateral borders of the local blood region. The blurring effect may possibly be corrected by a phantom including a vein-like cylindrical blood region with known depth and diameter, as developed by Kienle 34 Practically, it may also be improved by image processing based on 2-D deconvolution using the point-spread function. It should be noted that the resultant images from the human skin suffered from some fine glares due to the surface roughness of tissue. Those glares could not be seen in the results of the phantom, which was naturally coupled to and covered with the slide glass by water. Use of polarizers may be effective to reduce deterioration of image quality due to the glare.35 Details of these issues will be studied in our future work. 4.3.Numerical InvestigationTable 3 demonstrates results of and obtained for four different variations in of skin tissue. The estimated value of decreases as the variation in changes from negative to positive, while that of has no significant change. A large variation in is found to cause deviation of . This result is originated from changes of OD or due to variations of at 420 and . Figure 12a shows numerical comparison of depth and Fig. 12b shows the thickness of the blood region. In Fig. 12a, the depth is over- or underestimated as decreases or increases from the typical value. This result may be attributed by two factors. One is fluctuation of the function due to the error of , which can be interpreted by Eqs. 11 through 14. Another is the error in the ratio at site B, which is caused by the variation of from the typical value. Since the scattering coefficient of human skin tissue at the shorter wavelength is larger than that at the longer, the value of is more sensitive than that of to the deviation of . If becomes small or large compared to the typical one, the value of at site B increases or decreases. Such fluctuations of were considered to yield errors of in Fig. 12a. On the other hand, in Fig. 12b, the estimated values of below agree well with the given values. This result is because errors of , , and are cancelled out in derivation of the function . Fig. 12Comparison of estimated and given values of (a) depth and (b) thickness of a local blood region for different variations in of skin tissue, obtained from numerical investigations.  Table 3Results of Cm and Cb for different variations in μs(λ) of skin tissue.
Table 4 shows results of and obtained for four different variations in Hct value of blood. The estimated value of increases significantly as the variation in Hct changes from negative to positive, while that of shows no systematic change. This is due to the following consideration. Most 420-nm light may be absorbed by melanosomes in epidermis, whereas the light at 585-nm wavelength easily penetrates the deeper region of dermis and is sufficiently absorbed by the blood in dermis. Although the hemoglobin absorbs the light at strongly, the probability that light is absorbed in dermis is weaker at than at . Thus, at site A reflects less of the variation in hematocrit of blood distributed in the dermis, but does significantly. As a consequence, the estimated value of depends on the Hct value. Figure 13a shows results of depth and Fig. 13b shows the thickness of the blood region. The estimated thickness has relatively large deviation from the given value, whereas the variation in Hct value has almost no influence on the estimated depth . In Fig. 13b, the thickness is over- or underestimated when the Hct value decreases or increases from the typical value. The contribution of absorption in the local blood region to the reflectance is higher at than that at . Therefore, the deviation of becomes large in comparison with that of . This means that is more sensitive than to absorbing conditions in the local blood region, and thus, the errors in thickness are more remarkable than that in depth . It should be mentioned that a combined uncertainty of Hct and may add up to a larger relative error in depth and thickness . As seen in Fig. 12b, for instance, a variation in of 20% at can be estimated as a relative error of roughly 30%. Similarly, a variation in Hct of 20% also gives a relative error of roughly 30%. A combination of the two uncertainties may give a considerably larger relative error in the thickness . Errors in thickness above shown in Figs. 12b and 13b may be because it is out of the measurable range in the function , as shown in Fig. 2b. Fig. 13Comparison of estimated and given values of (a) depth and (b) thickness of a local blood region for different variations in Hct of blood, obtained from numerical investigations. 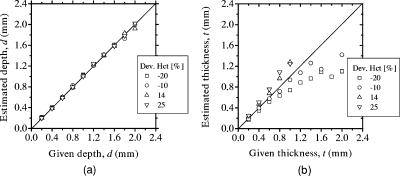 Table 4Results of Cm and Cb for different variations in Hct of blood.
The proposed method depends on many assumptions and simplifications. Therefore, the expected effects of the assumptions and simplifications on the results should be taken into consideration for in-vivo skin measurements in the future. In this study, we assumed that a local blood region is filled with whole blood with 44% hematocrit. This assumption is suitable for experiments with in-vivo skin tissue. However, the port wine stains and tumors may have lower volume concentration of blood than usual veins. Such a difference in the blood concentration, i.e., absorption of a local blood region, can cause misestimation, especially in thickness, as shown in the numerical results. Absorption of melaninless epidermis and bloodless dermis were not taken into consideration in absorption coefficients of epidermis and dermis, respectively, in this study. Therefore, the volume concentrations of melanin in epidermis and blood in dermis may be overestimated in Figs. 10a and 10b. In the previous work by Verkruysse, 36 it has been shown that when blood is modeled to be homogeneously distributed over the dermis, fewer red blood cells would produce the same absorption as the actual number of red blood cells distributed in the discrete vessels. Their results indicate that the optical density of the homogeneously distributed model could be higher than that of the discrete vessel model for the same concentration of blood. This effect may be strong where the optical absorption of blood is high at and weak at , and negligible at . Therefore, the function and for the discrete vessel model will be shifted downward, compared to those for the homogeneously distributed model shown in Figs. 2a and 2b. As a consequence, the estimated values of depth or thickness in the discrete vessel model may be under- or overestimated, respectively. The presence of capillaries localized in epidermal ridges in the papillary dermis would also affect the absorption of blood at , and may give a similar situation to the discrete vessel model. This would cause the overestimation of , and thus give the under- or overestimation of depth or thickness in the homogeneously distributed blood model. The epidermal ridges lie between the epidermis and dermis, and thus, the epidermis and dermis are not flat actually. Also, since the cell structures and their sizes for epidermis and dermis are different, the contributions of Rayleigh scattering and Mie scattering to these layers are not the same. Therefore, there should strictly be some differences between the epidermis and dermis both in and . Nevertheless, we assumed that the scattering properties of epidermis and dermis are the same and calculated them by Eqs. 4, 5 for convenience. The shape of epidermal ridges and the differences between the epidermis and dermis in and are of great importance for methods and techniques that mainly depend on single backscattering, coherent backscattering, or polarized backscattering. On the other hand, details of the ridge and differences of the scattering properties between the epidermis and dermis may be of minor importance for visible and near-infrared applications with diffusive light distribution, such as the proposed method. In fact, there are some approaches based on flat layered skin models 6, 7, 13, 14, 16, 17, 30 and a model30 that treats the epidermis and dermis identically in terms of and . Modeling of skin tissue using more reliable structural and optical parameters is necessary for deducing the depth and thickness accurately. More strict validation of the results such as a histology comparison should be made to establish the proposed method with reliable accuracy. 5.ConclusionIn summary, we demonstrate a new visualizing method for both depth and thickness of a local blood region based on reflectance images at three isosbestic wavelengths of 420, 585, and . The empirical formulas for the depth and thickness are established by diffuse reflectance samples generated by the Monte Carlo simulation of light transport for layered skin tissue structure. The feasibility of the method is shown by experiments with tissue-like agar gel phantoms and human skin veins. Expected errors due to the variations in the scattering coefficient of skin tissue and the hematocrit of blood are investigated by Monte Carlo simulation. This method probes the depth and thickness, that is, structural outline of the local blood region in which the absorption coefficient is assumed to be uniform. In this point, the technique differs from other techniques such as diffuse optical tomography or optoacoustic imaging that visualize inhomogeneity of the absorption coefficient within the tissue. For practical uses, it is desirable to estimate also the scattering coefficient of skin tissue and hematocrit of the blood in a framework of this method. This subject should be studied in a future work by performing further experiments on animals and tissue models with various optical and structural properties. AcknowledgmentPart of this work was supported by Grant-in-Aid for Scientific Research from the Japan Society for the Promotion of Science. ReferencesM. Poetke,
“Laser treatment in haemangiomas and vascular malformations,”
Applied Laser Medicine, 443
–482 Springer-Verlag, Berlin (2003). Google Scholar
C. T. W. Lahaye and
M. J. C. van Gemert,
“Optimal laser parameters for port wine stain therapy: a theoretical approach,”
Phys. Med. Biol., 30 573
–587
(1985). https://doi.org/10.1088/0031-9155/30/6/007 0031-9155 Google Scholar
M. J. C. van Gemert,
A. J. Welch, and
A. P. Amin,
“Is there an optimal laser treatment for port wine stains?,”
Lasers Surg. Med., 6 76
–83
(1986). https://doi.org/10.1002/lsm.1900060116 0196-8092 Google Scholar
J. W. Pickering,
P. H. Butler,
B. J. Ring, and
E. P. Walker,
“Thermal profiles of blood vessels heated by a laser,”
Australas. Phys. Eng. Sci. Med., 12 11
–15
(1989). 0158-9938 Google Scholar
J. W. Pickering,
P. H. Butler,
B. J. Ring, and
E. P. Walker,
“Computed temperature distributions around ectatic capillaries exposed to yellow laser light,”
Phys. Med. Biol., 34 1247
–1258
(1989). https://doi.org/10.1088/0031-9155/34/9/010 0031-9155 Google Scholar
W. Verkruysse,
J. W. Pickering,
J. F. Beek,
M. Keijzer, and
M. J. C. van Gemert,
“Modeling the effect of wavelength on the pulsed dye laser treatment of port wine stains,”
Appl. Opt., 32 393
–398
(1993). 0003-6935 Google Scholar
J. W. Tunnell,
L. V. Wang, and
B. Anvari,
“Optimum pulse duration and radiant exposure for vascular laser therapy of dark port-wine skin: a theoretical study,”
Appl. Opt., 42 1367
–1378
(2003). https://doi.org/10.1364/AO.42.001367 0003-6935 Google Scholar
J. S. Nelson,
T. E. Milner,
B. S. Tanenbaum,
D. M. Goodman, and
M. J. C. van Gemert,
“Infra-red tomography of port-wine-stain blood vessel in human skin,”
Lasers Med. Sci., 11 199
–204
(1996). 0268-8921 Google Scholar
B. P. Payne,
V. Venugopalan,
B. B. Mikić, and
N. S. Nishioka,
“Optoacoustic tomography using time-resolved interferometric detection of surface displacement,”
J. Biomed. Opt., 8 273
–280
(2003). https://doi.org/10.1117/1.1559727 1083-3668 Google Scholar
R. O. Esenaliev,
A. A. Karabutov, and
A. A. Oraevsky,
“Sensitivity of laser opto-acoustic imaging in detection of small deeply embedded tumors,”
IEEE J. Sel. Top. Quantum Electron., 5 981
–987
(1999). https://doi.org/10.1109/2944.796320 1077-260X Google Scholar
X. Wang,
Y. Pang,
G. Ku,
G. Stoica, and
L. V. Wang,
“Three-dimensional laser-induced photoacoustic tomography of mouse brain with the skin and skull intact,”
Opt. Lett., 28 1739
–1741
(2003). https://doi.org/10.1364/OL.28.001739 0146-9592 Google Scholar
M. G. Sowa,
J. R. Payette,
M. D. Hewko, and
H. H. Mantsch,
“Visible-near infrared multispectral imaging of the rat dorsal skin flap,”
J. Biomed. Opt., 4 474
–481
(1999). https://doi.org/10.1117/1.429957 1083-3668 Google Scholar
N. Tsumura,
H. Haneishi, and
Y. Miyake,
“Independent-component analysis of skin color image,”
J. Opt. Soc. Am. A, 16 2169
–2176
(1999). https://doi.org/10.1364/JOSAA.16.002169 0740-3232 Google Scholar
M. Shimada,
Y. Masuda,
Y. Yamada,
M. Itoh,
M. Takahashi, and
T. Yatagai,
“Explanation of human skin color by multiple linear regression analysis based on the modified Lambert-Beer law,”
Opt. Rev., 7 348
–352
(2000). https://doi.org/10.1007/s10043-000-0348-7 1340-6000 Google Scholar
A. A. Stratonnikov and
V. B. Loschenov,
“Evaluation of blood oxygen saturation in vivo from diffuse reflectance spectra,”
J. Biomed. Opt., 6 457
–467
(2001). https://doi.org/10.1117/1.1411979 1083-3668 Google Scholar
M. Shimada,
Y. Yamada,
M. Itoh, and
T. Yatagai,
“Melanin and blood concentration in human skin studied by multiple regression analysis: experiments,”
Phys. Med. Biol., 46 2385
–2395
(2001). https://doi.org/10.1088/0031-9155/46/9/308 0031-9155 Google Scholar
M. Shimada,
Y. Yamada,
M. Itoh, and
T. Yatagai,
“Melanin and blood concentration in human skin studied by multiple regression analysis: assessment by Monte Carlo simulation,”
Phys. Med. Biol., 46 2397
–2406
(2001). https://doi.org/10.1088/0031-9155/46/9/309 0031-9155 Google Scholar
I. Nishidate,
Y. Aizu, and
H. Mishina,
“Estimation of absorbing components in a local blood layer embedded in the turbid media on the basis of visible to near-infrared (VIS-NIR) reflectance spectra,”
Opt. Rev., 10 427
–435
(2003). https://doi.org/10.1007/s10043-003-0427-7 1340-6000 Google Scholar
I. Nishidate,
Y. Aizu, and
H. Mishina,
“Estimation of melanin and hemoglobin in skin tissue using multiple regression analysis aided by Monte Carlo simulation,”
J. Biomed. Opt., 9 700
–710
(2004). https://doi.org/10.1117/1.1756918 1083-3668 Google Scholar
P. B. Bargo,
S. A. Prahl,
T. T. Goodell,
R. A. Sleven,
G. Koval,
G. Blair, and
S. L. Jacques,
“In vivo determination of optical properties of normal and tumor tissue with white light reflectance and an empirical light transport model during endoscopy,”
J. Biomed. Opt., 10 034018
(2005). https://doi.org/10.1117/1.1921907 1083-3668 Google Scholar
T. Iwai and
G. Kimura,
“Imaging of an absorbing object embedded in a dense scattering medium by diffusing light topography,”
Opt. Rev., 7 436
–441
(2000). https://doi.org/10.1007/s10043-000-0436-8 1340-6000 Google Scholar
S. L. Jacques,
I. S. Saidi, and
F. K. Tittel,
“Average depth of blood vessels in skin and lesions deduced by optical fiber spectroscopy,”
Proc. SPIE, 2128 231
–237
(1994). https://doi.org/10.1117/12.184904 0277-786X Google Scholar
I. Nishidate,
Y. Aizu, and
H. Mishina,
“Depth visualization of a local blood region in skin tissue by use of diffuse reflectance images,”
Opt. Lett., 30 2128
–2130
(2005). https://doi.org/10.1364/OL.30.002128 0146-9592 Google Scholar
L. H. Wang,
S. L. Jacques, and
L. Q. Zheng,
“MCML-Monte Carlo modeling of photon transport in multi-layered tissues,”
Comput. Methods Programs Biomed., 47 131
–146
(1995). https://doi.org/10.1016/0169-2607(95)01640-F 0169-2607 Google Scholar
S. L. Jacques and
D. J. McAuliffe,
“The melanosome: threshold temperature for explosive vaporization and internal absorption coefficient during pulsed laser irradiation,”
Photochem. Photobiol., 53 769
–775
(1991). 0031-8655 Google Scholar
A. Roggan,
M. Friebel,
K. Dörschel,
A. Hahn, and
G. Muller,
“Optical properties of circulating human blood in the wavelength range ,”
J. Biomed. Opt., 4 36
–46
(1999). https://doi.org/10.1117/1.429919 1083-3668 Google Scholar
M. J. C. van Gemert,
S. L. Jacques,
H. J. C. M. Sterenborg, and
W. M. Star,
“Skin optics,”
IEEE Trans. Biomed. Eng., 36 1146
–1154
(1989). https://doi.org/10.1109/10.42108 0018-9294 Google Scholar
T. Dai,
B. M. Pikkula,
L. V. Wang, and
B. Anvari,
“Comparison of human skin opto-thermal response to near-infrared and visible laser irradiations: a theoretical investigation,”
Phys. Med. Biol., 49 4861
–4877
(2004). https://doi.org/10.1088/0031-9155/49/21/002 0031-9155 Google Scholar
I. Nishidate,
T. Maeda,
Y. Aizu,
K. Niizeki, and
H. Mishina,
“Visualization of depth and thickness of a local blood region in skin tissue using diffuse reflectance images,”
59
–60
(2004). Google Scholar
H. J. van Staveren,
C. J. M. Moes,
J. Marle,
S. A. Prahl, and
M. J. C. Gamert,
“Light scattering in Intralipid-10% in the wavelength range of ,”
Appl. Opt., 30 4507
–4514
(1991). 0003-6935 Google Scholar
S. L. Jacques,
R. D. Glickman, and
J. A. Schwartz,
“Internal absorption coefficient and threshold for pulsed laser disruption of melanosomes isolated from retinal pigment epithelium,”
Proc. SPIE, 2681 468
–477
(1996). https://doi.org/10.1117/12.239608 0277-786X Google Scholar
A. Kienle,
L. Lilge,
I. A. Vitkin,
M. S. Patterson,
B. C. Wilson,
R. Hibst, and
R. Steinner,
“Why do veins appear blue? A new look at an old question,”
Appl. Opt., 35 1151
–1160
(1996). 0003-6935 Google Scholar
S. L. Jacques,
J. C. Ramella-Roman, and
K. Lee,
“Imaging skin pathology with polarized light,”
J. Biomed. Opt., 7 329
–340
(2002). https://doi.org/10.1117/1.1484498 1083-3668 Google Scholar
W. Verkruysse,
G. W. Lucassen,
J. F. de Boer,
D. J. Smithies,
J. S. Nelson, and
M. J. C. van Gemert,
“Modeling light distributions of homogeneous versus discrete absorbers in light irradiated turbid media,”
Phys. Med. Biol., 42 51
–65
(1997). https://doi.org/10.1088/0031-9155/42/1/003 0031-9155 Google Scholar
|
||||||||||||||||||||||||||||||||||||||||||||||||||||||||||||||||||||||||||||||||||||||||||||||||||||||||||||||||||||||


