
|
|
1.IntroductionCardiovascular diseases such as ischemic heart attack and stroke are the leading cause of morbidity and mortality, which accounted for 37% of all death in the U.S in 2003. The direct and indirect treatment cost for cardiovascular diseases was projected to exceed $400 billion in 2006.1 Atherosclerosis is the major underlying process leading to cardiovascular diseases.2 Like other complex human diseases, atherosclerosis progressively develops over time. Its initiation is characterized by the deposition of low-density lipoprotein (LDL), infiltration of monocytes, and maturation of monocytes into LDL-engulfing macrophages in the subendothelial layer of the intima. The lesions progress into plaques when smooth muscle cells infiltrate the intima, and collagen fibrils, and lipid particles deposit in the extracellular space. In advanced stages, lipid-rich necrotic cores, calcium deposits, and intimal thickening are often observed.2, 3 Although the most obvious impact of advanced atherosclerotic lesions is stenosis, clinical complications generally come from plaque rupture and thrombosis, leading to myocardial infarction and stroke.4, 5 It has been shown that pathological behaviors of plaques depend not only on their sizes but also on their compositions of collagen fibrils, lipid droplet deposits, and lipid-rich cells.3, 6 Current clinical detection and evaluation of atherosclerotic plaques are performed using a number of techniques such as magnetic resonance imaging, x-ray angiography, intravascular ultrasound (IVUS), and optical coherence tomography (OCT).7, 8, 9 While providing cross sectional mapping of plaque morphology and thickness, these techniques lack either adequate resolution or specificity necessary to analyze plaque composition and structural organization.7 Standard histological analysis provides sufficient resolution and chemical specificity, but it mainly relies on excised arterial tissues, which is not a viable option for clinical diagnosis. Due to such limitations, it is not yet possible to determine the rupture risk or design individualized drug treatments for patients based on the composition of their atherosclerotic lesions. New imaging technologies are clearly needed for plaque diagnosis with 3-D spatial resolution, high sensitivity, and chemical selectivity. For chemically selective analysis of atheroma, a number of technologies, including fluorescence spectroscopy,10, 11 near-infrared spectroscopy,12 Raman spectroscopy,13, 14 fluorescence imaging,15 and laser speckle imaging,16 have been used to study the distinct chemical changes associated with atherogenesis. Recently, nonlinear optical (NLO) microscopy emerged as a viable means for 3-D molecular imaging of tissues and live animals.17, 18 The three major types of NLO imaging tools include two-photon excitation fluorescence (TPEF), second-harmonic generation (SHG), and coherent anti-Stokes Raman scattering (CARS) microscopy. Benefited from the versatility of fluorescent labels, TPEF microscopy has been used for imaging of endothelial and smooth muscle cells.19 TPEF microscopy has also been used to image elastin fibers based on their intrinsic autofluorescence.20, 21 Being selective to noncentrosymmetric structures, SHG microscopy has been used to probe collagen fibrils.22 Relying on Raman resonance enhancement, CARS microscopy permits chemically selective imaging of specific endogenous molecules without labeling.23 CARS microscopy is particularly sensitive to lipid-rich structures because of their high-density CH bonds. Recently, CARS microscopy has been applied to image cellular membranes, myelin sheath, and lipid droplets inside adipocytes.24, 25, 26 Although a number of laboratories have used TPEF and SHG microscopy to image arterial walls, 19, 20, 21, 27, 28 label-free NLO imaging of atherosclerotic lesions has not been reported. A typical atherosclerotic lesion consists of extracellular lipid deposits, lipid-rich cells, and collagen fibers.2 Therefore, it is conceivable that multimodal microscopy capable of CARS, SHG, and TPEF imaging on the same platform will enable characterization of plaque composition and structural organization at molecular details. Because NLO microscopy provides intrinsic 3-D submicrometric resolution,18 its application to characterize atherosclerotic lesions should advance the diagnostic capability beyond the existing 2-D imaging modalities. We demonstrate the capability of multimodal NLO microscopy for label-free imaging of atherosclerotic lesions by using an Ossabaw swine model of metabolic syndrome-induced arterial diseases.29, 30 Because human and swine cardiovasculature are nearly identical, swine are ideal models for studies of obesity and diabetes-associated cardiovascular diseases. An advantage of the Ossabaw swine model is that cardiovascular disease can be predictably produced.29, 30 This unique feature gives us access to a large pool of arterial samples with atherosclerotic lesions for imaging. We collected iliac arteries, where high incidence of plaque formation was detected with IVUS, and imaged the composition of plaques and normal arterial walls using CARS, SHG, and TPEF modalities. We obtained cross sectional images of atherosclerotic plaques, and validated the NLO contrast with standard histological analysis. We also obtained luminal images of atherosclerotic plaques, which lay the foundation for application of NLO endoscopy to clinical diagnosis of cardiovascular diseases. 2.Methods2.1.Metabolic Syndrome-Induced Cardiovascular Diseases Ossabaw Pig ModelHistorically, Ossabaw swine were abandoned on isolated Ossabaw Island, Georgia, more than 500 years ago by the Spanish explorers. Due to the harsh living conditions in the wild, they evolved a thrifty genotype, which permits more efficient food utilization. This genotype permits the animals to store large amounts of fat during times of abundance and to survive long periods of famine.31, 32 When fed a high-fat, high-cholesterol diet and given little exercise, they quickly become obese with a body fat mass five times higher than animals on a low-fat diet. Long duration of excessive obesity leads to the development of type 2 diabetes and eventually cardiovascular diseases.30, 33 In our experiment, male Ossabaw pigs were divided into two diet groups: a control diet group (lean, n=7) and a high-fat diet group (obese, n=7). Lean pigs were fed a normal maintenance diet (7% kcal from fat), and obese pigs were fed with a high-fat diet (45% kcal from fat and 2% cholesterol). Pigs were on their respective diets for 57 weeks, then body composition, glucose tolerance, and plasma lipids were assessed. IVUS was used to diagnose plaques in both coronary and iliac arteries. Compared with lean animals, obese swine showed 2-fold greater (plasma insulin glucose) concentrations, 4.1-fold greater total cholesterol, 1.6-fold greater postprandial triglycerides, 4.6-fold greater low- to high-density lipoprotein cholesterol ratio, hypertension, and plaque formation in iliac arteries (data not shown). Iliac arteries were harvested and kept in 10% buffered formalin for nonlinear optical imaging. 2.2.Nonlinear Optical ImagingA multimodal nonlinear optical (NLO) microscope that allows CARS, SHG, and TPEF imaging on the same platform is diagrammed in Fig. 1 . Two tightly synchronized Ti: sapphire lasers (Mira 900, Coherent Incorporated, Santa Clara, California) were used for CARS imaging. Both lasers have pulse duration of and operate at 78-MHz repetition rate. The two beams at frequencies of (pump) and (Stokes) were parallel polarized and collinearly combined. A Pockels’ cell (model 350-160, Conoptics, Danbury, Connecticut) was used to reduce the repetition rate to . The combined beams were directed into the scanning box (FV300) of a confocal microscope (IX70, Olympus, Melville, New York) and focused into a sample through a water immersion microscope objective with a 1.2 numerical aperture. Back reflected signal was collected by the same objective, spectrally separated from the excitation source by a dichroic mirror (670dcxr, Chroma Technologies, Rockingham, Vermont), transmitted through a bandpass filter (42-7336, Ealing Catalog Incorporated, Rocklin, California), and detected by a photomultiplier tube (PMT, H7422-40, Hamamatsu, Japan) mounted at the back port of the microscope. For CARS imaging of lipids, the pump laser was tuned to around and the Stokes laser to around . Their wave number difference matched the Raman shift of symmetric stretch vibration. For SHG and TPEF imaging, a femtosecond laser ( , ) at (Mira 900, Coherent Incorporated, Santa Clara, California) was used for excitation. SHG and TPEF signals were detected by the same PMT mounted at the back port. Bandpass filters and (Chroma Technologies, Rockingham, Vermont) were used to transmit the SHG signal from collagen and the TPEF signal from elastin and oxidized LDL particles, respectively. Total acquisition time for each image was . Images were analyzed using FluoView software (Olympus, Melville, New York). 2.3.Nonlinear Optical MicrospectroscopyA spectrometer (Shamrock 303i, Andor Technology, Belfast, Ireland) equipped with an electron-multiplying charge-coupled device (EM-CCD) was installed at the back port of the microscope (Fig. 1). To acquire spectra for the components of an atherosclerotic lesion, a CARS, TPEF, or SHG image was first acquired using the appropriate excitation laser sources. The laser beam was focused into a position of interest in the sample by using the point-scan mode. The point-scan action externally triggered the spectrometer to record a spectrum of NLO signals arising from the focused area. 2.4.Nonlinear Optical Imaging ConditionsArterial tissues submerged in formalin were placed in a glass-bottom chamber for imaging at room temperature. For CARS imaging, the total power of Stokes and pump lasers at the sample was set at . For SHG and TPEF imaging of arterial tissues, the laser power at the sample was set at at excitation wavelength. Although we did not observe any noticeable photodamage to the samples, a lower laser power setting is preferred for future experiments to avoid the risk of laser-induced damages.20, 27 2.5.Histology AnalysisAfter immersion fixation, sections of the iliac arteries were routinely processed. Paraffin-embedded sections of were mounted on glass slides and stained with hematoxylin eosin. Histology sections were stained with Masson’s trichrome, Verhoeff-Van Gieson, or Oil Red O to assess collagen, elastin, and lipid deposit, respectively. Histology images were acquired using a Nikon Eclipse E400 microscope (Nikon Corporation, Tokyo, Japan) equipped with a air objective and a Spot Insight Camera (Diagnostic Instrument, Incorporated, Sterling Heights, Michigan). 3.ResultsAs lipid is a main component of atherosclerotic lesions, we first applied CARS microscopy to image lipid in the iliac arteries of Ossabaw pigs. To visualize lesions from arterial lumen view, we sliced iliac arteries along the longitudinal direction and placed flattened arteries on a glass surface, such that the lumen faced the water immersion objective on an inverted microscope. The wave number difference between the pump and Stokes lasers, , was tuned to , the peak of the CARS band for the symmetric stretch vibration. In arteries of an obese Ossabaw pig, strong CARS signals were detected at different depths (Fig. 2 ). Red blood cells and blood lipid deposited over a monolayer of endothelial cells were detected at the lumen surface [Fig. 2a]. Lipid droplet enriched cells resembling foam cells were found at great depths [Figs. 2b and 2c]. The concentration of lipid-rich cells varied from one affected area to another [Fig. 2d]. The presence of lipid-rich cells were further confirmed by Oil Red O staining [Figs. 2e and 2f]. It is worth mentioning that lipid-rich cells can be derived from either macrophage cells or smooth muscle cells.34, 35 Being a sensitive probe of lipid bodies,23 CARS provides a way of imaging lipid-rich cells exclusively. Furthermore, CARS imaging allowed visualization of endothelial cells at the surface of atherosclerotic lesions [Fig. 2a]. This detection sensitivity was probably due to an effective reflection of forward CARS signals from endothelial cells by the condensed plaque components. Such enhanced back refection of the forward signal was observed in CARS imaging of mouse skin tissues in vivo.25 Together, the observations shown in Fig. 2 suggest that CARS microscopy is a highly sensitive and specific tool for the detection of atherosclerotic lesions. Fig. 2CARS imaging of an atherosclerotic iliac artery from an obese Ossabaw pig. (a), (b), and (c) Depth imaging of red blood cells (RBC), blood lipid deposits (BL), endothelial cells (EC), and lipid-rich cells (LC) in an affected area. (d) CARS imaging of lipid-rich cells in another affected area. (e) and (f) A lipid-rich cell stained with Oil Red O and imaged with (e) CARS and (f) TPEF. Images were acquired from luminal views with a water immersion objective. Scale bars: .  In addition to lipid deposition and accumulation of lipid-rich cells, another feature of atheroma is the presence of a matrix rich in collagen fibrils.2, 3 Hence, we applied SHG microscopy to image collagen fibrils in the arterial wall and atherosclerotic lesions. A femtosecond laser centered at was used for excitation. Epi-reflected SHG signal was collected through a bandpass filter. In normal arteries, collagen fibers were observed to be aligned parallel to one another from both cross sectional and luminal views of the vessel [Figs. 3a, 3b, 3c ]. On the contrary, collagen fibers in an atheroma appeared disordered from a luminal view [Fig. 3e] and perpendicular to those in the arterial wall from a cross sectional view [Figs. 3d and 3f]. Based on integrated SHG intensities, the density of collagen in atheroma was higher than that in arterial walls by as much as four times. The density and orientation difference of collagen fibers between healthy artery wall and plaque was verified by histological evaluation of arterial sections treated with Masson’s trichrome stain [Figs. 3c and 3f]. These observations showed that SHG can be used to identify atherosclerotic lesions based on collagen fibril density and orientation. Fig. 3SHG imaging and histology of healthy and atherosclerotic iliac arteries from Ossabaw pigs. (a) Cross sectional and (b) luminal views of collagen in a healthy arterial wall. (c) Histology of a healthy iliac artery stained for collagen (blue) using Masson’s trichrome stain. (d) Cross sectional and (e) luminal views of collagen in an atherosclerotic artery. (f) Histology of an atherosclerotic artery stained for collagen using Masson’s trichrome stain (blue). SHG images were acquired with a air objective. Histology images were acquired with a air objective. Scale bars: . (Color online only.) 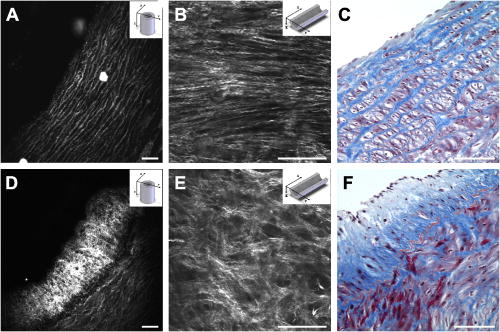 The elastin fibrils, a major component of the internal elastic membrane, were shown to give a strong autofluorescence signal.20, 27 Using a femtosecond laser at for excitation and a spectrometer attached to our NLO microscope (Fig. 1), we observed a relatively broad two-photon autofluorescence band that peaked at 20 and a sharp SHG band that peaked at [Fig. 4b , inset]. The autofluorescence signals were assigned for elastin and collagen by spectral analysis of Verhoeff-Van Gieson stained elastin bands (Fig. 5 ) and Masson’s trichrome stained collagen fibrils [Fig. 3c], respectively. It should be noted that there are variations in the literature on elastin emission maxima, which includes 480 and .20, 27 There are two possible reasons for the variation between our reported value and those referenced. First, our elastin spectrum might have contributions from other arterial components. For instance, Zoumi showed a red shift of the spectrum for elastin when mixed with smooth muscle cells.20 However, because we centered the focal volume within the internal elastic membrane, the contribution of other arterial components should be minimal. Second, there are intrinsic variations arising from different spectrometers used. The second explanation is most likely given the difference in equipment and experimental settings between our laboratory and those of referenced literature. Therefore, we would present as the peak value of elastin under our experimental conditions. Fig. 4SHG and TPEF cross sectional images of healthy and atherosclerotic iliac arteries from Ossabaw pigs. (a) SHG image of collagen and (b) TPEF image of elastin in a healthy artery. : Emission spectra of SHG signals from collagen (green) and TPEF signals from elastin (red). (c) Overlaid image of (a) and (b) with collagen (green) and elastin (red). (d) SHG image of collagen and (e) TPEF image of elastin in an atherosclerotic artery. (f) Overlaid image of (d) and (e) with collagen (green) and elastin (red). Images were acquired with a air objective. Scale bars: . (Color online only.) 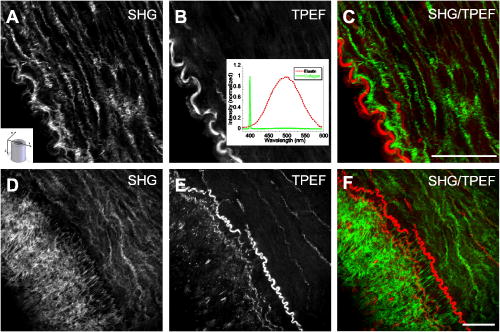 Fig. 5Verhoeff-Van Gieson (VVG) stained elastin fibers of an iliac arterial wall. Histology image was acquired with a air objective. Scale bar: . TPEF spectrum of a VVG stained elastin band and SHG spectrum of Masson’s trichrome stained collagen fibrils acquired with microspectrometry are shown in the inset of Fig. 4b. Stained elastin and collagen yielded the same spectra as those unstained in fresh tissues (data not shown).  With spectral selectivity of the collagen SHG signal and elastin autofluorescence signal, TPEF and SHG imaging of arteries from a cross sectional view was carried out to analyze distribution of elastin and collagen in an atheroma. The collagen and elastin contrasts were clearly distinguished from one another (Fig. 4). In a healthy artery, it was shown that collagen fibers were mostly located within the tunica media, delimited by an intact internal elastic membrane [Figs. 4a, 4b, 4c]. In contrast, in a diseased artery, collagen fibers were found to extend beyond an interrupted internal elastic membrane [Figs. 4d, 4e, 4f]. To further quantify the depth distribution of TPEF and SHG signals, we performed NLO imaging of arteries from a luminal view. Consistent with the described cross sectional view of a healthy artery, we observed that TPEF signal of elastin appeared first, then both collagen and elastin appeared at a greater depth from the lumen [Figs. 6a and 6b ]. The peak intensity for collagen appeared at approximately deeper than that for elastin. On the contrary, TPEF and SHG signals appeared together from the lumen surface of an artery with atheroma [Figs. 6d, 6e, 6f]. The different depth distribution of collagen and elastin between healthy artery and atheroma was clearly seen. These results show that multimodal SHG and TPEF imaging enables a clear demarcation between normal arterial wall and atheroma based on the order of appearance of their respective signals. Fig. 6Depth characterizations of healthy and atherosclerotic iliac arteries from Ossabaw pigs. (a) and (b) Luminal view of elastin (red) and collagen (green) in a healthy artery at two different depths from the lumen. (c) Depth intensity profiles of elastin (red) and collagen (green) in a healthy artery. (d) and (e) Luminal view of elastin (red) and collagen (green) in an atherosclerotic lesion at two different depths from the lumen. (f) Depth intensity profile of elastin (red) and collagen (green) in an atherosclerotic lesion. Images were acquired with a air objective. Scale bars: . (Color online only.)  During multimodal imaging of atherosclerotic lesions, we observed strong TPEF [Fig. 7a ] and CARS [Fig. 7b] signals from particles inside lipid-rich cells. Interestingly, although most TPEF signals colocalized with the CARS signals, far more particles were detected with CARS than TPEF [Fig. 7c]. To have a better understanding of these two signals, we performed microspectroscopy analysis of single TPEF or CARS active particles using a spectrometer installed at the back port of our microscope and appropriate excitation laser sources (Sec. 2 Methods, Fig. 1). Figure 7d shows a broad TPEF band that peaks at and a narrow CARS band at . The origin of the observed TPEF signal can be explained as follows. In a typical lipid-rich cell, cholesterol esters of oxidized LDL particles are hydrolyzed to free cholesterol and fatty acid.2 Free cholesterol molecules are then transported to the membrane and effluxed to extracellular receptors in a process described as reverse cholesterol transport. When extracellular cholesterol receptors are limiting, excess cellular cholesterol is re-esterified by acyl coenzyme A: acylcholesterol transferase, and deposited in the cytosol as insoluble lipid droplets.36 Because oxidized LDL particles have been shown to have a strong autofluorescence spectrum around 500 and ,11, 37 they most likely give rise to the observed TPEF signals from lipid-rich cells, whereas CARS signals should arise from both cholesterol-rich LDL particles and lipid droplets, which are rich in groups. To verify this assignment, we recorded two-photon autofluorescence spectra of purified LDL particles (LP2-2MG, Chemicon) at different stages of oxidation. An emission maximum at was observed after oxidation with for (Fig. 8 ). This value is close to our reported value of for oxidized LDL in lipid-rich cells [Fig. 7d]. However, lipid particles in lipid-rich cells showed a broader two-photon autofluorescence band [Fig. 7d]. The difference in spectral maxima and shape is likely due to lipid particles comprising different stages of oxidized LDL. Another reason is that fluorescent components other than LDL are present in the excitation volume. Additionally, LDL purified from plasma and oxidized with might be different from oxidized LDL in lipid-rich cells that use different means of oxidation. In summary, Fig. 7 shows the ability of our setup to monitor oxidized LDL particles and lipid droplets in the same lipid-rich cell by TPEF and CARS, respectively. As lipid-rich cells are becoming an important target for therapeutic intervention,36 this capability would be crucial to assay the functional activity of lipid-rich cells. Fig. 7Characterization of oxidized LDL aggregates and lipid droplets in lipid-rich cells of an atherosclerotic plaque by TPEF and CARS microscopy. (a) TPEF image of oxidized LDL aggregates and (b) CARS image of lipid droplets in an atherosclerotic lesion. Images were acquired with a air objective. Scale bars: . (c) Overlay of the TPEF (green) and CARS (red) images. (d) Emission spectra of TPEF signals from oxidized LDL aggregates (green) and CARS signals from lipid droplets (red). (Color online only.)  Fig. 8Two-photon autofluorescence spectra of purified native LDL (blue) and LDL oxidized with for (green) and (red). Purified human LDL purchased from Chemicon (LP2-2MG) was diluted to a final concentration of with PBS buffer (native) or of in PBS buffer for oxidation. LDL samples were incubated at 37°C. LDL spectra were acquired over the oxidation process using a microspectrometer described in Fig. 1. Oxidation of LDL red shifted the emission spectra. Complete LDL oxidation was observed at after addition. (Color online only.)  The rupture risk of an atheroma is associated with a thin collagen fibrous cap, increased extracellular lipid droplet deposits, and abundance of lipid-rich cells. 4, 6, 7, 38 To test whether multimodal NLO imaging is able to identify plaque rupture vulnerability, we performed SHG imaging of collagen, TPEF imaging of oxidized LDL, and CARS imaging of lipid-rich cells and extracellular lipid droplets within an atheroma. The results for a specific region are shown in Figs. 9a through 9d . Based on the location of the internal elastic membrane detected with TPEF and the orientation of collagen fibrils detected with SHG, this atheroma was determined to be approximately thick. Based on CARS and TPEF signal intensity as a function of the image field of view, the majority of extracellular lipid and lipid-rich cell CARS signals appeared within of the arterial lumen [Fig. 9d]. The density of extracellular lipid and lipid-rich cells in subendo-thelial space is further confirmed by histology of an atherosclerotic lesion stained for lipid with Oil Red O [Fig. 9e]. In addition, a significant reduction of collagen density was observed in the area of the affected intima where lipid-rich cells were located [Fig. 9f]. This observation is consistent with previous findings on lipid-rich cells’ secretion of proteases that degrade the extracellular matrix.2 In summary, Fig. 9 showed that a region vulnerable to rupture risk could be clearly detected by NLO imaging of atheroma composition. In addition, as plaque rupture vulnerability is predicted based on the concentration of collagen fibrils and lipid-rich cells near the arterial lumen [Figs. 9d and 9f], NLO imaging should be capable of analyzing rupture risk, despite its inherent limitation in penetration depth.18, 38 Fig. 9Characterization of atherosclerotic plaques vulnerable to rupture by multimodal NLO microscopy. (a), (b), and (c) Cross sectional images of (a) collagen (SHG), (b) lipid-rich cells, and extracellular lipid droplets (CARS), and (c) elastin and oxidized LDL aggregates (TPEF). (d) Overlay of CARS (red), SHG (green), and TPEF (blue) images. (e) Histology of an atherosclerotic lesion stained with Oil Red O. (f) Average SHG (collagen, green), TPEF (oxidized LDL aggregates and elastin, blue), and CARS (lipid-rich cells and extracellular lipid droplets, red) intensity as a function of atheroma thickness. Images were acquired with a air objective. Scale bars: . (Color online only.)  Further, SHG and TPEF imaging of an entire atherosclerotic artery was performed to determine the relative position of a vulnerable region within an atheroma (Fig. 10 ). Based on SHG imaging of collagen fibrils orientation in arterial wall and atheroma, the atheroma was found to occupy half of the artery (from 210 to , Fig. 10). Combined SHG imaging of collagen fibrils and TPEF imaging of oxidized LDL aggregates showed a significant increase of oxidized LDL density accompanying a marked reduction of collagen fibrils concentration at one shoulder region of this atheroma (Fig. 10, color panel ). This observation suggests that the rupture risk of this atheroma is highest at one shoulder region. The rupture risk of plaque at shoulder regions has been previously observed with histological analysis.2 Hence, multimodal NLO imaging of plaque composition permits identification of specific regions vulnerable to rupture within an atheroma without any labeling. Fig. 10Imaging rupture vulnerability of an atheroma. Gray panels: SHG imaging of a whole artery to determine degree atheroma. The artery was rotated at approximately a 30-deg angle for each frame. The degree atheroma of this artery is (from 210 to ). Color panels: SHG (green) and TPEF (red) evaluation of an affected area vulnerable to rupture. These images showed that lipid-rich cells were concentrating toward the lumen and one shoulder region of an atheroma . Collagen density at this shoulder area was also drastically reduced. Cross sectioned images acquired with a air objective. Scale bars: . (Color online only.)  4.DiscussionLike many complex human diseases, atherosclerosis is affected by a number of risk factors. Among them are genetic susceptibility, high blood cholesterol level, diabetes, obesity, high-fat diet, smoking, and lack of exercise.2 Although genetic susceptibility accounts for a high percentage of atherosclerosis incidence within a population, variations in disease incidence in population migration studies suggest that environmental factors play a large role in disease etiology.39 In addition, the impact on atherosclerosis by interactions of the risk factors is not simply additive, but rather exponentially amplified.2 The complex disease etiology is reflected in interindividual variations in response to drug therapy. For example, statin, a drug that lowers blood cholesterol levels, fails to prevent up to 70% of the incidence of acute coronary syndrome.38 Moreover, drugs that target the expression or function of a protein vary significantly in their intended effect in patients due to individualistic variations in both genomic makeup and postgenomic events.36, 40 In light of interindividual variations in disease etiology, progression, and response to drug therapy, the challenge of modern medicine lies in individualized disease diagnosis and intervention. One opportunity for individualized diagnosis can be derived from molecular imaging of atherosclerotic lesions by multimodal NLO microscopy. As shown in this work, CARS, SHG, and TPEF imaging enable label-free 3-D visualization of various significant components of plaques such as extracellular lipid deposits, oxidized LDL aggregates, lipid-rich cells, collagen, and elastin. Application of microspectrometry to spectrally separate NLO signals further suggests the potential use of spectral imaging to quantify plaque composition. In addition, multimodal NLO imaging is able to identify areas with atherosclerotic plaques that are vulnerable to rupture risk. These capabilities, when employed in a clinical setting, could allow diagnosis of different stages of atherosclerotic lesions as well as determination of their vulnerability to rupture, and enable design of treatment strategies that are best suited to each patient. The imaging results described also provide useful information for the development of multiphoton endoscopy,41 which holds great promise in clinical diagnosis of atherosclerotic lesions. First, we showed that atheroma could be visualized by NLO signals in a label-free manner. Label-free imaging overcomes the challenges of inefficient diffusion and nonspecific targeting of exogenous fluorophores in the complex in-vivo environment. Second, our data suggest that sensitivity and accuracy of NLO endoscopic diagnosis can be significantly improved by multimodality acquisition and analysis of two-photon autofluorescence, SHG, and CARS signals from the same area. Third, because SHG and CARS do not require electronic resonance, longer excitation wavelengths can be used, which would minimize mutiphoton absorption-induced photodamage. Moreover, photobleaching can be eliminated with SHG and CARS endoscopy. Finally, we anticipate that label-free multiphoton endoscopy can be coupled with currently used imaging modalities such as OCT and IVUS7, 8 on the same catheter-based platform. This combination would create a multimodal imaging tool that is capable of cross sectional morphology mapping with OCT and IVUS, and 3-D submicrometric molecular imaging of plaque composition with multiphoton endoscopy. AcknowledgmentsThe authors acknowledge Haifeng Wang for the construction of the microspectrometer and Han-Wei Wang for the schematic illustration of the experimental setup. This work was supported by a NIH R21 grant EB004966-01 to Cheng, and NIH grants RR013223 and HL062552 to Sturek. ReferencesW. Rosamond,
“Heart disease and stroke statistics—2007 update: A report from the American Heart Association Statistics Committee and Stroke Statistics Subcommittee,”
(2007) Google Scholar
A. J. Lusis,
“Atherosclerosis,”
Nature (London), 407 233
–241
(2000). https://doi.org/10.1038/35025203 0028-0836 Google Scholar
P. Libby,
“Inflammation in atherosclerosis,”
Nature (London), 420 868
–874
(2002). https://doi.org/10.1038/nature01323 0028-0836 Google Scholar
Z. A. Fayad and
V. Fuster,
“Clinical imaging of the high-risk or vulnerable atherosclerotic plaque,”
Circ. Res., 89 305
–316
(2001). https://doi.org/10.1161/hh1601.095596 0009-7330 Google Scholar
A. Fischer,
D. E. Gutstein,
Z. A. Fayad, and
V. Fuster,
“Predicting plaque rupture: enhancing diagnosis and clinical decision-making in coronary artery disease,”
Vasc. Med., 5 163
–172
(2000). 1358-863X Google Scholar
M. J. Davies,
P. D. Richardson,
N. Woolf,
D. R. Katz, and
J. Mann,
“Risk of thrombosis in human atherosclerotic plaques—role of extracellular lipid, macrophage, and smooth-muscle cell content,”
Br. Heart J., 69 377
–381
(1993). https://doi.org/10.1136/hrt.69.5.377 0007-0769 Google Scholar
R. P. Choudhury,
V. Fuster, and
Z. A. Fayad,
“Molecular, cellular and functional imaging of atherothrombosis,”
Nat. Rev. Drug Discovery, 3 913
–925
(2004). https://doi.org/10.1038/nrd1548 1474-1776 Google Scholar
G. J. Tearney,
M. E. Brezinski,
B. E. Bouma,
S. A. Boppart,
C. Pitris,
J. F. Southern, and
J. G. Fujimoto,
“In vivo endoscopic optical biopsy with optical coherence tomography,”
Science, 276 2037
–2039
(1997). https://doi.org/10.1126/science.276.5321.2037 0036-8075 Google Scholar
D. Stamper,
N. J. Weissman, and
M. Brezinski,
“Plaque characterization with optical coherence tomography,”
J. Am. Coll. Cardiol., 47 C69
–C79
(2006). https://doi.org/10.1016/j.jacc.2005.10.067 0735-1097 Google Scholar
L. Marcu,
M. C. Fishbein,
J. M. I. Maarek, and
W. S. Grundfest,
“Discrimination of human coronary artery atherosclerotic lipid-rich lesions by time-resolved laser-induced fluorescence spectroscopy,”
Arterioscler., Thromb., Vasc. Biol., 21 1244
–1250
(2001). https://doi.org/10.1161/hq0701.092091 1079-5642 Google Scholar
K. Arakawa,
K. Isoda,
T. Ito,
K. Nakajima,
T. Shibuya, and
F. Ohsuzu,
“Fluorescence analysis of biochemical constituents identifies atherosclerotic plaque with a thin fibrous cap,”
Arterioscler., Thromb., Vasc. Biol., 22 1002
–1007
(2002). https://doi.org/10.1161/01.ATV.0000017461.79231.3D 1079-5642 Google Scholar
M. B. Lilledahl,
O. A. Haugen,
M. Barkost, and
L. O. Svaasand,
“Reflection spectroscopy of atherosclerotic plaque,”
J. Biomed. Opt., 11 021005
(2006). https://doi.org/10.1117/1.2186332 1083-3668 Google Scholar
T. J. Romer,
J. F. Brennan,
M. Fitzmaurice,
M. L. Feldstein, G. Deinum, J. L. Myles,
J. R. Kramer,
R. S. Lees, and
M. S. Feld,
“Histopathology of human coronary atherosclerosis by quantifying its chemical composition with Raman spectroscopy,”
Circulation, 97 878
–885
(1998). 0009-7322 Google Scholar
J. T. Motz,
M. Fitzmaurice,
A. Miller,
S. J. Gandhi,
A. S. Haka,
L. H. Galindo,
R. R. Dasari,
J. R. Kramer, and
M. S. Feld,
“In vivo Raman spectral pathology of human atherosclerosis and vulnerable plaque,”
J. Biomed. Opt., 11 021003
(2006). https://doi.org/10.1117/1.2190967 1083-3668 Google Scholar
A. N. Pande,
R. H. Kohler,
E. Aikawa,
R. Wiessleder, and
F. A. Jaffer,
“Detection of macrophage activity in atherosclerosis in vivo using multi-channel, high-resolution laser scanning fluorescent microscopy,”
J. Biomed. Opt., 11 021009
(2005). https://doi.org/10.1117/1.2186337 1083-3668 Google Scholar
S. K. Nadkarni,
B. E. Bouma,
T. Helg,
R. Chan,
E. Halpern,
A. Chau,
M. S. Minsky,
J. T. Motz,
S. L. Houser, and
G. J. Tearney,
“Characterization of atherosclerotic plaques by laser speckle imaging,”
Circulation, 112 885
–892
(2005). https://doi.org/10.1161/CIRCULATIONAHA.104.520098 0009-7322 Google Scholar
W. R. Zipfel,
R. M. Williams, and
W. W. Webb,
“Nonlinear magic: multiphoton microscopy in the biosciences,”
Nat. Biotechnol., 21 1369
–1377
(2003). https://doi.org/10.1038/nbt899 1087-0156 Google Scholar
F. Helmchen and
W. Denk,
“Deep tissue two-photon microscopy,”
Nat. Methods, 2 932
–940
(2005). 1548-7091 Google Scholar
M. van Zandvoort,
W. Engels,
K. Douma,
L. Beckers,
M. Egbrink,
M. Daemen, and
D. W. Slaaf,
“Two-photon microscopy for imaging of the (atherosclerotic) vascular wall: A proof of concept study,”
J. Vasc. Res., 41 54
–63
(2004). https://doi.org/10.1159/000076246 1018-1172 Google Scholar
A. Zoumi,
X. A. Lu,
G. S. Kassab, and
B. J. Tromberg,
“Imaging coronary artery microstructure using second-harmonic and two-photon fluorescence microscopy,”
Biophys. J., 87 2778
–2786
(2004). https://doi.org/10.1529/biophysj.104.042887 0006-3495 Google Scholar
T. Boulesteix,
A. M. Pena,
N. Pages,
G. Godeau,
M. P. Sauviat,
E. Beaurepaire, and
M. C. Schanne-Klein,
“Micrometer scale ex vivo multiphoton imaging of unstained arterial wall structure,”
Cytometry Part A, 69A 20
–26
(2006). Google Scholar
P. J. Campagnola and
L. M. Loew,
“Second-harmonic imaging microscopy for visualizing biomolecular arrays in cells, tissues and organisms,”
Nat. Biotechnol., 21 1356
–1360
(2003). https://doi.org/10.1038/nbt894 1087-0156 Google Scholar
J. X. Cheng and
X. S. Xie,
“Coherent anti-Stokes Raman scattering microscopy: Instrumentation, theory, and applications,”
J. Phys. Chem. B, 108 827
–840
(2004). https://doi.org/10.1021/jp035693v 1089-5647 Google Scholar
J. X. Cheng,
Y. K. Jia,
G. F. Zheng, and
X. S. Xie,
“Laser-scanning coherent anti-Stokes Raman scattering microscopy and applications to cell biology,”
Biophys. J., 83 502
–509
(2002). 0006-3495 Google Scholar
C. L. Evans,
E. O. Potma,
M. Puoris’haag,
D. Cote,
C. P. Lin, and
X. S. Xie,
“Chemical imaging of tissue in vivo with video-rate coherent anti-Stokes Raman scattering microscopy,”
Proc. Natl. Acad. Sci. U.S.A., 102 16807
–16812
(2005). https://doi.org/10.1073/pnas.0508282102 0027-8424 Google Scholar
H. F. Wang,
Y. Fu,
P. Zickmund,
R. Y. Shi, and
J. X. Cheng,
“Coherent anti-Stokes Raman scattering imaging of axonal myelin in live spinal tissues,”
Biophys. J., 89 581
–591
(2005). https://doi.org/10.1529/biophysj.105.061911 0006-3495 Google Scholar
W. R. Zipfel,
R. M. Williams,
R. Christie,
A. Y. Nikitin, B. T. Hyman, W. W. Webb,
“Live tissue intrinsic emission microscopy using multiphoton-excited native fluorescence and second harmonic generation,”
Proc. Natl. Acad. Sci. U.S.A., 100 7075
–7080
(2003). https://doi.org/10.1073/pnas.0832308100 0027-8424 Google Scholar
K. Konig,
K. Schenke-Layland,
I. Riemann, and
U. A. Stock,
“Multiphoton autofluorescence imaging of intratissue elastic fibers,”
Biomaterials, 26 495
–500
(2005). https://doi.org/10.1016/j.biomaterials.2004.02.059 0142-9612 Google Scholar
M. C. Dyson,
M. Alloosh,
J. P. Vuchetich,
E. A. Mokelke, and
M. Sturek,
“Components of metabolic syndrome and coronary artery disease in female Ossabaw swine fed excess atherogenic diet,”
Comp. Med., 56 35
–45
(2006). Google Scholar
M. Sturek,
“Ossabaw Island miniature swine: Cardiometabolic syndrome assessment,”
Swine in the Laboratory: Surgery, Anesthesia, Imaging, and Experimental Techniques, 397
–402 2nd EditionBoca Raton: CRC Press,2007). Google Scholar
J. V. Neel,
“Diabetes mellitus - a thrifty genotype rendered detrimental by progress,”
Am. J. Hum. Genet., 14 353
–362
(1962). 0002-9297 Google Scholar
R. J. Martin,
J. L. Gobble,
T. H. Hartsock,
H. B. Graves, and
J. H. Ziegler,
“Characterization of an obese syndrome in pig,”
Proc. Soc. Exp. Biol. Med., 143 198
–203
(1973). 0037-9727 Google Scholar
R. G. Gerrity,
R. Natarajan,
J. L. Nadler, and
T. Kimsey,
“Diabetes-induced accelerated atherosclerosis in swine,”
Diabetes, 50 1654
–1665
(2001). https://doi.org/10.2337/diabetes.50.7.1654 0012-1797 Google Scholar
G. Wolfbauer,
J. M. Glick,
L. K. Minor, and
G. H. Rothblat,
“Development of the smooth-muscle foam cell—uptake of macrophage lipid inclusions,”
Proc. Natl. Acad. Sci. U.S.A., 83 7760
–7764
(1986). https://doi.org/10.1073/pnas.83.20.7760 0027-8424 Google Scholar
P. E. Bickel and
M. W. Freeman,
“Rabbit aortic smooth-muscle cells express inducible macrophage scavenger receptor messenger-RNA that is absent from endothelial cells,”
J. Clin. Invest., 90 1450
–1457
(1992). 0021-9738 Google Scholar
A. C. Li and
C. K. Glass,
“The macrophage foam cell as a target for therapeutic intervention,”
Nat. Med., 8 1235
–1242
(2002). 1078-8956 Google Scholar
G. O. Angheloiu,
J. T. Arendt,
M. G. Muller,
A. S. Haka, I. Georgakoudi, J. T. Motz,
O. R. Scepanovic,
B. D. Kuban,
J. Myles,
F. Miller,
E. A. Podrez,
M. Fitzmaurice,
J. R. Kramer, and
M. S. Feld,
“Intrinsic fluorescence and diffuse reflectance spectroscopy identify superficial foam cells in coronary plaques prone to erosion,”
Arterioscler., Thromb., Vasc. Biol., 26 1594
–1600
(2006). https://doi.org/10.1161/01.ATV.0000225699.36212.23 1079-5642 Google Scholar
P. Libby and
M. Aikawa,
“Stabilization of atherosclerotic plaques: New mechanisms and clinical targets,”
Nat. Med., 8 1257
–1262
(2002). 1078-8956 Google Scholar
U. Goldbourt and
H. N. Neufeld,
“Genetic-aspects of arteriosclerosis,”
Arteriosclerosis (Dallas), 6 357
–377
(1986). 0276-5047 Google Scholar
W. E. Evans and
M. V. Relling,
“Moving towards individualized medicine with pharmacogenomics,”
Nature (London), 429 464
–468
(2004). https://doi.org/10.1038/nature02626 0028-0836 Google Scholar
B. A. Flusberg,
E. D. Cocker,
W. Piyawattanametha,
J. C. Jung,
E. L. M. Cheung, and
M. J. Schnitzer,
“Fiber-optic fluorescence imaging,”
Nat. Methods, 2 941
–950
(2005). 1548-7091 Google Scholar
|


