
|
|
1.IntroductionThe ability to separate rare cells from a mixed population of cells is of great importance in biology and medicine. For example, the separation of stem cells from the bone marrow (one cell in ) or metastatic cancer cells from peripheral blood is of current clinical interest. Many innovative sorting techniques are emerging that show promise for sorting these rare cell types. A traditional system for sorting cells makes use of immunolabeling. Antibodies to cell surface markers are used to attach magnetic beads or fluorescent tags to cells of interest, facilitating magnetic cell sorting1 or fluorescently activated cell sorting.2 Tagging cells in this manner is time consuming and is dependent on the use of available antibodies to known cell surface markers. These technologies make use of large amounts (millilitres) of analyte and millions of cells. New technologies for cell sorting are emerging that can be used with rare or precious cell samples in nanoliter volumes. For such volumes, we need new and innovative sorting schemes that readily deal with small volumes of analyte and are powerful in a microfluidic environment. A recent, exciting method to achieve sorting is to utilize sculpted optical potential energy landscapes (patterns) in combination with microfluidics,3 where optical forces may induce motion in the absence of flow or compete with Stokes drag forces in a flow to initiate separation. In the flow-free regime, the varying optical gradient force experienced by an object causes it to move across the landscape to the brightest part of the optical field.4 Optophoresis uses a moving optical gradient field where cells in a population are analyzed according to their induced or modified motion.5 A ring pattern has been used for separation of fast and slow moving sperm, trapping the slow moving cells in the ring but allowing the more motile cells to escape the trap.6 Acousto-optically generated potential energy landscapes have been used to sort polydispersed colloid.7 Dielectrophoresis (DEP), the translational motion of charge-neutral matter caused by polarization effects in nonuniform electric fields,8, 9 and light-induced dielectrophoresis10 are other potential schemes for sorting. In the presence of flow, these methods for cell sorting require microfluidic systems, which may need expensive micropumps and specialized microchambers in which to perform assays,3 or the fabrication of microfluidic channels coupled to electrodes.8, 9, 10 Flow-free methods thus may have advantages in some instances. Furthermore, it is important to state that all optical methods of cell sorting, either with or without flow, are generally unproven for a variety of cell phenotypes, though much promise is shown with colloidal particles.3 In this work multiple cell types are explored with respect to our flow-free optical sorting method. Erythrocytes and lymphocytes, the HL60 human promyelocytic leukaemia cell line, and murine bone marrow and progenitor/stem cells, are all passively sorted using the pattern of a 'nondiffracting' Bessel beam. These cell types are of importance in biology and especially medicine, where sorting and recovery of these precious cells from a small amount of analyte is desired. Differences in size or refractive index between cell types due to their intrinsic properties may result in varying optical forces on the cells, and can be used to sort these native (unlabeled) cell types in our passive optical cell sorter. It has been reported that mesenchymal stem cells (MSCs) have unique qualities distinct from fully differentiated cells, such as cytoskeleton organization,11 which may influence shape due to altered stress levels within the cell,12 and cell density.13 These properties may result in stem cells having a different refractive index from fully differentiated cells, and these differences may be utilized in our flow-free, passive, optical cell sorter. The passive, optical sorter is a simple light pattern of concentric rings with a bright central maximum created by a Bessel beam. This work is the first detailed study of a passive optical cell sorter where multiple cell types are examined. Our results are applicable to both flow-free and microfluidic optical cell sorters, where optical forces on particles compete with drag force. The work is structured as follows:
2.ResultsIn the following three sections, we examine the movement of different particles and cell types in the Bessel beam to determine if we can sort cells using merely the optical forces of the beam (using no microfluidic flow or specialist sample chambers). We question if these cells can be sorted by simply relying on their intrinsic properties (specifically their size and their refractive index). Single cell migration assays were performed by positioning a single particle or cell at ring 5 of the Bessel beam pattern. The migration time for cells to be transported from ring 5 into the beam central core using the optical force of the pattern was measured for various optical powers and for many cell and microsphere populations. In the first section, the migration times of microspheres in the Bessel beam cell sorter are described as the refractive index, and the size of sphere samples is varied. Next, the migration times of native (unlabeled) cells in the beam are examined to determine if the Bessel beam can be used to separate cells without the need to prelabel cells of interest. The blood cells—lymphocytes and erythrocytes—are examined in the first instance, and then HL60 human promyelocytic leukaemia cells, and finally murine bone marrow cells and murine hematopoietic progenitor/stem cells are tested. A large difference in size or refractive index between cell types is required for passive separation in the Bessel beam, and the heterogeneity within or between most cell types tested does not consist of large enough differences (in size or refractive index) for separation to occur. To improve separation, microspheres can be attached to cells of interest to change the overall size and refractive index of these cells. These microspheres are biocompatible and will also work well within a microfluidic environment. The attachment of a dielectric tag (silica microsphere) to cells of interest and the enhanced movement of the cell-sphere complex in the beam is described. The tagging of cells of interest leads to the passive sorting of human promyelocytic leukaemia cells and murine hematopoietic stem cells. 2.1.Microspheres in the Bessel BeamMicrospheres were used in the Bessel beam to indicate how variations in size and/or refractive index of particles influence their movement in the beam pattern. The migration times (the time for a particle to travel from ring 5 of the Bessel beam to the central core) for many single microspheres of different size and refractive index are measured. The Bessel beam that is used here is described in Sec. 3.1. All powers quoted in this work are the total beam power used, except when stated otherwise. In this experiment, a beam power of (measured at the laser output) is chosen so that microspheres travel to the beam center and only then guide upward in the central core. At powers higher than , some spheres will guide prematurely (in the outer rings before reaching the central core). The spheres guide vertically upward due to radiation pressure from the upwardly directed beam. Silica spheres of refractive index 1.4 (Bangs Laboratories, Inc., Fishers, IN, USA and G. Kisker GdR, Steinfurt, Germany) and polymer microspheres of refractive index 1.59 (Duke Scientific Corporation, Fremont, CA, USA) of 1, 5, 10, and diameter are used, and the migration times for ten spheres of each type were measured. The beam central core is , with a ring thickness of around and spacing between rings of around . One micron and -diam spheres, of both silica and polymer, do not migrate toward the beam center when placed initially at ring 5. The spheres are trapped in ring 5 and are guided upward within ring 5 at . spheres are also trapped or locked in between rings 5 and 6. These spheres also guide upward at , remaining trapped in ring 5. This “nonmigratory” behavior does not depend on material (in other words refractive index), but is influenced by the size of the particles. Increasing (difference in refractive index between medium and particle) increases the potential well that the particle experiences, so if the particle is trapped or locked in to a ring, it will remain trapped, but more strongly.14 The migration times of 10- and -diam spheres of different refractive index can be seen in Fig. 1 . There is no significant difference in migration time when the refractive index is kept constant, but sphere diameter is doubled from for either silica or polymer spheres. However, comparing spheres of the same size but different refractive index (material), we do see a significant difference in the migration time. For silica spheres of diam , the average migration time is , whereas a polymer sphere takes . A silica sphere takes , whereas the migration time for a polymer sphere is . Fig. 1Mean migration times for silica or polymer microspheres of 10 or in water to travel from ring 5 to the central core of a Bessel beam of total power . 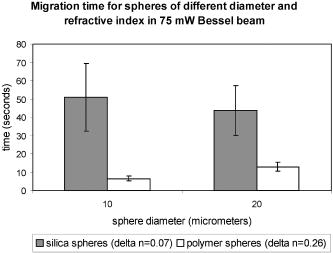 In summary, we can use this information as an indicator toward the movement of cells in the Bessel beam cell sorter. Cells with a large difference in size (for example 2 and diam) can be sorted, as the small cells will be trapped in the outer rings as the 1- and spheres were, and cells will travel to the beam center, as the spheres did. However, for cells that vary in size between 10 and , or are similar in size, separation may not occur. It is likely that in a mixed population of cells there will not be large enough differences in refractive index or size between populations, so separation may not be possible. This is investigated experimentally in the following section. 2.2.Native (Unlabeled) Cells in the Bessel BeamIdeally, we wish to use the Bessel beam to sort cells in their native (unlabeled) state and use only the intrinsic optical properties of the native cells (size, refractive index, and scattering) to achieve separation of different cell types in our pattern of concentric rings. Using a similar single-cell migration assay used for the microspheres, we build up statistics of the time it takes different cell types to travel in the beam from ring 5 to the beam center. The cell types investigated were erythrocytes and lymphocytes, the HL60 human promyelocytic leukaemic cell line, and finally murine bone marrow and hematopoietic progenitor/stem cells. 2.2.1.Cells of Different Size: Erythrocytes and LymphocytesFor single cell migration assays, sample chambers were filled with either erythrocytes or lymphocytes (approximately cells) in media [RPMI 1640 plus 10% fetal calf serum (FCS) and penicillin, streptomycin, and glutamine (P/S/G)] (see Sec. 3.3.1). Individual, spherically shaped lymphocytes were positioned at ring 5 of the Bessel beam and traveled toward the central core, where they were eventually guided upward within the nondiffracting core to the top of the sample chamber. The time for cells to travel from ring 5 to the central core was measured for at least 70 cells in each of three power levels of 150, 350, and . The velocities of lymphocytes traveling between successive rings for the three power levels can be seen in Fig. 2 . The cells experience a stronger gradient force as they approach the central maximum, because each ring has an equal optical power but ring size decreases toward the beam center, therefore the intensity of each ring increases toward the beam core. Many erythrocytes in a low-power Bessel beam travel toward the beam center, and their velocity also increases as they are drawn closer to the beam core. However, they travel at a lower velocity than the lymphocytes, and this can also be seen in Fig. 2. The curves drawn through the points illustrate that, in general, as lymphocytes or erythrocytes are drawn closer to the central core their velocity increases with the exception of lymphocytes in the 350- and beam traveling from the ring 4 to ring 3. We attribute this to a “hot spot” in the Bessel beam that traps the cells at ring 4 for an extended length of time. At , the hot spot is not a deep enough potential well to hold the erythrocytes or the lymphocytes. Fig. 2The mean velocity of lymphocytes traveling across the Bessel beam from ring 5 to the central core for three power levels; 150, 350, and . Also shown is the mean velocity of erythrocytes, traveling from ring 5 until they reach the central core at . 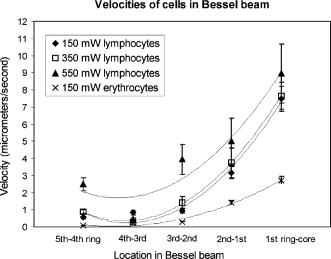 Raising the power from does not result in a significant increase in lymphocyte velocity toward the center of the beam; however, increasing the power to does. This is because raising the power to leads to increased thermal activation of the cells from the wells. There have been many observations of erythrocytes held in an optical trap and the effect of the light field on the cell.15, 16, 17 The erythrocytes are biconcave disks and are known to reorient when held within an optical trap with their longest axis aligned with the direction of beam propagation. Theoretical studies confirm this alignment behavior for erythrocytes in an optical trap.18 The behavior has also been interpreted as folding of the cell, rather than alignment.19 Erythrocytes trapped in this way have been used as cellular rotors by rotating an elongated laser beam,15 by rotating the polarization of a linearly polarized beam,20 in a hypertonic buffer where the shape of the cell changes from biconcave to a meniscus shape,21 and also by using circularly polarized light.22 When single erythrocytes were positioned at ring 5 in a Bessel beam to measure the migration time, only 60% of cells measured travel all the way to the central core. 20% of the cells align in the first ring of the Bessel beam, and a further 20% in the second ring. Only the erythrocytes that travel to the beam core and align there are represented in Fig. 2. At the two higher power levels of 350 and , the majority of the cells aligned before reaching the beam center, so instead of measuring migration time to the core, we measured the time taken for the cells to align and reorient only at these two power levels, and in which ring they were locked in to. We moved the starting position of the cell from ring 5 to ring 3 to determine if the position of the cell in the Bessel beam pattern influences the time it needs to align and the position of lock-in for 350 and of Bessel beam power. At , with the erythrocyte initially positioned at ring 5, time to align in the beam is (and, as mentioned before, 60% of these align in the core, 20% in ring 1, and 20% in ring 2). From Table 1 it can be seen that at , this time to align in any ring, when initially positioned at ring 5, is , and at it takes for an erythrocyte to align. By positioning the cell closer to the Bessel beam central core, at ring 3, the alignment time decreases. Reorientation and lock-in takes in a beam and in a beam with total power of . This shows that erythrocytes will take longer to lock in to rings when lower powers are used. It also takes erythrocytes longer to lock in if they are activated further from the central core (i.e., ring 5 is farther than ring 3). Table 1Mean time taken for erythrocytes to align (or lock in) to any ring of the Bessel beam. Time of alignment is measured at two power levels and for two starting positions (rings 5 and 3).
The location of alignment and lock-in of erythrocytes in the Bessel beam can be seen in Table 2 , and it shows that at , 28% of the cells align in ring 3, 70% in ring 4, and 2% in ring 5, when the cells are intitially positioned in ring 5. Notably, no cells are found locked into the central core, ring 1 or ring 2. When the cells are positioned in ring 3 (closer to the beam central core), we see that 20% of the cells align in ring 1 and 80% in ring 2. At a beam power of and a starting position of ring 5, 6% align in ring 3, 81% align in ring 4, and 13% in ring 5 (a higher proportion of cells are found in the outer rings as higher power is used). At but with the cells placed at ring 3, we see 20% of cells reoriented and locked into ring 1, 60% in ring 2, and 20% in ring 3. In summary, at higher total power, in combination with the cells being activated from the outer rings (placed at ring 5 rather than ring 3), cells will align and lock-in farther from the central core than if lower powers were used. In contrast, lymphocytes do not become locked in to any position until they reach the central core at all the power levels investigated. Therefore, when a Bessel beam of is exposed to a mixed sample of cells, the lymphocytes migrate along the bottom of the sample chamber toward the beam core and guide vertically upward when they reach the core, whereas the erythrocytes migrate toward the core more slowly but align and lock in to the outer rings of the Bessel beam, where they vertically guide upward. From ring 5, the lymphocytes take approximately to reach the beam core and guide,4 whereas the erythrocytes take approximately to align (Table 1) and will lock into rings 3, 4, and 5 (Table 2), away from the beam core. It is worth noting that if cells migrate from farther than ring 5, they lock in to rings farther from the core than ring five in a beam. In addition, raising the total beam power above for this experiment results in erythrocytes locking in to rings farther from the central core, but also results in lymphocytes being guided in the outer rings instead of the central core, because radiation pressure from the outer rings increases. This section has demonstrated the use of the Bessel beam pattern for sorting cells in a mixed sample of erythrocytes and lymphocytes. We have utilized the native properties of the cells—their difference in size in this case. We note that for one lymphocyte to be transported and separated from the erythrocytes will not result in a high throughput cell sorting device for separating cells in their native state, but may be of use for sorting small volumes of precious cells when only a small number of enriched cells need to be recovered for downstream processes. 2.2.2.Cells of One Type: HL60 Cell LineHL60 cells (a human promyelocytic leukemia cell line) are an example of cells that are all functionally and morphologically similar, but can be described as a heterogeneous population, as they vary in size (because they are at different stages of the cell cycle). These cells are used in the Bessel beam to determine if the variation in size of cells of a single type causes them to travel differently in the Bessel beam. Cells in the HL60 population ranged in diameter from , with a Gaussian distribution of size, the average diameter being around . The Bessel beam parameters used are described in Sec. 3.1. The arrangement is slightly altered compared to the previous experiment with erythrocytes and lymphocytes. The time taken for 100 individual cells of varying diameter to cross the Bessel beam rings from ring 5 to the central core did not show any clear trend (data not shown), although minimum times to reach the beam center are observed for cells between 9.5 and . This can be explained, as some cells are temporarily trapped in two or more of the rings of the Bessel beam as they overlap an integer number of rings. These cells will not feel attracted toward the next ring of higher intensity until Brownian motion or thermal activation allows them to progress forward toward the beam core. For example, a cell might occupy three rings plus the two spaces between the rings with a overhang on each side, and not be affected by the deeper potential well on one side. On the other hand, larger cells may not be trapped as strongly but might struggle to escape the potential wells of the rings due to their greater mass and low Brownian motion. However, this difference in time to travel to the beam center is not sufficient to separate cells that differ in size from when Bessel beam rings have a thickness of and spacing between rings of . In this case, the Bessel beam cannot be used to separate cells of different diameter belonging to a single cell line. We note that it may be possible to separate smaller -diam cells from the larger cells by tailoring the Bessel beam ring size, but the time for any separation to occur would be unpractical for a cell sorter. A description of Bessel beam parameters (e.g., ring size, central core diameter, and propagation distance) and how to control them can be found in Ref. 23. In the next section, we examine other important cell types in the Bessel beam: bone marrow cells and hematopoietic progenitor/stem cells. 2.2.3.Cells of Similar Size But Different Type: Murine Hematopoietic (Bone Marrow) Cells and Hematopoietic Progenitor/Stem CellsWe have shown in Sec. 2.2.1 that the Bessel beam can separate cells if they differ substantially in size (for example the -thick erythrocytes and the -diam lymphocytes). In addition, in Sec. 2.1 we have also shown that microspheres show a range of migration times depending on size and on refractive index of the particle. We hypothesized earlier that differences between stem cells and differentiated cells such as shape, density, cytoskeletal organization, nuclear shape, and membrane tension11, 12, 13 could also mean that stem cells and differentiated cells have different optical properties such as size, scattering, or index of refraction. Differences in refractive index between these cell types could be utilized for cell sorting in the optical pattern of a Bessel beam. This was tested by positioning murine cells, collected from the bone marrow (see Sec. 3.3.4), and early progenitor/stem cells, separated from the bone marrow cells using the Spinsep cell enrichment procedure (see Sec. 3.3.5), at ring 5 of the Bessel beam, and measuring the time for cells to travel to the beam, central core. The diameter of the bone marrow cells was similar to that of the early hematopoietic progenitors (stem cells) (ranged from with an average diameter of ). No trend was observed when cell diameter and time to travel in the beam were compared (data not shown). The average time taken for the two cell populations can be seen in Fig. 3 (the first two bars on each column) and show no significant difference. The migration times of 20 individual cells were measured for each power level. The mean time for bone marrow cells (which consist of many different cell types) to travel from ring 5 to the central core in a beam is whereas it takes for stem cells. In a beam, bone marrow cells take a mean time of and stem cells take . These values for migration time are quite different than the time for HL60 cells, because the murine bone marrow cells were found to be stickier than other cell types, which resulted in a larger overall migration time. Fig. 3Mean time for cells in the Bessel beam to travel from ring 5 to the beam central core. Cell types compared are murine bone marrow cells (a mixed population), murine hematopoietic progenitor/stem cells (enriched from the bone marrow but still a mixed population), and cells from the enriched population with silica spheres attached. Two power levels of 150 and of total Bessel beam power are compared.  In summary, the Bessel beam can be used to separate cells in their native state, as we have shown for erythrocytes and lymphocytes, but this depends on the difference in size, between the two cell populations to be separated, being relatively large. The smaller cells (erythrocytes) are trapped in individual rings of the pattern; the other cells (lymphocytes) are large enough to see the overall gradient force of the whole pattern, not individual rings, and migrate to the beam center. This was also shown with small spheres (one and ) and large spheres (10 and ). Work using microspheres also showed that changing the size of the microsphere from did not significantly change the migratory times in the Bessel beam, but changing the refractive index (from 1.4 to 1.59) did make a significant difference. These refractive indices are much higher than that of the cells (estimated to be around 1.37 to 1.38). The Bessel beam was not found to be sensitive enough to separate cells of the HL60 cell line according to differences in size (cells from diam). Two different cell types that we hypothesized to have different refractive indices, bone marrow cells and early hematopoietic progenitors (stem cells), originating from the bone marrow were also tested. Again, the Bessel beam was not sensitive enough to exert significantly different optical forces, thus migration times, on these cell types. Therefore it could not be utilized as a cell sorter in this case. 2.3.Attachment of Spheres to Cells to Enhance SortingAttaching a label (a silica microsphere) onto the surface of a cell population of interest will change the overall refractive index and size of a cell and, we hypothesize, decrease the migration times of labeled cells thus enhance passive, flow-free, cell sorting in the Bessel beam pattern. The migratory times of labeled and native (unlabeled) cells in the Bessel beam were measured, and differences in migration time between labeled and unlabeled cells were exploited for cell sorting. The attachment of microspheres to cells is compatible with microfluidics and is achievable with small amounts of analyte. In addition, as we show later, cells grow and divide in culture after sphere attachment, passive optical sorting, and collection by microcapillary. 2.3.1.HL60 cellsHL60 cells were labeled with -diam silica spheres (see Sec. 3.3.3) to modify the shape, scattering, and refractive index of the cells. The resulting movement of the two cell types (HL60 cells and HL60 cells with a silica sphere of diam attached) at two power levels (150 and of total Bessel beam power) are presented in Fig. 4 . The migration times of 100 unlabeled cells and 50 labeled cells were measured. Attaching a silica sphere to a cell reduces the time for the cell to travel from ring 5 into the central core. An unattached cell takes a mean time of to travel in a beam, whereas a cell with a silica sphere attached takes a mean time of . At a higher beam power of , the unlabeled cells take , and cells with spheres attached take only . At both power levels, the attachment of a silica sphere reduces the time taken for a cell to travel from ring 5 to the central core by at least 50%. Merely increasing the total beam power from leads to unlabeled cells migrating in instead of (43% reduction in time), and labeled cells migrating in instead of (20% reduction in migration time). We attribute this larger reduction in migration time of unlabeled cells to the increased thermal activation of the unlabeled cells due to the increase optical power, whereas the larger mass of the labeled cells means that they do not react as strongly to any heating at these powers. (It will take higher optical powers to thermally activate these larger complexes from the Bessel beam rings). Fig. 4Mean migration times for HL60 cells and HL60 cells plus silica sphere attached in the Bessel beam, measured for 150 and of total Bessel beam power.  Guiding time was measured on ten unlabeled and ten labeled cells. The average time for a cell to be guided a vertical distance of upward in the central core of a beam is . With a sphere attached, the cells are guided the same distance in . Guiding of cells with spheres attached in the beam often occurs before the cell-sphere complex reaches the beam central core, whereas unlabeled cells are only seen to guide once they have reached the central core. Enhanced movement, from ring 5 to the central core of the Bessel beam, of a cell-sphere complex is primarily the result of a greater difference in refractive index between the cell-sphere complex and the surrounding medium, compared to the refractive index difference between an unlabeled cell and the medium. Cell-sphere complexes experience a stronger gradient force across the whole Bessel beam pattern due to their higher overall refractive index than the unlabeled cells. The cell-sphere complexes are also guided more rapidly than unlabeled cells, as spheres experience stronger radiation pressure due to increased scattering in the direction opposite to beam propagation. 2.3.2.Hematopoietic stem/progenitor cellsWe were unable to separate unlabeled early hematopoietic progenitor/stem cells from bone marrow cells using the Bessel beam and the intrinsic properties of the cells (differences in refractive index). To overcome this problem, we can label a subset of progenitors, the stem cell population with microspheres, to achieve a spatial separation within the Bessel beam pattern of murine bone marrow cells and this stem cell subtype found within the bone marrow population. Silica spheres were attached to a subpopulation of the separated, enriched, early progenitors (the cells) using an antibody to the cell surface marker (see Sec. 3.3.6). These cells were similarly placed in the Bessel beam and the mean migration time for these cell-sphere complexes to travel are represented in the third bar of the two sections of Fig. 3. 40 labeled cells were measured for both power levels. In a Bessel beam, it takes seconds for the cell sphere to travel from ring 5 to the beam central core and in a Bessel beam, the mean time is . This is approximately 10% of the time it takes for unlabeled cells to travel. Interestingly, increasing the laser power from does not significantly decrease migration time of the cell-sphere complex. The guiding due to radiation pressure acting on the cell-sphere complexes was similar to that described before for the HL60 cell-sphere complexes. We note that the effect of attaching a -diam silica microsphere to the stem cells has a larger effect on migration time than attaching the spheres to HL60 cells. The HL60 cells in a beam take to travel from ring 5 to the center. With a sphere attached this time is reduced to . An unlabeled stem cell has an average migration time of , and this is reduced to when a sphere is attached to the cell. We believe that attaching spheres to the cells made them less prone to sticking to the sample chamber, and this contributed to the decreased migration time. Another much less important factor may be the difference in size of the cell-sphere complex since stem cells are, in general, smaller that HL60 cells, the stem cell-sphere complex may travel faster than the HL60-sphere complex due to the resulting overall size of the cell-sphere complex. In summary, the separation of cell types (or particles) in our Bessel beam arrangement is possible if the difference in size is relatively large (erythrocytes and lymphocytes) or the difference in refractive index is large (polymer and silica microspheres). However, for cells where the difference in size or refractive index is not large enough (HL60 cell line or bone marrow containing many cell types including stem cells), one way to achieve optical separation in the Bessel beam is to label cells of interest with a particle that will change the size and refractive index of those cells—a silica microsphere label. This significantly decreases the migration times of the labeled cells in the Bessel beam pattern of circularly symmetric rings around a central maximum. We use the improved migration and guiding velocities of labeled cells in the Bessel beam to sort them from the unlabeled population in a simple chamber without any fluid flow. The attachment of the microspheres is also compatible with a microfluidic environment. It can be used with a small volume of analyte and, as can be seen in the next section, does not impair cell growth or function. 2.4.Cell Collection and ViabilityWe have detailed the movement of many cell types in the Bessel beam sorter and now go on to examine the properties of the cells collected from the Bessel beam. First, we report the recovery of early progenitor cells (stem cells) following Spin Sep separation (StemCell Technologies SARL, London, UK) and the fold concentration of the various cell populations in the enriched fraction. Cells are exposed to the continuous wave laser irradiation of the optical pattern for more than a few seconds, so there is a chance of laser-induced damage. Procedures to determine cell viability after sorting are also reported here. 2.4.1.Hematopoietic colony assaysThe cell yield following Spin Sep separation was . The fold concentration of the various cell populations was for the colony forming unit- granulacyte, macrophage (CFU-GM—committed progenitors to the granulocyte macrophage lineage); for the blast forming unit- erythroid (BFU-E—erythroid progenitors) plus colony forming unit- granulocyte, erythrocyte, macrophage, megakaryocyte (CFU-GEMM—multipotential stem cells) populations; and for the total progenitor population. 2.4.2.Cell collectionCells that traveled into the central maximum of the Bessel beam were collected using a pulled capillary (described in Sec. 3.2). The capillary was positioned nearby the beam central maximum. The easiest way to collect cells was by moving the sample stage (which moved the sample and the capillary together) as the cell was actively guiding, so that cells were captured by the capillary as they were guiding. The capillary was then gently removed and cells were flushed out, with fresh medium using a needle and syringe, into a culture plate. Cells subsequently grew, indicating that they were viable. An alternative was to attach the capillary to a microsyringe linked to a pump and to suck the cells from the beam central maximum into the capillary and use the pump in reverse to extrude the cells from the capillary into a collection chamber. 2.4.3.Viability of HL60 cellsThe viability of cells was tested using various assays: the trypan blue exclusion assay, in-vitro colony growth, growth in liquid medium, and Caspase 3 immunostaining. Figure 5 shows the trypan blue exclusion assay. Ten HL60 cells with microspheres attached were collected in a microcapillary as described earlier. Each cell was exposed to the Bessel beam for approximately each, as they were individually guided upward toward the capillary entrance and then maneuvred into the microcapillary by translating the microscope stage. The Bessel beam consisted of 20 rings (including the central core), therefore the central maximum and each ring was . A cell of diameter was exposed to the central maximum and the first ring of the Bessel beam as it was guided up toward the capillary entrance and then maneuvred into the capillary. The intensity of the beam in this region was calculated to be . The capillary was filled with 0.1% trypan blue in medium, and once all ten cells were collected, they were left in the presence of trypan blue for four minutes to allow any uptake. The cells were not permeable to the dye, thus confirming that the cell membranes remained intact and cells were viable after exposure to the Bessel beam and collection by microcapillary. Fig. 5Ten HL60 cells with silica spheres attached, collected in a pulled microcapillary filled with 0.1% trypan blue after Bessel beam sorting. As cell-sphere complexes are guided upward within the central core of the Bessel beam due to radiation pressure, the sample stage and capillary are moved together so that the cell sphere is collected in the capillary. The cells are exposed to the central core of the beam for , then left in the presence of trypan blue for four minutes to allow any uptake of the dye. After , the cells have not turned blue, indicating that the cell membrane has not been rendered permeable by laser irradiation or capillary collection. (Color online only.)  Cells collected in the microcapillary (this time without trypan blue present) were flushed out into fresh medium and grown both in liquid culture where the population proliferated and cloned in soft agar where colonies formed. This is described in Sec. 3.5.2, 3.5.3, respectively. Figures 6a, 6b, 6c show examples of colonies of HL60 cells after Bessel beam sorting three weeks after collection, and Fig. 6d shows the normal morphology of cytospun cells picked from a similar colony. Fig. 6Examples of cloned HL60 cells following collection from the Bessel beam cell sorter. (a) Unstained HL60 colony, three weeks after Bessel beam sorting (phase contrast image). Scale bar is . (b) Colony stained with vital dye (INT). Scale bar is . (c) Colony stained with Rapid Diff. Scale bar is . (d) Cytospin preparation of an HL60 colony stained with Rapid Diff to illustrate normal morphology of the cells. Scale bar is .  A further test was carried out for the detection of Caspase 3, a key enzyme in the apoptotic pathway, and is described in Sec. 3.5.4. Normal HL60 cells (negative control), sorted HL60 cells with spheres attached, and HL60 cells that had been treated with for three hours (positive control)24 were all immunostained to detect Caspase 3. Negative controls were taken straight from the culture flask before testing. Sorted cells were passed through the Bessel beam, collected in a microcapillary, extruded into a well, grown for two weeks in the well, and then transferred to a tissue culture flask for one further week, then tested. Positive controls were treated with in a culture flask then harvested after . The results can be seen in Fig. 7 . Normal cells [Fig. 7a] and the Bessel beam sorted cells [sample 1 in Fig. 7b and sample 2 in Fig. 7c] all show a small amount of background green fluorescence but no fluorescence of the fluorescein isothiocyanate (FITC) label, which would indicate apoptosis by highlighting the Caspase 3 in the cells. The blue stain is 4'-6-diamidino-2-phenylindole (DAPI), a nuclear counter stain. In contrast, some cells that were treated with [Fig. 7d] show strong green fluorescence, indicating that they are undergoing apoptosis. In addition to this, in the same cells the DAPI stain shows nuclear fragmentation instead of intact nuclei—another indication of apoptosis. Fig. 7Examples of HL60 cells immunostained for the presence of Caspase 3, a key enzyme in apoptosis. Caspase 3 is detected using a FITC conjugated antibody (green) and can only be seen in (d). Nuclei are stained blue with DAPI. (a) Normal HL60 negative control, (b) sample 1 of Bessel beam sorted and capillary collected cells, (c) sample 2 of Bessel beam sorted and capillary collected cells, and (d) positive control-HL60 cells exposed to . Only in the positive, treated control are green cells, hence apoptosis, observed. Scale bar is (color online only).  Table 2The location of erythrocyte alignment (or lock in) in the Bessel beam. Percentage of cells aligned and locked in to distinct regions of the Bessel beam (central core and rings) measured at three power levels and for two starting positions (rings 5 and 3).
In summary, trypan blue exclusion of sorted cells, growth of sorted cells in both liquid culture and in soft agar, and the negative results of the Caspase 3, assay lead us to believe that cells undergoing optical sorting in the Bessel beam and collection by microcapillary are viable, and they grow and replicate as normally functional HL60 cells. 3.Methods3.1.Bessel BeamThe Bessel beam can be considered a self-renewing interference pattern, which consists of a propagation invariant ('nondiffracting') profile and the central core that propagates for a distance much greater than the Raleigh range of a Gaussian beam of waist diameter equal to the radius of the Bessel beam central maximum. The central maximum is surrounded by a series of concentric rings of equal power. The size of the central maximum, ring size, and propagation distance can be tailored as desired.23 An approximation to a Bessel beam was used in this work to induce the movement of cell types and microspheres across the pattern of concentric rings toward the beam central core. Our separation of lymphocytes and erythrocytes was performed using a beam created by passing an expanded Gaussian beam from an laser operating at of power up to through a conically shaped optical element called an axicon.25 The beam was telescoped into a sample chamber from below to obtain a vertically oriented Bessel beam. The beam had a central core diameter of and a propagation distance of approximately . The beam consisted of 20 concentric rings of equal power around the central maximum. A Bessel beam with different parameters was used for all other experiments (microsphere migration, migration of unlabeled HL60 cells and bone marrow cells, and also of labeled cells in the final results section). The output from an Nd:YAG laser (of wavelength and a maximum power of ) was passed through an axicon and two lenses ( , ) to form a vertical Bessel beam of propagation distance . The diameter of the central core was and the ring thickness was , with spacing between concentric rings of one micron. Power is measured at the laser output. 3.2.Microcapillaries and Sample ChambersBorosilicate glass capillaries (Harvard Apparatus Limited, Kent, United Kingdom) were pulled to an outer diameter of approximately , and inner diameter of about using a Narishige microelectrode puller (Intracel, Herts, United Kingdom). These drawn capillaries were used in combination with sample chambers to collect the cells that were trapped in the Bessel beam central core and subsequently guided up into the capillary. Sample chambers consisted of a type-one thickness coverslip of dimensions , coated in Sigmacoat (Sigma-Aldridge, Dorset, UK) to prevent cells sticking to the glass, a vinyl spacer of thickness , and a second coverslip of dimensions on top. The microcapillaries were filled with culture medium and easily inserted into the sample chambers via a groove cut into the vinyl spacer. They were either sealed at the end with jewelers putty or linked to a microsyringe (Hamilton, Reno, NV, USA) and pump (Picoplus, Harvard Apparatus, Holliston, MA, USA). 3.3.Cell PreparationThe following section describes the preparation of various cell populations for use in the Bessel beam cell sorter. Erythrocytes and lymphocytes, HL60 cells, murine bone marrow and early progenitor cells, and the attachment of spheres to some of these cell types, are detailed. 3.3.1.Erythrocytes and lymphocytesof venous blood was collected in a heparinized tube. The anticoagulated blood was layered onto an equal volume of Histopaque-1077 (Sigma-Aldrich) and centrifuged at at room temperature for . Erythrocytes and granulocytes in the sample aggregated and were sedimented, whereas lymphocytes and other mononuclear cells remained at the plasma-Histopaque-1077 interface. The upper plasma layer was removed by aspiration with a Pasteur pipette and discarded. The interface layer containing the mononuclear cells was transferred to a clean tube. of RPMI 1640 medium, supplemented with 10% fetal calf serum (FCS), penicillin , streptomycin , and glutamine (P/S/G), was added, and the sample was centrifuged at at room temperature for . The supernatant was aspirated and discarded; the pellet of cells was resuspended and washed again in RPMI 1640 medium (plus 10%FCS and P/S/G). The supernatant was discarded and the cells resuspended in medium at a concentration of . of pelleted erythrocytes was taken from the Histopaque sample, washed twice in RPMI 1640 medium (plus FCS and P/S/G), and was resuspended in medium such that the final concentration of erythrocytes was . For cell sorting experiments, of lymphocytes (approximately cells) and of erythrocytes (again, approximately cells) were mixed together in a sample chamber and exposed to the Bessel beam. 3.3.2.HL60 cell lineThe HL60 promyelocytic cell line was maintained in RPMI 1640 medium supplemented with 10% FCS and P/S/G. For Bessel beam sorting experiments, cells were used at a concentration of approximately . 3.3.3.Labeling HL60 cells with antibody-coated beadsof diam, streptavidin-coated microspheres (1% solid) (Bangs Laboratories, Inc.) were washed by centrifugation three times, the first two washes in PBS and the final wash in 3% BSA (bovine serum albumin)/PBS, for each time at . The pellet of spheres was resuspended in 3% BSA/PBS and added to CD33 biotinylated monoclonal antibody (Abcam, Cambridge, UK) to a final concentration of 1:1000. (CD33, a cell surface glycoprotein, is found on granulocyte and macrophage precursors and is present on the surface of HL60 cells, a human promyelocytic leukemia cell line). After incubation for at room temperature with gentle mixing, the sphere-antibody complex was washed by centrifugation three times at for . The second wash with phosphate buffered saline (PBS) and the third wash with 3% BSA/PBS. The pellet was resuspended in 3% BSA/PBS to a concentration of approximately . HL60 cells were washed by centrifugation for at , and of sphere-CD33 antibody complex in 3% BSA/PBS (approximately ) was added to the cell pellet. After incubation for at room temperature with gentle mixing, cell-sphere complexes were washed twice in RPMI 1640 medium supplemented with 10% FCS and finally resuspended in to use with the Bessel beam. Spheres were not removed from the cells after sorting, and it is shown in Sec. 3.5 that cells proliferated in both liquid culture and in soft agar as normal. 3.3.4.Bone marrow (hematopoietic) cells and hematopoietic early progenitor/stem cellsCell suspensions were prepared from the femoral bone marrow of C57BL/6 female mice. The femoral marrow was removed by flushing the medullary cavity with RPMI 1640 supplemented with 2% FCS. Following production of a single cell suspension by gently pipetting the cells, the bone marrow suspension was enriched for the stem and progenitor fraction using Spin Sep (StemCell Technologies Incorporated). 3.3.5.Spin sep hematopoieticc ell enrichment procedureMurine bone marrow cells were centrifuged for at and resuspended to a concentration of approximately in RPMI 1640 medium, supplemented with 2% FCS. The sample was enriched for mouse early progenitors (the fraction that includes stem cells) using the Spin Sep enrichment procedure. of monoclonal antibody cocktail was added to the suspension, targeting unwanted cells for depletion. The sample was incubated on ice for then washed by centrifugation with RPMI 1640 plus 2% FCS for at . The cell pellet was resuspended in medium, of Spin Sep dense particles were added, then the sample was incubated on ice for and occasionally mixed. After incubation, of RPMI 1640 medium plus 2% FCS was added to the sample, mixed, and then layered on top of Spin Sep density medium. This was centrifuged for at with the brake off until the dense, unwanted cells formed a pellet and the enriched cells were found on the Spin Sep density medium: RPMI FCS interface. Enriched progenitors were removed by pipetting from the interface and washed by centrifugation in medium for at . 3.3.6.Labeling hematopoietic stem/progenitor cells with antibody-coated bBeadsAfter separation of hematopoietic progenitors from murine bone marrow, using the Spin Sep kit (Sec. 3.3.5) and then washing, enriched cells were resuspended in RPMI FCS. Cells were washed by centrifugation at for to create a pellet. Sca1 primary antibody (Abcam, United Kingdom) was resuspended in 3% BSA/PBS to a final concentration of 1:1000), and then added to the pellet of enriched cells and incubated for with gentle mixing at room temperature. The streptavidin-coated microspheres were brought to room temperature, vortexed for then (of stock containing 1% solid) was washed twice in PBS, and then in 3% BSA/PBS for at to create a pellet of spheres. A secondary antibody, Rat IgG H and L (biotin) (Abcam, United Kingdom) in 3% BSA/PBS at a concentration of 1:1000, was added to the pellet of spheres and incubated for with gentle mixing. The cell-Sca1 antibody complex was washed twice in PBS, then in 3% BSA/PBS at for . The streptavidin sphere-biotinylated secondary antibody was washed twice in PBS, then in 3% BSA/PBS at for . This was resuspended in 3% BSA/PBS, added to the pellet of cell-Sca1 antibody complex, and incubated for with gentle mixing. Cell-sphere complexes were washed twice by centrifugation in RPMI FCS and P/S/G at for , and finally resuspended in RPMI FCS and P/S/G. 3.4.Hematopoietic Colony AssaysColony assays of murine bone marrow cells and the enriched fraction of early progenitors/stem cells were used to determine the number of constituent cell types within the samples. 3.4.1.GM-CFC assayAll GM-CFC assays were performed in cultures in Lux petri dishes supplemented with of L929 conditioned medium as a source of growth factors. of bone marrow cells at an appropriate cell concentration (approximately cells per dish before separation) was added to of Dulbecco’s modified eagle medium (DMEM) supplemented with 20% horse serum (HS) and penicillin , streptomycin , and glutamine followed by of melted 0.3% Bacto agar. Following mixing, was plated into the dish and allowed to gel. The plates were incubated at in 10% and an air-humidified atmosphere for before counting colonies. 3.4.2.CFU-GEMM and BFU-E assaysAssays for CFU-GEMM and BFU-E were carried out according to the manufacturer’s instructions (Stem Cell Technologies, Vancouver, Canada). Appropriate numbers of bone marrow cells (approximately cells per dish before separation and cells per dish after separation) were added to Methocult medium (M3434) and transferred to each culture dish. After incubation at in 5% and an air-humidified atmosphere, the dishes were scored for CFU-GEMM, BFU-E, and total colony numbers. 3.5.Viability AssaysA number of tests were performed to check that sorted cells that had been exposed to Bessel beam irradiation and collected then extruded from a microcapillary were viable. Trypan blue exclusion shows that the cell membrane is intact, therefore cells are not undergoing necrosis, whereas if cells turned blue it would indicate that the normally membrane-impermeable dye is getting into the cell through the ruptured membrane. Expansion of cell numbers in liquid culture and the formation of colonies in soft agar are both evidence of the cells’ ability to grow and proliferate as normal. Immunostaining for cleaved Caspase 3 showed if cells were undergoing apoptosis as a result of laser irradiation of collection in a microcapillary. 3.5.1.Trypan blue exclusion assayThe microcapillary used for collection of sorted cells is filled with 0.1% trypan blue in medium. Cells are maneuvred into the capillary as they are guiding in the Bessel beam central core by moving the translation stage on which the sample sits. The capillary is moved horizontally into the vertical path of the guiding cell, thus capturing the cell. This is repeated about ten times so that cells can be monitored in real time for any trypan blue uptake of sorted cells. 3.5.2.Cell growth in liquid cultureSorted and collected cells were extruded from a microcapillary using a micropump into of fresh media (RPMI 1640 supplemented with 10% FCS and PSG) in a 96 well plate. Cells were grown at in 10% and air humidified atmosphere for , and then transferred to a T25 tissue culture flask containing fresh media, where the population proliferated normally for another three weeks. 3.5.3.Soft agar coloniesHL60 cells with microspheres attached, which were sorted and collected, were extruded from a microcapillary using a micropump into of fresh media (RPMI 1640 supplemented with 10% FCS and PSG) in a 96 well plate. Cells were grown at in 10% and an air-humidified atmosphere overnight, and then used in a soft agar colony assay. 0.5% agar was made by dissolving 5% molten agar in medium. This was transferred into a petri dish and left for at room temperature to set, then 0.3% agar containing cells was layered on top. 0.3% agar containing the sorted cells was prepared by dissolving 3% molten agar in medium, then adding the sample of cells that had grown in the well overnight. The 0.3% molten agar medium mixture containing cells was added in a drop-wise manner onto the layer of 0.5% agar, which had been left at room temperature for to set. Dishes are left for until colonies appear. 3.5.4.Apoptosis detection: Caspase 3 immunofluorescenceActivation of Caspase 3, a key initiator in apoptosis, was tested for in the sorted HL60 cells using immunofluorescence. The detection of Caspase 3 would show that the sorted cells were undergoing programmed cell death. As a negative control we used normal HL60 cells straight from the incubator (neither exposed to the Bessel beam nor collected by microcapillary), and as a positive control for apoptosis we treated HL60 cells with for .25 Cells collected after Bessel beam sorting were grown in media in a 96 well plate for and then transferred to a T25 tissue culture flask, and then grown for another to bulk up the number of cells. Cells were cytospun for five minutes at onto microscope slides, resulting in the cells occupying a circular area of diam. Cells were fixed by dipping the slides into 4% formaldehyde for at room temperature then left to air dry. Using a wax pen, a well was made around the fixed cells in which of liquid could be added for immunofluorescence. Cells were blocked in 5% donkey serum (Sigma) (in PBS/0.3%Triton-X100) for at room temperature. This was aspirated and the polyclonal cleaved Caspase-3 antibody (Cell Signalling) was added at a 1:100 dilution (in PBS/Triton) and left overnight at . After incubation with a primary antibody, cells were rinsed three times with PBS for each time, and the secondary antibody-FITC-conjugated donkey antirabbit (Jackson ImmunoReseach Laboratories) also in PBS/Triton was added at a 1:100 dilution and incubated for at room temperature in the dark. Cells were washed three times in PBS for each time, then mounted with Vectasheild mounting medium containing DAPI counterstain and a coverslip placed on top, then sealed. Slides were examined using a Zeiss Axioscope microscope using the DAPI and FITC filters. 4.DiscussionThe ’nondiffracting’ light beam pattern of a Bessel beam, consisting of circularly symmetric rings around a bright central maximum, was used as a passive optical cell sorter in a flow-free environment. Multiple cell types were investigated in this study to determine if unlabeled “native” cells could be sorted due to differences in their intrinsic optical properties alone. We explored the all-optical sorting potential of the Bessel beam initially by using microspheres of varying size and refractive index. Changing the size of particles did not significantly transform their migration time in the beam (unless sphere size was matched to ring size, thus trapping the sphere away from the center), but increasing refractive index of the microsphere reduced the time of migration from ring 5 to the central core significantly. To determine the limits of the Bessel beam for sorting cells in their native, unlabeled state, we performed experiments on three distinct cell populations; blood cells (containing two populations—erythrocytes and lymphocytes), the HL60 cell line (one cell type), and bone marrow cells (consisting of many types, including the precious hematopoietic stem cells or early progenitors). It was found that: 1. the Bessel beam could separate erythrocytes and lymphocytes due to their large difference in size; 2. HL60 cells, which varied in size from , could not be separated by size; and 3. different cell types in the bone marrow, thought to have different refractive indices due to such different functionality, could not be separated in the Bessel beam. It is unlikely that many cell types of interest to biologists and clinicians will have a significant difference in size or refractive index, which can be used for passive optical sorting. To utilize the Bessel beam pattern as a passive, flow-free, optical, cell sorter (to sort the stem cells from bone marrow, and other cell types that do not have large size differences like erythrocytes and lymphocytes, or as different in refractive index as silica and polymer microspheres), we must label our cells of interest. Labeling cells with microspheres, in a marker-specific manner, results in our cells of interest having an altered overall size and refractive index. This leads to a significant reduction in the migration time of the cell-sphere complex in the beam compared to unlabeled cells in their native state, thus cell separation. We have additionally shown how the sorting, collection, then recovery of HL60 cells that spheres attached results in cells which function and grow normally. There are many advantages of using the gradient force of light within an optical pattern to sort cells. The Bessel beam relies on no fluid flow and the sample chamber used in conjunction with the Bessel beam is a very simple design. No microfluidic pumps are required, and there is no hydrodynamic focusing of the cells as is present in fluorescently activated cell sorting (FACS), which results in less mechanical stress on the cells caused by fluidic shear. In contrast to traditional cell sorting methods, microliter volumes and low cell numbers are used in the Bessel beam sorting technique, which is useful if one is using clinical samples or precious cell lines that cannot be easily expanded into large populations. Only a few cells are sufficient for many downstream applications such as in-vitro cloning or polymerase chain reaction (PCR). Imaging modalities in microscopes are already well established and the ability to engineer a Bessel beam, or indeed any 2-D optical pattern, into a microscope may lead to a new generation of workstations providing multifunctionality (imaging and cell sorting) in a single microscope. Coupling Bessel beam sorting with Raman spectroscopy26 or fluorescence for multiparameter analysis of a sorted cell sample is also feasible in such a workstation. A probe, such as a Raman beam or fluorescence excitation beam, or a beam for cell photoporation,27 can be sent through the imaging microscope objective and used for further analysis or treatment of cells undergoing passive sorting in the Bessel beam. We have shown in this study of multiple cell types that only certain cell types can be sorted in the Bessel beam pattern without prior labeling. Erythrocytes and lymphocytes are separated according to their difference in size. Many other interesting and important cell types do not intrinsically have large enough differences in either size or refractive index to undergo passive sorting in the pattern. Cell types of interest can be labeled with silica spheres to increase the overall refractive index of the cell and decrease the migration time of cell-sphere complexes in the Bessel beam pattern compared to unlabeled cells. This difference in response to optical forces between cells labeled with microspheres and cells in their native, unlabeled state is exploited in this work to achieve noncontact, flow-free, passive sorting within the simple optical pattern of a Bessel beam. AcknowledgmentsPaterson, Papagiakoumou, Dholakia, and Riches contributed equally to the work presented. This work was supported by a Strategic Research Development Grant (SRDG) from the Scottish Higher Education Funding Council (SHEFC), a Medical Research Council (MRC) Discipline Hopping award, and the UK Engineering and Physical Sciences Research Council (EPSRC). This work is also supported as part of the project, "ATOM3D," funded by the EU-FP6-NEST program. The authors wish to thank E. Brown, and P. E. Bryant for useful comments, and the Herrington group for the gift of the Caspase 3 antibody. ReferencesO. Ovik,
T. Popovic,
E. Skerve,
K. S. Cudjoe,
E. Hornes,
J. Ugelstad, and
M. Uhlen,
“Magnetic separation techniques in diagnostic microbiology,”
Clin. Microbiol. Rev., 7 43
(1994). 0893-8512 Google Scholar
W. A. Bonner,
H. R. Hulett,
R. G. Sweet, and
L. A. Herzenberg,
“Fluorescence activated cell sorting,”
Rev. Sci. Instrum., 43 404
–409
(1972). https://doi.org/10.1063/1.1685647 0034-6748 Google Scholar
M. P. MacDonald,
G. C. Spalding, and
K. Dholakia,
“Microfluidic sorting in an optical lattice,”
Nature (London), 426 421
–424
(2003). https://doi.org/10.1038/nature02144 0028-0836 Google Scholar
L. Paterson,
E. Papagiakoumou,
G. Milne,
V. Garcés-Chávez,
S. A. Tatarkova,
W. Sibbett,
F. J. Gunn Moore,
P. E. Bryant,
A. C. Riches, and
K. Dholakia,
“Light-induced cell separation in a tailored optical landscape,”
Appl. Phys. Lett., 87 123901
(2005). https://doi.org/10.1063/1.2045548 0003-6951 Google Scholar
A. H. Forster,
M. M. Wang,
W. F. Butler,
M. Chachisvilis,
T. D. Y. Chung,
S. C. Esener,
J. M. Hall,
O. Kibar,
K. Lykstad,
P. J. Marchand,
E. M. Mercer,
L. M. Pestana,
S. Sur,
E. Tu,
R. Yang,
H. Zhang, and
I. Kariv,
“Use of optical gradient fields for analysis of apoptotic cellular responses in a chronic myeloid leukaemia cell model,”
Anal. Biochem., 327 14
–22
(2004). https://doi.org/10.1016/j.ab.2003.12.017 0003-2697 Google Scholar
B. Shao,
S. C. Esener,
J. M. Nascimento,
M. W. Berns,
E. L. Botvinick, and
M. Ozkan,
“Size tunable three-dimensional annular laser trap based on axicons,”
Opt. Lett., 31 3375
–3377
(2006). https://doi.org/10.1364/OL.31.003375 0146-9592 Google Scholar
G. Milne,
D. Rhodes,
M. MacDonald, and
K. Dholakia,
“Fractionation of polydisperse colloid with acousto-optically generated potential energy landscapes,”
Opt. Lett., 32 1144
–1146
(2007). https://doi.org/10.1364/OL.32.001144 0146-9592 Google Scholar
A. B. Fuchs,
A. Romani,
D. Freida,
G. Medoro,
M. Abonnenc,
L. Altomare,
I. Chartier,
D. Guergour,
C. Villiers,
P. N. Marche,
M. Tartagni,
R. Guerrieri,
F. Chatelain, and
N. Manaresi,
“Electronic sorting and recovery of single live cells from microlitre sized samples,”
Lab Chip, 6 121
–126
(2006). https://doi.org/10.1039/b505884h 1473-0197 Google Scholar
X. Hu,
P. H. Bessette,
J. Qian,
C. D. Meinhart,
P. S. Daugherty, and
H. T. Soh,
“Marker-specific sorting of rare cells using dielectrophoresis,”
Proc. Natl. Acad. Sci. U.S.A., 102 15757
–15761
(2005). https://doi.org/10.1073/pnas.0507719102 0027-8424 Google Scholar
P. Y. Chiou,
A. T. Ohta, and
M. C. Wu,
“Massively parallel manipulation of single cells and microparticles using optical images,”
Nature (London), 436 370
–372
(2005). https://doi.org/10.1038/nature03831 0028-0836 Google Scholar
J. P. Rodriguez,
M. Gonzalez,
S. Rios, and
V. Cambiazo,
“Cytoskeletal organization of human mesenchymal stem cells (MSC) changes during their osteogenic differentiation,”
J. Cell. Biochem., 93 721
–731
(2004). 0730-2312 Google Scholar
C. H. Thomas,
J. H. Collier,
C. S. Sfeir, and
K. E. Healy,
“Engineering gene expression and protein synthesis by modulation of nuclear shape,”
Proc. Natl. Acad. Sci. U.S.A., 99 1972
–1977
(2002). https://doi.org/10.1073/pnas.032668799 0027-8424 Google Scholar
R. McBeath,
D. M. Pirone,
C. M. Nelson,
K. Bhadriraju, and
C. S. Chen,
“Cell shape, cytoskeletal tension, and RhoA regulate stem cell lineage commitment,”
Dev. Cell, 6 483
–495
(2004). https://doi.org/10.1016/S1534-5807(04)00075-9 1534-5807 Google Scholar
G. Milne,
K. Dholakia,
D. McGloin,
K. Volke-Sepulveda, and
P. Zemanek,
“Transverse particle dynamics in a Bessel beam,”
Opt. Express,
(2007)
(1094-4087) Google Scholar
S. Sato,
M. Ishigure, and
H. Inaba,
“Optical trapping and rotational manipulation of microscopic particles and biological cells using higher-order mode Nd:YAG laser beams,”
Electron. Lett., 27 1831
–1832
(1991). https://doi.org/10.1049/el:19911138 0013-5194 Google Scholar
S. B. Bushuk,
J. V. Kruchenok,
G. I. Kurilo,
N. A. Nemkovich, and
A. N. Rubinov,
“Orientation of erythrocytes in the fringes of an interference laser field,”
J. Opt. A, Pure Appl. Opt., 7 382
–385
(2005). https://doi.org/10.1088/1464-4258/7/8/005 1464-4258 Google Scholar
S. K. Mohanty,
K. S. Mohanty, and
P. K. Gupta,
“Dynamics of Interaction of RBC with optical tweezers,”
Opt. Express, 13 4745
–4751
(2005). https://doi.org/10.1364/OPEX.13.004745 1094-4087 Google Scholar
S. C. Grover,
R. C. Gauthier, and
A. G. Skirtach,
“Analysis of the behaviour of erythrocytes in an optical trapping system,”
Opt. Express, 7 533
(2000). 1094-4087 Google Scholar
J. A. Dharmadhikari and
D. Mathur,
“An optical trap to fold and align single red blood cells,”
Curr. Sci., 86 1432
–1437
(2004). 0011-3891 Google Scholar
J. A. Dharmadhikari,
S. Roy,
A. K. Dharmadhikari,
S. Sharma, and
D. Mathur,
“Torque-generating malaria-infected red blood cells in an optical trap,”
Opt. Express, 12 1179
–1184
(2004). https://doi.org/10.1364/OPEX.12.001179 1094-4087 Google Scholar
S. K. Mohanty,
A. Uppal, and
P. K. Gupta,
“Self-rotation of red blood cells in optical tweezers: prospects for high throughput malaria diagnosis,”
Biotechnol. Lett., 26 971
–974
(2004). https://doi.org/10.1023/B:BILE.0000030041.94322.71 0141-5492 Google Scholar
J. A. Dharmadhikari,
S. Roy,
A. K. Dharmadhikari,
S. Sharma, and
D. Mathura,
“Naturally occurring, optically driven, cellular rotor,”
Appl. Phys. Lett., 85 6048
–6050
(2004). https://doi.org/10.1063/1.1836874 0003-6951 Google Scholar
D. McGloin and
K. Dholakia,
“Bessel beams: diffraction in a new light,”
Contemp. Phys., 46 15
–28
(2005). https://doi.org/10.1080/0010751042000275259 0010-7514 Google Scholar
A. M. DiPietrantonio,
T. Hsieh, and
J. M. Wu,
“Activation of Caspase 3 in HL60 cells exposed to hydrogen peroxide,”
Biochem. Biophys. Res. Commun., 255 477
–482
(1999). https://doi.org/10.1006/bbrc.1999.0208 0006-291X Google Scholar
J. Arlt,
V. Garcés-Chávez,
W. Sibbett, and
K. Dholakia,
“Optical micromanipulation using a Bessel light beam,”
Opt. Commun., 197 239
–245
(2001). https://doi.org/10.1016/S0030-4018(01)01479-1 0030-4018 Google Scholar
P. R. T. Jess,
V. Garcés-Chávez,
D. Smith,
M. Mazilu,
L. Paterson,
A. C. Riches,
C. S. Herrington,
W. Sibbett, and
K. Dholakia,
“A dual beam fibre trap for Raman micro-spectroscopy of single cells,”
Opt. Express, 14 5779
–5791
(2006). https://doi.org/10.1364/OE.14.005779 1094-4087 Google Scholar
D. Stevenson,
B. Agate,
X. Tsampoula,
P. Fischer,
C. T. A. Brown,
W. Sibbett,
A. Riches,
F. Gunn-Moore, and
K. Dholakia,
“Femtosecond optical transfection of cells: viability and efficiency,”
Opt. Express, 14 7125
–7133
(2006). https://doi.org/10.1364/OE.14.007125 1094-4087 Google Scholar
|
|||||||||||||||||||||||||||||||||||||||||||||||||||||||||||


