
|
|
1.IntroductionIn vivo bioluminescence imaging (BLI) is a widely used method for noninvasive measurement of luciferase expression in small research animals. For example, it has been employed to study tumor metastasis, evaluate novel antibiotics, and detect protein-protein interactions.1 BLI exploits the emission of photons based on energy-dependent reactions catalyzed by luciferases during degradation of substrates such as luciferin. The photons can be detected by highly sensitive imaging systems based on cooled charge-couple device (CCD) cameras. The sensitivity of detection is dependent on several factors, including the photon yield of the enzymatic reaction, absorption and scattering of the light by mammalian tissues,2 and the sensitivity of the detection system. In vivo, the most important limitation is caused by absorption and scattering of light, which reduce sensitivity and resolution. Whereas scattering is mainly dependent on the tissue composition, absorption depends on the light emission spectrum. In tissues, chromophores like hemoglobin will absorb light. Hemoglobin absorbs mainly in the green and blue part of the light spectrum, whereas less absorption occurs at wavelengths longer than . Thus, the red component of the luciferase emission spectra is the most useful one for imaging. Several luciferases have been cloned and optimized for expression in mammalian cells.1 Luciferase from the North American firefly (Photinus pyralis, Fluc) is the most commonly used for BLI. Light emission includes a spectral content above within a broadband emission spectrum (530 to ) peaking at at 37°C.3 Recently, green (CBGr68, CBGr99) and red (CBRed) luciferases from yellow click beetles (Pyrophorus plagiophthalamus) have been introduced. CBRed displays a spectral peak at at , whereas CBGr99 and CBGr68 exhibit the same emission spectrum peaking at according to the manufacturer’s specifications (Promega, Mannheim, Germany). A comparative study of spectral imaging for Fluc, CBRed, and CBGr68 has shown that the percentage of light output above was low for CBGr68 but higher for CBRed and Fluc (75 to 80% and 64%, respectively).3 These observations appear to suggest that CBRed and Fluc are better candidates for BLI than CBGr68. However, a quantitative comparison of the total photons emitted at the various wavelengths of the spectra, especially in the red wavelength range, has not been performed. Such measurements are required together with in vivo BLI studies for a comparative assessment of the various luciferases for BLI, which are the aim of the present study. For a comparative analysis, it is critical to utilize cells expressing equimolar amounts of the different luciferase proteins. Stoichiometric coexpression of a fluorescent protein with a luciferase would be ideal for standardization of luciferase expression. Coexpression can be achieved by different strategies, e.g., the use of multiple promoters, fusion proteins, or internal ribosome entry sites (IRES). However, the use of multiple promoters does not guarantee stoichiometric expression. Fusion proteins may result in protein misfolding or mistargeting, and expression of genes separated by an IRES sequence under the control of a common promoter is problematic, because multiple proteins are often not expressed at the same level.4 A recent strategy for the generation of multicistronic vectors and resulting stoichiometric coexpression of proteins involves the use of “self-cleaving” 2A sequences from viruses.5 This system achieves the transcription of two proteins by the 2A consensus motif (2A, Asp-Val/Ile-Gluc-X-Asn-Pro-Gly; 2B, Pro). Through a ribosomal skip mechanism, the 2A peptide prevents formation of peptide bonds between the 2A Gly and the 2B Pro without affecting the translation of the 2B. As a consequence, both proteins are stoichiometrically expressed [Fig. 1a ]. Using the 2A system for coexpression of luciferases with eGFP, we have generated cell lines expressing equimolar amounts of luciferases, and demonstrate here that CBGr99 luciferase is an excellent candidate for BLI studies. Fig. 12A cleavage. (a) Schematic representation of the eGFP-2A-Luc constructs and the resulting proteins obtained after cleavage. (b) eGFP expression analysis by flow cytometry of the stable transfectants expressing eGFP-2A-CBGr99, eGFP-2A-CBRed, or eGFP-2A-Fluc. (c) Western blot with an anti-GFP antibody of transiently transfected cells, lanes 1, 2, and 3 are noncleavable constructs containing Fluc (lane 1), CBGr99 (lane 2), and CBRed (lane 3). Lanes 4, 5, and 6 are cleaved eGFP band of transient transfectants expressing 2A linked constructs containing Fluc (lane 4), CBGr99 (lane 5), and CBRed (lane 6). Lane 7 is native eGFP, and lane 8 is untransfected cells. (d) Western blot for cleaved eGFP of the stable transfectants. Lane 1: eGFP-2A-Fluc; lane 2: eGFP-2A-CBGr99; lane 3: eGFP-2A-CBRed; and lane 4: transient transfection with pEGFP-N3 plasmid. 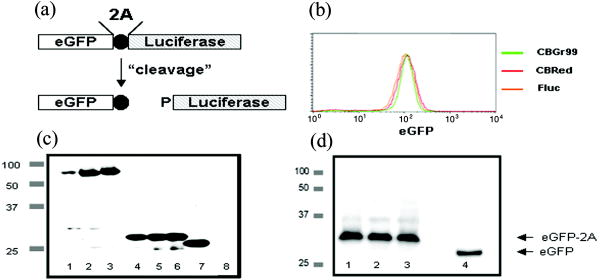 2.Materials and MethodsAnimals. C57BL/6 mice were purchased from Charles River Wiga (Sulzfeld, Germany). Animal experiments were performed following institutional regulations. Cell lines and cell culture. MO4 is an ovalbumin transfectant of B16 melanoma. Cells were cultured in Dolbeccos modified eagle medium (DMEM) containing 10% Fetal calf serum (FCS) and 1% glutamine. Transfections were performed with Lipofectamine 2000 (Invitrogen, Karlsruhe, Germany). Stable clones were isolated by cell sorting (FACSDiva; Becton Dickinson, Heidelberg, Germany) on the basis of their eGFP expression. Construction of plasmids. eGFP-2A-CBGr99, eGFP-2A-CBRed, and eGFP-2A-Fluc cDNAs were generated by recombinant polymerase chain reaction (PCR) as described5 using pEGFP-N3 (Clontech, Mannheim, Germany), pCBG99-basic, pCBR-basic, and pGL3 plasmids (Promega, Mannheim, Germany) as templates. The recombinant PCR products were cloned under the control of a CMV promoter (human cytomegalovirus early promoter) by classical molecular biology techniques. Western blot analysis. Western blotting was performed as described6 using an antibody specific for GFP (Roche Applied Science, Mannheim, Germany). Protein bands were detected by enhanced chemiluminescence. In vitro imaging. transfectants were plated in black 96-well plates , Roskilde, Denmark) in phosphate buffered saline (PBS). After addition of of D-luciferin ( ; Synchem, Felsberg, Germany), pictures were taken with the imaging system 100 (Xenogen Corporation, Alameda, USA) using the sequential mode (45 picture, acquisition time of , and the indicated filter). For comparison with in vivo BLI, all in vitro measurements were done at . Analysis was performed using the LivingImage software (version 2.50, Xenogen Corporation, Alameda, USA). Light output from specified regions of interest (ROI) was quantified as relative light units (RLU). In vivo imaging. Stable transfectants were injected into mice and BLI was performed following published procedures.1 Mice were imaged immediately after injection of 150-mg D-luciferin per kg of body weight. 3.Results and Discussion3.1.2A Peptide Cleavage for Equimolar Expression of eGFP and LuciferasesIt has been demonstrated that 2A peptides can be used for stoichiometric coexpression of proteins.5, 7 For quantitative comparison of different luciferases for BLI, bicistronic plasmids were constructed in which CBGr99, CBRed, and Fluc was linked to the eGFP sequence via a P2A sequence [Fig. 1a]. These plasmids were transfected into MO4 melanoma cells, and stable cell clones were selected displaying identical eGFP expression [Fig. 1b], which therefore expressed stoichiometric amounts of the luciferase proteins. For verification of correct cleavage, MO4 cells were also transiently transfected with constructs in which eGFP and luciferases were linked by a noncleavable peptide. Western blots performed with an anti-eGFP antibody show that the linked eGFP-luciferase proteins display the expected molecular weight of about [Fig. 1c, lanes 1, 2, and 3]. In contrast, for each 2A linked construct, complete cleavage was observed, with the cleaved eGFP-2A protein migrating slightly higher than the native eGFP [lanes 4 through 7]. In the stable transfectants also, complete cleavage was found with comparable intensity of the eGFP bands [Fig. 1d], which is in agreement with the identical fluorescence intensities shown in [Fig. 1b]. Because antibodies against click beetle luciferases are not available and antibodies against Fluc are not useful for Western blotting, in our hands we could not demonstrate the cleaved luciferases. We conclude from the quantitative cleavage of the 2A constructs that identical amounts of the luciferases are expressed, which is in accordance with the published stoichiometric coexpression in the bicistronic 2A system.5, 7 Indeed, in a series of transfectants expressing increasing amounts of eGFP, a strict correlation with the activity of the respective luciferase was observed (data not shown). 3.2.Luciferase Comparison In VitroFor comparison of light emission, the MO4 cell lines expressing equimolar amounts of the different luciferases were imaged. Although the luciferases utilize the same substrate, D-luciferin, the kinetics of the enzymatic activities may differ. Therefore, imaging of the cells was performed every minute after luciferin addition. Figure 2a shows that the kinetics and maximum photon yield are indeed different. CBGr99 clearly displayed the highest photon yield. Its enzymatic activity peaked at about after addition of D-luciferin, whereas for CBRed a maximum was reached at about and for FLuc after about . The photons emitted in the red part of the emission spectrum (above ) are critical for in vivo BLI, as they are less absorbed by mammalian tissues. Therefore, we measured the red-orange component using a DsRed2-1 filter (passband 575 to ). Figure 2b shows that CBGr99 emits more orange-red light photons than CBRed during the first , but CBRed reaches the same maximum after about . Fluc clearly emits fewer red photons. 3.3.Luciferase Comparison in VivoNext, we tested the luciferases in vivo by comparing the transfected MO4 tumor cells located in different tissues of mice, namely subcutaneous, in the peritoneal cavity, or in a highly vascularized organ such as the lung. First, 30,000 cells of each transfectant were injected into the same mouse at different subcutaneous sites, where light absorption by hemoglobin can be expected to be low. Figure 3a shows that at subcutaneous locations, the signal intensity from the CBGr99 luciferase is much higher than that of CBRed and Fluc. In the peritoneum, the presence of organs like the gut and the kidneys is expected to cause light absorption, particularly in the green range. Indeed, the total photon yields from CBGr99 and CBRed were now comparable, but CBGr99 reached the maximum faster than CBRed [Fig. 3b]. This kinetic aspect is in agreement with the in vitro data [see Fig. 1c] and requires following for in vivo BLI. For Fluc, the photon yield was significantly lower than that of the click beetle luciferases at all time points. Tumor cells injected intravenously will be sequestrated mainly in the capillaries of the lung tissues. Later, they will also appear in the liver. Thus, photons need to traverse through highly vascularized and hemoglobin-rich tissue. In agreement with this, the total light emission for all luciferases was about ten times reduced, compared to the peritoneal model [Fig. 3c]. No difference was observed between CBGr99 and CBRed with regard to maximum photon yield, although the kinetics of the former was faster. Fig. 3Comparison of luciferases in vivo. Mice were injected with stable transfectants expressing eGFP-2A-CBGr99, eGFP-2A-CBRed, or eGFP-2A-Fluc, respectively, and imaged at different times after D-luciferin injection. Representative animals are shown. The signal intensities from five mice in the subcutaneous model and three mice per group in the other models were averaged and plotted relative to the time after luciferin injection. (a) Subcutaneous model. BLI signal of 30,000 cells s.c. (b) Intraperitoneal model. BLI signal of cells injected i.p. (c) Lung model. BLI signal of cells injected i.v. 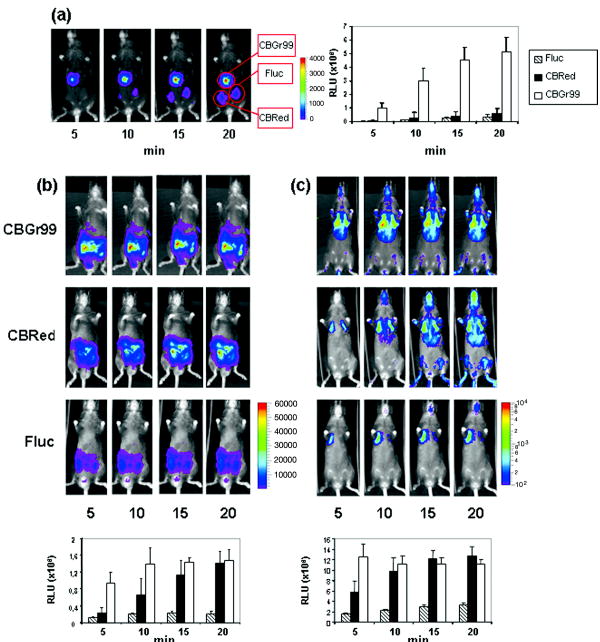 Our results demonstrate that for BLI, the click beetle luciferases are superior over Fluc, which is the most frequently used for BLI. The comparison of the CBLucs shows that CBGr99 has either a superior or a similar sensitivity in vivo as compared to CBRed, depending on the time point of the analysis. Despite the high attenuation of its signal in vivo, but owing to its high total photon yield, the CBGr99 luciferase still produces red photons in amounts that are comparable to CBRed. These properties characterize CBGr99 as a luciferase that is highly suitable for BLI. AcknowledgmentsWe thank Dario Vignali for support with the 2A system and Günter Küblbeck for valuable discussions. This work has been supported by grants from EU-Projects NOE-MUGEN (LSHG-CT-2005-005203), Cancer Immuno Therapy (LSH-2004-2.2.0-5), Tumorzentrum Heidelberg-Mannheim (D.10027440), and BMBF-NGFN2 (01GS0452). ReferencesC. H. Contag and
M. H. Bachmann,
“Advances in in vivo bioluminescence imaging of gene expression,”
Annu. Rev. Biomed. Eng., 4 235
–260
(2002). https://doi.org/10.1146/annurev.bioeng.4.111901.093336 1523-9829 Google Scholar
B. W. Rice,
M. D. Cable, and
M. B. Nelson,
“In vivo imaging of light-emitting probes,”
J. Biomed. Opt., 6
(4), 432
–440
(2001). https://doi.org/10.1117/1.1413210 1083-3668 Google Scholar
H. Zhao,
T. C. Doyle,
O. Coquoz,
F. Kalish,
B. W. Rice, and
C. H. Contag,
“Emission spectra of bioluminescent reporters and interaction with mammalian tissue determine the sensitivity of detection in vivo,”
J. Biomed. Opt., 10
(4), 41210
(2005). 1083-3668 Google Scholar
C. G. Lee,
K. Kinoshita,
A. Arudchandran,
S. M. Cerritelli, R. J. Crouch, T. Honjo,
“Quantitative regulation of class switch recombination by switch region transcription,”
J. Exp. Med., 194
(3), 365
–374
(2001). 0022-1007 Google Scholar
A. L. Szymczak,
C. J. Workman,
Y. Wang,
K. M. Vignali, S. Dilioglou, E. F. Vanin, and
D. A. Vignali,
“Correction of multi-gene deficiency in vivo using a single ‘self-cleaving’ 2A peptide-based retroviral vector,”
Nat. Biotechnol., 22
(5), 589
–594
(2004). 1087-0156 Google Scholar
N. Garbi,
S. Tanaka,
F. Momburg, and
G. J. Hammerling,
“Impaired assembly of the major histocompatibility complex class I peptide-loading complex in mice deficient in the oxidoreductase ERp57,”
Nat. Immun., 7
(1), 93
–102
(2006). 1018-8916 Google Scholar
J. Holst,
K. M. Vignali,
A. R. Burton, and
D. A. Vignali,
“Rapid analysis of T-cell selection in vivo using T cell-receptor retrogenic mice,”
Nat. Methods, 3
(3), 191
–197
(2006). 1548-7091 Google Scholar
|


