
|
|
1.IntroductionQuantitative and objective techniques are important for assessing sperm quality. Computer-assisted sperm analysis (CASA) systems have been developed to measure parameters such as curvilinear velocity (VCL), amplitude of lateral head movement, and percent of motile sperm, providing quantitative information about the overall motility of a sperm population.1, 2 In addition, flow cytometry in combination with fluorescent probes has been used to monitor mitochondrial membrane potential (MP) in sperm cells.3, 4, 5, 6 MP, given by the Nernst equation, is dependent on the distribution of hydrogen protons across the inner mitochondrial membrane. This electrochemical proton gradient drives the synthesis of ATP that is used for energy by the cell. Therefore, the fluorescence intensity of cyanine dyes, such as -diethyloxacarbocyanine iodide , which increases as the magnitude of MP increases, is an indicator of the energetic state of the cell. Studies have demonstrated that high MP in sperm correlates with increased motility3 as well as high-fertility performance.4, 5, 6 Several fluorescent probes are available, and comparisons between probes have been performed.4, 7 Specifically, Novo 7 showed that the ratiometric technique for estimation of MP using was an accurate indicator of bacterial MP. Single spot, gradient force laser tweezers is another tool that has been used to study sperm motility by measuring sperm swimming force. It has been shown8 that the minimum laser power needed to hold a sperm in the optical trap (threshold escape power) is directly proportional to the sperm’s swimming force ( , where is the swimming force in Newtons, is the laser power in Watts, is the speed of light in the medium with a given index of refraction, and is the geometrically determined trapping efficiency parameter). Previous studies have demonstrated a positive correlation between sperm swimming speed and escape laser power.9, 10, 11 Optical traps have also been used12 in combination with the fluorescent probe JC-1 ( , -tetra-chloro- , -tetraethylbenzimidazolyl-carbocyanine iodide). That study measured MP as the sperm were held in the laser trap. A major drawback, however, was the inability to determine not only the mitochondrial MP of the individual sperm before or after it was exposed to the laser tweezers, but also the sperm’s swimming speed and/or swimming force. Recently, computer tracking software and robotics were combined with the laser tweezers system to automate sperm trapping experiments.13, 14 This custom-designed real-time, automated, tracking and trapping system, or RATTS, presents itself as a potentially useful tool, in addition to CASA systems and flow cytometry, to assist in overall sperm quality assessment. RATTS has been modified to measure mitochondrial MP (prior to, during, and after trapping) in conjunction with swimming speed and escape laser power of individual sperm.15 In this paper, we describe the modification of RATTS to analyze domestic dog sperm labeled with the fluorescent probe . The effects of the probe on sperm motility are studied. The probe’s, as well as the system’s, ability to monitor changes in MP is quantified. The effects of prolonged exposed to the laser tweezers on VCL and MP are analyzed. Finally, the system’s capabilities are demonstrated by simultaneously measuring VCL, Pesc (swimming force in terms of escape laser power), and MP for individual sperm. The results show that the combination of laser tweezers, robotics, and the measurement of mitochondrial MP creates a system that is capable of providing a detailed description of individual sperm, including both motility and energetics. 2.Materials and Methods2.1.SpecimenSemen samples collected from several domestic dogs were cryogenically frozen according to a standard protocol.16, 17 Studies on human sperm have shown that properly freezing, storing, and thawing sperm has no significant effect on escape force.18 Furthermore, we compared frozen-thawed and fresh dog sperm from the same semen sample and found that the swimming speed and escape laser power distributions were statistically the same (swimming speed: ; escape power: , data not shown). Therefore, frozen-thawed semen samples in this study are considered comparable to fresh samples. For each experiment, a sperm sample is thawed in a water bath for approximately and its contents are transferred to an Eppendorf centrifuge tube. The sample is centrifuged at for (the centrifuge tip radius is ). The supernatant is removed and the remaining sperm pellet is suspended in of pre-warmed media [ of bovine serum albumin (BSA) per of Biggers, Whittens, and Whittingham (BWW), osmolality of water,19 pH of 7.2 to 7.4]. Note that this media is non-capacitating, as it has a low concentration of bicarbonate20 . Therefore, the sperm do not achieve hyperactivity. To monitor the voltage potential across the inner membrane of the mitochondria, sperm are labeled with ( -dithyloxacarbocyanine, final dye concentration, Molecular Probes, Invitrogen Corp., Carlsbad, California). is a cationic cyanine dye that primarily accumulates in the mitochondria of a cell in response to the electrochemical proton gradient, or MP. The probe emits both a red and green fluorescence. The ratiometric parameter (red/green intensity) is a size-independent measure of MP, as the green fluorescence varies with size and red fluorescence is dependent21 on both size and MP. After the dye is added, the cells are incubated for in a water bath and then centrifuged for . The pellet is suspended in the media by “flicking” the tube according to the protocol for the MitoProbe assay kit (Invitrogen Corp.) for flow cytometry. To test sensitivity of both the probe and the system to changes in MP (see Sec. 2.4), an aliquot of sperm are exposed to the proton ionophore CCCP (carbonyl cyanide 3-chlorophenylhydrazone, final concentration, Molecular Probes, Invitrogen Corp., Carlsbad, California), which is known7, 22 to decrease the magnitude of the MP. CCCP and are added to the sperm simultaneously. Final dilutions of of media are used in the experiments. The sperm dilution is loaded into a Rose tissue culture chamber and mounted into a microscope stage holder according to previously described methods.23 The sample is kept at using an air curtain incubator (NEVTEK, ASI 400 Air Stream Incubator, Burnsville, Virginia). A thermocouple is attached to the Rose chamber to ensure temperature stability. 2.2.Hardware, Software, and Optical DesignThe optical system, shown in Fig. 1a , is adapted after Nascimento, 10 A single point gradient trap is generated using an continuous wave wavelength laser (Spectra Physics, BL-106C, Mountain View, California), coupled into a Zeiss Axiovert S100 microscope equipped with a phase III, , 1.3 numerical aperture (NA), oil immersion objective (Zeiss, Thornwood, New York). The laser power in the specimen plane is attenuated by rotating the polarizer, which is mounted in a stepper-motor-controlled rotating mount (Newport Corporation, Model PR50PP, Irvine, California). Fig. 1(a) Optical schematic showing the optical components used to generate and control the laser tweezers and (b) imaging setup showing the illumination sources, filters, and cameras used to image the sperm in both phase contrast and fluorescence. 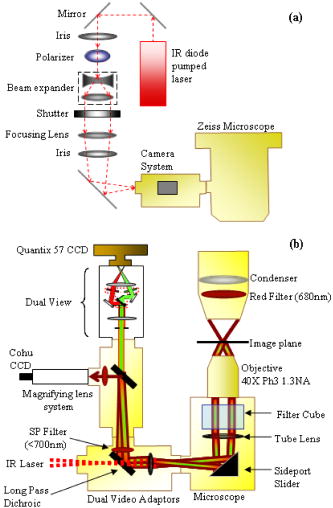 The imaging setup, shown in Fig. 1b, was adapted after Mei 12 Two dual video adapters are used to incorporate the laser into the microscope and simultaneously image the sperm in phase contrast and fluorescence. The laser beam enters the side port of the first dual video adapter and is transmitted to the microscope. A filter (Chroma Technology Corp., Model E700SP-2P, Rockingham, Vermont) is used to prevent back reflections of IR laser light from exiting the top port of the adapter but allow reflected visible light coming from the specimen to pass to the second video adapter. The specimen is viewed in phase contrast using red light filtered from the halogen lamp (Chroma Technology Corp., Model D680/60 X) and in fluorescence using the arc lamp (Zeiss FluoArc). The fluorescence filter cube contains an HQ excitation filter and a dichroic beamsplitter with a cut-on wavelength. The second dual video adapter attached to the top port of the first video adapter uses a filter cube to separate the phase information (reflects ) from the fluorescence (transmits ). The phase contrast images are filtered through a filter (Chroma Technology Corp., Model HQ 675/50M) and acquired by a CCD camera (Cohu, Model 7800, San Diego, California, operating at ) coupled to a variable zoom lens system (0.33 to magnification) to increase the field of view. For the fluorescent images, a Dual-View system (Optical-Insights, Tucson, Arizona) splits the red and green fluorescent light emitted by the specimen to produce a copy of the image for each color. Fluorescent emission filters are placed in this emission-splitting system (green fluorescence emitter: HQ M filter; red fluorescence emitter: HQ M filter, Chroma Technology Corp.). The Dual-View system is coupled to a digital camera (Quantix 57, Roper Scientific Inc., Tucson, Arizona) that captures the fluorescent images. The hardware and software to perform the experiments in this paper are described in greater detail elsewhere.15 Briefly, two computers are networked together. An upper-level computer that acquires and displays the images from the Cohu CCD is responsible for tracking and trapping the sperm of interest. The lower-level computer is prompted by the upper-level computer to acquire the fluorescent images of the sperm’s mitochondria from the Quantix CCD. From the image, the lower level computer calculates the ratio (red/green) value. Once the user selects the sperm of interest, the upper level computer tracks the sperm and calculates the VCL (in micrometers per second) in real time. Note that other motility parameters including lateral head movement, straight line velocity, and smoothed-path velocity that are typical of a CASA system are also calculated.10, 13, 14 Nascimento found that several of these parameters had near equal influence on the variability in the data set.10 Therefore, for the purpose of this paper, only VCL is used to describe sperm swimming speed, as it is a more comprehensive parameter, accounting for both forward progression and lateral head movement.11 During this tracking phase, the microscope stage moves the sperm to the center of the field of view if it nears the edge. In addition, the sperm is relocated to a defined coordinate every second and a command is sent to the lower-level computer to acquire a fluorescent image. For track-and-trap experiments, the sperm is relocated to the laser trap coordinates after being tracked and fluorescently imaged for . Once the sperm is successfully trapped by the laser tweezers, the lower-level computer continuously acquires fluorescent images. Laser power is either kept constant (see Sec. 2.5) or is attenuated (see Sec. 2.6). If the power is attenuated, the power at which the sperm is capable of escaping the trap (Pesc, in milliwatts) is recorded by the upper-level computer. The sperm is tracked and fluorescently imaged for an additional once it is released from or escapes the optical trap. Data for each tracked sperm, including trajectory coordinates in the field of view, stage movement, instantaneous VCL, and average VCL, for each time point is saved to a file on the upper-level computer. The fluorescent data—including the average, maximum, and minimum ratio values—for each image are saved to a file on the lower-level computer. 2.3.Effect of Probe on Sperm MotilityThe effects of on sperm motility are assessed. The swimming speed (VCL in micrometers per second) distribution of sperm exposed to is compared to that of sperm not exposed to the probe (control). Sperm from each group are analyzed during the same time intervals. During the first time interval, both groups are viewed in phase contrast microscopy only. During the second time interval, again, both groups are viewed in phase contrast microscopy. However, the test group exposed to are also illuminated with excitation light from the arc lamp. 2.4.Sensitivity to Changes in MPThe ability to measure changes in MP as well as the ability to detect and report changes in MP is tested. The test sperm group are exposed to both CCCP and , whereas the control sperm group are labeled only with . Sperm are loaded onto the microscope and tracked for . A fluorescent image is acquired every second. The ratio value distributions of the test and control groups are compared. 2.5.Track, Trap (Constant Power and Constant Duration), and Fluorescently ImageSperm labeled with are tracked and trapped under constant power for a constant duration . For each sperm analyzed, fluorescent images are acquired approximately once every second during the prior to and after trapping and acquired continuously once the sperm is in the trap. Effects of prolonged exposure to the laser tweezers on MP and swimming speed (VCL in micrometers per second) are assessed. 2.6.Track, Trap (Decaying Laser Power), and Fluorescently ImageSperm labeled with are tracked and trapped under decaying power. Again, for each sperm, fluorescent images are acquired once every second during the prior to and post trapping and acquired continuously once the sperm is in the trap. Examples of the various sperm responses to the optical trap are described. 3.Results3.1.Effect of Probe on Sperm MotilityThe swimming speed (VCL in micrometers per second) distribution of sperm cells exposed to is compared to that of the control sperm using the Wilcoxon paired-sample test (the distributions are found not to be Gaussian, thus requiring the non-parametric test). The VCL distributions are found to be statistically equal, even when the probe is activated by the arc lamp (without arc lamp illumination; , , ; with arc lamp illumination; , , ). Thus, does not adversely affect sperm motility. 3.2.Sensitivity to Changes in MPSince the probe used in this study is typically applied in flow cytometry experiments, we wanted to verify that our custom system and method of analysis is sensitive to changes in MP. We also wanted to verify that this probe reports changes in MP. Figure 2 shows the ratio value over a interval for sperm from the test group (with CCCP) and control group (without CCCP). The figure demonstrates that CCCP does indeed cause a decrease in MP and that both the probe and the system are capable of reporting such a decrease. The average ratio value of sperm exposed to CCCP ( , ) versus that of the control sperm ( , ) is found to be statistically significantly different using the Student’s test (distributions are found to be Gaussian). The velocity of each sperm was also measured. The average VCL value of sperm exposed to CCCP versus that of the control sperm is found to be statistically the same using the Student’s test (distributions are found to be Gaussian). Fig. 2Effects of CCCP on mitochondrial membrane potential. The ratio value (red/green fluorescence) is plotted against time (in seconds). Ratio values are measured over a 10-s interval for test sperm group (with CCCP, in magenta) and control sperm group (without CCCP, in black). Each track represents an individual sperm.  3.3.Track, Trap (Constant Power and Constant Duration), and Fluorescently ImageFigure 3 shows the ratio value prior to trapping, during trap, and after trapping plotted over time for two different sperm. For the sperm in Fig. 3a, there is an overall decline in ratio value over time as the sperm is held in the trap. Once released from the optical trap, the sperm’s ratio value does increase, however, it does not fully recover within to the original value it was prior to being trapped. Similarly, the sperm’s swimming speed, VCL, does not recover to its pre-trapping value. For the sperm in Fig. 3b, there is a slight decrease in ratio value while the sperm is in the trap. Again, neither swimming speed nor ratio value fully recover post trap to the pre-trapping values. A previous study had shown that trapping sperm for at a constant power of in the focal volume had a negative effect on sperm motility.10 The results reported here are consistent with those findings. Fig. 3Track, trap (constant power, constant duration) and fluorescently image. The ratio value (red/green) is plotted against time (in seconds) for the three different phases: prior to trapping, during trap, and after trapping. Both the average ratio value (AveRat) and VCL prior to (pre) and after trapping (post) are inset in the figure for each sperm (a) and (b). A trap duration of has a negative effect on sperm motility and energetics. (Color online only.)  3.4.Track, Trap (Decaying Laser Power), and Fluorescently ImagePesc was plotted against VCL (data not shown) and showed the same positive correlation between the two parameters as found in previous studies10 (regressions applied to data sets found to be statistically equal, ). Figure 4 plots the ratio value over time for four sperm for the three different phases: prior to trapping, during trap, and after trapping. These four examples demonstrate the various responses the sperm have to the optical trap. The sperm in Fig. 4a did not escape the trap. After , the trapping power reaches the minimum , at which point the trap turns off. This sperm’s VCL slightly increased after being trapped, but the average ratio value decreased. The sperm in Fig. 4b escaped the trap at and had an approximate 18% increase in VCL after trapping. However, the average ratio value was nearly the same after trapping as it was prior to trapping. The sperm in Fig. 4c, although it escaped at a relatively high power, had a significant decrease in VCL, yet the average ratio value increased slightly. The sperm in Fig. 4d, which escaped the trap at , also had a decrease in VCL and an increase in average ratio value. Fig. 4Track, trap (decaying laser power) and fluorescently image. The ratio value (red/green) is plotted against time (in seconds) for the three different phases: prior to trapping, during trap, and after trapping. Various escape powers and swimming speeds are represented by the four sperm. The average ratio value (AveRat) and VCL prior to (pre) and after trapping (post), as well as Pesc, are inset in the figure for each sperm (a) to (d). (Color online only.)  4.DiscussionIn this paper, a mitochondrial membrane potential probe was used in combination with a custom-automated tracking and trapping system. We demonstrated how this technique can be applied to the study of sperm motility and energetics. Moreover, we created a protocol that can be used to compare various MP probes. First, the effects of the probe on sperm swimming speed are established. Specifically, was shown to not affect sperm swimming speed (VCL). Second, the probe’s ability to report an expected decrease in MP was verified. The ratio measurement of the red to green fluorescent signal from showed a significant decrease in MP caused by the addition of the proton ionophore CCCP (see Fig. 2). This also demonstrates that the system’s hardware and software, including the custom algorithms, are sensitive to changes in MP. Third, the system can then be used to monitor MP of individual sperm over a long period of time and assess the adverse effects of prolonged exposure to optical traps. As shown in Fig. 3, both VCL and MP values post-trapping are less than those prior to trapping. These results show that the ratio value can reflect the varying degrees of cell damage induced by the laser trap as well as partial cell recovery once the laser trap is turned off. Fourth, and finally, we have demonstrated how this system can be used to simultaneously measure sperm swimming speed, escape laser power, and sperm mitochondrial MP in real time. In conclusion, we created a technique to quantitatively assess sperm quality and viability. We demonstrated how a combination of imaging and optical tools can be used to provide a detailed description of individual sperm by measuring not only sperm motility parameters, such as VCL and Pesc, but also mitochondrial MP. This system can therefore be used to address the relationship between mitochondrial respiration and motility. Knowing that there is indeed a relationship between VCL and Pesc, as found in a previous study,10 one would expect that there would also be relationships between VCL and MP and/or Pesc and MP. However, to draw statistically significant conclusions regarding these relationships, more experiments must be conducted to achieve larger values. More importantly, this system can be used to a gain better understanding of the role of oxidative phosphoyrlation in sperm cell motility. For example, the results found in this paper interestingly show no correlation between MP and sperm motility (in terms of VCL) when the sperm were exposed to CCCP. One would expect exposure to this ionophore would inhibit mitochondrial ATP production and thus reduce sperm motility. However, no such decrease in velocity was observed (the VCL of the control group was found to be statistically equal to that of the test group). This suggests that perhaps another pathway, such as glycolysis, which is known to occur along the sperm tail, or principal piece,24, 25, 26 may be supporting motility when oxidative phosphorylation is inhibited. Future studies will assess the effects of various electron transport chain inhibitors, such as rotenone and antimycin A, as well as glycolytic inhibitors, such as 2-deoxy-D-glucose, on sperm mitochondrial MP, VCL, and Pesc. AcknowledgmentsThis work was supported by funds from the Beckman Laser Institute Inc. Foundation and a grant from the Air Force Office of Scientific Research (AFOSR No. F9620-00-1-0371) awarded to MWB. ReferencesR. P. Amann and
D. F. Katz,
“Reflections on CASA after ,”
J. Androl, 25
(3), 317
–325
(2004). 0196-3635 Google Scholar
D. Mortimer, Practical Laboratory Andrology,
(1994) Google Scholar
C. Marchetti,
G. Obert,
A. Deffosez,
P. Formstecher, and
P. Marchetti,
“Study of mitochondrial membrane potential, reactive oxygen species, DNA fragmentation and cell viability by flow cytometry in human sperm,”
Hum. Reprod., 17
(5), 1257
–1265
(2002). 0268-1161 Google Scholar
C. Marchetti,
N. Jouy,
B. Leroy-Martin,
A. Deffosez,
P. Formstecher, and
P. Marchetti,
“Comparison of four fluorochromes for the detection of the inner mitochondrial membrane potential in human spermatozoa and their correlation with sperm motility,”
Hum. Reprod., 19
(10), 2267
–2276
(2004). 0268-1161 Google Scholar
F. Gallon,
C. Marchetti,
N. Jouy, and
P. Marchetti,
“The functionality of mitochondria differentiates human spermatozoa with high and low fertilizating capability,”
Fertil. Steril., 86
(5), 1526
–1530
(2006). 0015-0282 Google Scholar
T. Kasai,
K. Ogawa,
K. Mizuno,
S. Nagai,
Y. Uchida,
S. Ohta,
M. Fujie,
K. Suzuki,
S. Hirata, and
K. Hoshi,
“Relationship between sperm mitochondrial membrane potential, sperm motility, and fertility potential,”
Asian J. Androl., 4
(2), 97
–103
(2002). Google Scholar
D. Novo,
N. G. Perlmutter,
R. H. Hunt, and
H. M. Shapiro,
“Accurate flow cytometric membrane potential measurement in bacteria using diethyloxacarbocyanine and a ratiometric technique,”
Cytometry, 35 55
–63
(1999). 0196-4763 Google Scholar
K. Konig,
L. Svaasand,
Y. Liu,
G. Sonek,
P. Patrizio,
Y. Tadir,
M. W. Berns, and
B. J. Tromberg,
“Determination of motility forces of human spermatozoa using an optical trap,”
Cell. Mol. Biol. (Paris), 42
(4), 501
–509
(1996). 0145-5680 Google Scholar
Y. Tadir,
W. H. Wright,
O. Vafa,
T. Ord,
R. H. Asch, and
M. W. Berns,
“Force generated by human sperm correlated to velocity and determined using a laser generated optical trap,”
Fertil. Steril., 53
(5), 944
–947
(1990). 0015-0282 Google Scholar
J. M. Nascimento,
E. L. Botvinick,
L. Z. Shi,
B. Durrant, and
M. W. Berns,
“Analysis of sperm motility using optical tweezers,”
J. Biomed. Opt., 11
(4), 044001
(2006). https://doi.org/10.1117/1.2337559 1083-3668 Google Scholar
J. M. Nascimento,
L. Z. Shi,
S. Meyers,
P. Gagneux,
N. M. Loskutoff,
E. L. Botvinick, and
M. W. Berns,
“The use of optical tweezers to study sperm competition and motility in primates,”
J. R. Soc., Interface, 5
(20), 297
–302
(2007). https://doi.org/10.1098/rsif.2007.1118 1742-5689 Google Scholar
A. Mei,
E. Botvinick, and
M. W. Berns,
“Monitoring sperm mitochondrial respiration response in a laser trap using ratiometric fluorescence,”
Proc. SPIE, 5930
(2F), 1
–11
(2005). 0277-786X Google Scholar
L. Z. Shi,
J. Nascimento,
M. W. Berns, and
E. Botvinick,
“Computer-based tracking of single sperm,”
J. Biomed. Opt., 11
(5), 054009
(2006). https://doi.org/10.1117/1.2357735 1083-3668 Google Scholar
L. Z. Shi,
J. M. Nascimento,
C. Chandsawangbhuwana,
M. W. Berns, and
E. Botvinick,
“Real-time automated tracking and trapping system (RATTS),”
Microsc. Res. Tech., 69
(11), 894
–902
(2006). https://doi.org/10.1002/jemt.20359 1059-910X Google Scholar
L. Z. Shi,
E. L. Botvinick,
J. Nascimento,
C. Chandsawangbhuwana, and
M. W. Berns,
“A real-time single sperm tracking, laser trapping, and ratiometric fluorescent imaging system,”
Proc. SPIE, 6326 63260x
(2006). 0277-786X Google Scholar
B. S. Durrant,
D. Harper,
A. Amodeo, and
A. Anderson,
“Effects of freeze rate on cryosurvival of domestic dog epididymal sperm,”
J. Androl, 21
(2000). 0196-3635 Google Scholar
S. A. Harper,
B. S. Durrant,
K. D. Russ, and
D. Bolamba,
“Cryopreservation of domestic dog epididymal sperm: a model for the preservation of genetic diversity,”
J. Androl, 19
(1998). 0196-3635 Google Scholar
Z. N. Dantas, E. Araujo Jr., Y. Tadir,
M. W. Berns,
M. J. Schell, and
S. C. Stone,
“Effect of freezing on the relative escape force of sperm as measured by a laser optical trap,”
Fertil. Steril., 63
(1), 185
–188
(1995). 0015-0282 Google Scholar
J. D. Biggers,
W. D. Whitten, and
D. G. Whittingham,
“The culture of mouse embryos in vitro,”
Methods of Mammalian Embryology, 86
–116 Freeman, San Francisco
(1971). Google Scholar
K. Bedu-Addo,
L. Lefievre,
F. L. C. Moseley,
C. L. R. Barratt, and
S. J. Publicover,
“Bicarbonate and bovine serum albumin reversibly ‘switch’ capacitation-induced events in human spermatozoa,”
Mol. Hum. Reprod., 11
(9), 683
–691
(2005). 1360-9947 Google Scholar
D. Novo,
N. G. Perlmutter,
R. H. Hunt, and
H. M. Shapiro,
“Multiparameter flow cytometric analysis of antibiotic effects on membrane potential, membrane permeability, and bacterial counts of Staphylococcus aureus and Micrococcus luteus,”
Antimicrob. Agents Chemother., 44
(4), 827
–834
(2000). 0066-4804 Google Scholar
A. M. Guzman-Grenfell,
M. A. Bonilla-Hernandez, and
M. T. Gonzalez-Martinez,
“Glucose induces a NA+, K+-ATPase-dependent transient hyperpolarization in human sperm. I. Induction of changes in plasma membrane potential by the proton ionophore CCCP,”
Biochim. Biophys. Acta, 1464 188
–198
(2000). 0006-3002 Google Scholar
L. H. Liaw and
M. W. Berns,
“Electron microscope autoradiography on serial sections of preselected single living cells,”
J. Ultrastruct. Res., 75 187
–194
(1981). 0022-5320 Google Scholar
R. M. Turner,
“Tales from the tail: what do we really know about sperm motility?,”
J. Androl, 24
(6), 790
–803
(2003). 0196-3635 Google Scholar
W. C. L. Ford,
“Glycolysis and sperm motility: does a spoonful of sugar help the flagellum go round?,”
Hum. Reprod. Update, 12
(3), 269
–274
(2006). 1355-4786 Google Scholar
C. Mukai and
M. Okuno,
“Glycolysis plays a major role for adenosine triphosphate supplementation in mouse sperm flagellar movement,”
Biol. Reprod., 71 540
–547
(2004). 0006-3363 Google Scholar
|


