
|
|
1.IntroductionThe cell nucleus contains the DNA and, as the site of gene transcription, is responsible for the first step in a series of biochemical processes resulting in protein synthesis that is essential for virtually all cellular functions. The nuclear envelope separates the cell nucleus and cytoplasm. It consists of an inner and outer membrane separated by peri-nuclear space and perforated by nuclear pores. All active and passive transport processes in and out of the nucleus take place via the nuclear pores.1, 2 The nuclear envelope is not a spherical coat, as portrayed in many textbook diagrams, but can have a complex shape that is linked to the function of the cell.3, 4 Compared to a spherical structure, a nonspherical, infolded nucleus may have an increased surface area and reduced diffusion distances between cytosolic and genomic sites. This may be particularly relevant for the dynamics of nuclear calcium signaling in neurons. Calcium is a key player in neuronal gene expression.5, 6 Increases in the intracellular calcium concentration that are evoked by electrical activity serve as the on-switch for neuronal gene expression programs.5, 6 In particular, the propagation of calcium across the nuclear envelope via the nuclear pore complex is critical for the induction of genomic events required for long-lasting adaptive responses in the nervous system, including learning and memory and survival. 7, 8, 9, 10 The geometry of nuclei may shape the dynamics of activity-induced nuclear calcium transients, and thus may represent an important parameter in the regulation of activity-dependent neuronal gene expression. Our long-term goal is to develop a data-driven model describing the dynamics of cytoplasmic and nuclear calcium in neurons. This requires as a first step the development of a method to obtain a 3-D view of neuronal nuclei. Based on our software tool NeuRA,11 we developed a tool to make a 3-D reconstruction of neuron cell nuclei. Starting with microscopy data from confocal fluorescence microscopy, we preprocess this data using an inertia-based nonlinear anisotropic diffusion filter,11 a cluster-segmentation process (Otsu-segmentation algorithm),12 and create a mathematical surface grid that represents the nuclear envelope. To that end, we redesigned the neuron reconstruction algorithm NeuRA,11 originally designed to filter 1-D structures, for filtering 2-D morphologies. To create a surface grid from a confocal microscopy image stack, it is necessary to preprocess the stack to retrieve a closed membrane structure in each layer of the nucleus image stack. Throughout the reconstruction process, we have to pay attention not to change any important features of the raw data, such as diameters of the membrane or size of the nucleus. Basic filters, like the Gaussian blur (a low-pass filter), do not consider local structures of the filtered object, and filter in all three dimensions with the same intensity. This leads to blurring—and therefore broadening—perpendicular to the membrane [Figs. 1a and 1c ]. When applying the developed reconstruction tools for 3-D reconstruction of hippocampal neuron nuclei, not only isotropic filters but also nonlinear anisotropic diffusion filters as in Refs. 13, 14 do not show the necessary sense of direction when trying to optimize the parameters of gap closure and membrane diameter at the same time. The task of closing gaps in the membrane and keeping its diameter constant is best carried out by the inertia-based filter presented here. Fig. 1(a) Raw image of nucleus. (b) Filtered with inertia-based nonlinear anisotropic filter for surfaces. (c) Filtered with Gaussian blur. (d) Filtered with anisotropic filter and segmented with the Otsu method. (e) Second pass of anisotropic filter on segmented image.  To avoid the loss of important morphological features, to separate noise and signal, and close gaps in the membrane, we used an inertia-based nonlinear anisotropic diffusion filter based on the inertial tensor that was originally developed for 3-D image data from two-photon microscopy of nerve cells.11 This filter was adapted for our purposes and its parameters were numerically optimized as described in Sec. 2.15 Different from other nonlinear anisotropic filter approaches, for example Refs. 13, 14, 16, the novel feature of this filter is the application of the local moments of the inertial tensor for structure recognition. The Otsu-segmentation algorithm,12 a local thresholding-segmentation process, proved to be the ideal method to create a binary image of the membrane from which the geometry can later be retrieved.15 Unlike global segmentation, with a fixed threshold for the entire stack; the Otsu method is able to close gaps, and at the same time preserve filigreed structures in the membrane (like infoldings) by adapting the threshold according to the local features of the data [Fig. 1d]. After a second filtering (to create a smooth surface grid), the data are sufficiently processed to extract the 3-D geometry of the nucleus. The extraction of the geometry of the nucleus is used for visualization purposes and forms the basis for mathematical simulations based on full 3-D information of neuron nuclei. To create an isosurface of the membrane, we used a marching tetrahedra algorithm and for separation of more than one isosurface—a modified Dijkstra graph-search method.17 To visualize the isosurface, we used the VTK Toolkit.18 Surface and volume of the nuclei were calculated within our algorithm by transforming the isosurface data into a commercial tin-format, which can be loaded into the program ICEM CFD.19 An additional program calculates surface area and volume from the surface and volume grid that is created by ICEM CFD. 2.Inertia-Based Nonlinear Anisotropic FilterPartial differential equations (PDEs) offer excellent filter methods. The diffusion equation with being the Laplace operator, describes linear isotropic diffusion. The previously mentioned Gaussian blur is described by the prior diffusion equation.Figure 1c shows that the Gaussian blur, as a representative of linear filters, is insensitive to the geometry of the membrane. Its diameter is visibly broadened due to the isotropy of the diffusion process. This aspect leads us to nonlinear anisotropic filters.20 Including a diffusivity tensor in Eq. 1, we can define the boundary value problem With the integrated diffusivity tensor, we have the possibility to direct diffusion along the membrane and inhibit diffusion perpendicular to the membrane. Very different methods for directional filtering have been discussed, level set methods in Ref. 16 or diffusivity functions in Ref. 14, for example. A new approach has been to define in Ref. 11 by using the physical moments of inertia; local geometrical properties can thus be retrieved.2.1.Detection of Local StructuresIdentifying the image stack as a physical body,11, 21 the local moments of inertia were defined by Following an idea from Ref. 22, defines the integration volume around the voxel that is to be filtered, the scanning range. Tests in Refs. 15, 23 showed that an ideal integration volume was that of voxels, which was also used in the results presented here. The tests showed that the control volume should neither be too small (gaps in the membrane would not be recognized properly), nor too large (this would take too much global information into account when calculating the local moments of inertia). The eigenvectors and eigenvalues of the moment of inertia tensor can now be used to detect the properties of local structures, the eigenvectors being the main axes of inertia. The eigenvalues contain the information about the structure of the object that is to be filtered. If is far greater than and , the object is identified as a linear structure along the direction of eigenvector . Therefore, if and have similar values and are greater than , the filter object is identified as planar. In the third case, all three eigenvalues lie close together, identifying the object as isotropic.2.2.Directing the DiffusionWith the help of principal axes transformation, the previous moment of inertia tensor in Eq. 6 can be transformed in the following way: with the eigenvalues in , an orthogonal matrix made up from the eigenvectors of and the unit matrix.The diffusivity tensor is then described by: with , , and being the eigenvectors of the integration volume , sorted according to the size of their corresponding eigenvalues . Our idea to allow diffusion along the nuclear membrane, i.e., the two main eigenvectors, and block diffusion perpendicular to the membrane can be realized by replacing the two eigenvalues belonging to the main eigenvectors with the value 1 and the smallest eigenvalue with a “near zero” value . We define our permeability tensor as:The prior concepts were implemented for linear structures in Ref. 11. Here, we chose a dimension-independent implementation. The partial differential equation in Eq. 3 was solved using a semi-implicit time discretization and a finite volume spatial discretization, as done in Ref. 11. In the computations, we used .Following the filtering of raw image data, a segmentation process, following Ref. 12, is applied to lose background noise and to extract the membrane fluorescence signal. 3.Measurements of the Nucleus3.1.Creating GridsAfter filtering, segmentation, and a second pass of the filter, the raw microscopy data is sufficiently preprocessed to create an isosurface of the nucleus membrane, which forms the basis for visualization and simulation purposes. For this task, a marching tetrahedra algorithm and a modified Dijkstra graph-search method for separation of surfaces17 was implemented. In the marching tetrahedra algorithm, a cube the size of 8 voxels that is divided into five tetrahedra scans the processed microscopy data. We linearly interpolate the gray values in-between the corner gray values of the tetrahedra along the edges of the tetrahedra. After scanning the entire stack, all values with a previously defined gray value are assembled and connected to a triangular grid. To store this information, we designed a filter that creates a linear geometry model (1gm) file.24 The 1gm describes faces by piece-wise triangles and is one of the geometry models implemented in the simulation system unstructured grids (UG),25 in which PDE-based models can be implemented on highly unstructured geometries. 1gm contains point, line, and triangle information about the surface. The triangles were oriented in a postprocess; that way the data can be included in the simulation-tool UG. In our case, we built surface and volume grids with ICEM CFD. Therefore, we reassembled the lgm-data in a tin-format, a file-format for ICEM CFD. The data of the tetrahedral-volume grid are stored in two separate files, a vrt-file and a cel-file. 3.2.Surface and Volume CalculationThe surface area of the nucleus membrane can immediately be calculated with ICEM CFD. To calculate the volume of the nucleus, we retrieved the information of the tetrahedral grid that represents the geometry of the nucleus as long as the grid is chosen fine enough to resolve the surface of the nucleus. We added a program written in perl that calculates the volume of each tetrahedron of the grid, assembling the information from the vrt- and cel-file in the following way: with , , , and being the corners of the tetrahedron. The single tetrahedra volumes are then added up to the nucleus volume.4.Confocal Fluorescence MicroscopyThe primary data were obtained using a Leica SP2 laser scanning confocal microscope. Primary hippocampal neurons derived from newborn rats were cultured for 10 days,26 and then subjected to immunocytochemistry using a primary antibody to laminB (kindly provided by Herrmann at the German Cancer Research Center, Heidelberg) and Alexa488-labeled secondary antibody. The Alexa488 fluorescence was measured using a Leica SP2 laser scanning confocal microscope. The laminB antibody decorates the inner nuclear envelope and was used to detect the inner membrane surface of the nuclei (Fig. 2 ). Stacks with a constant distance between images and consisting of 50 to 70 images in total were taken from individual nuclei. The following points were respected in the recording of image data.
5.Results5.1.Preparations on Artificial DataTo test the effect of various filter parameters and compare the results to ordinary linear isotropic filters, we began our numerical optimization on artificial data. In contrast to Ref. 11, we now are dealing with 2-D substructures in a 3-D domain. We designed four different test geometries (see Table 1 and Fig. 3 ). Fig. 3Test geometries for filter tests. (a) Plane with holes of different sizes and (b) a sphere with holes were constructed to test edge detection of the filter on linear and curved geometries, as well as the ability to close holes. 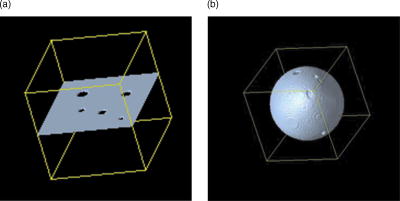 Table 1Artificial geometries (see Fig. 3): planes and spheres with a defined width and radius were used to test the filter on its ability of closing gaps.
There are several parameters that have to be considered when using the implemented inertia-based nonlinear anisotropic filter as designed in Ref. 11, such as the number of time steps, the geometry type of the integration volume, or the size of the integration volume. All parameters were tested and optimized in Ref. 15. In our tests we use a cube as the integration volume with voxels in size. This setting proved to be an ideal size and geometry. The number of time steps affects the strength of the filter process and was set to time steps = 4. In Ref. 15, we found this to be the optimum value. We first applied the filter to the plane without holes to verify that the filter does not allow diffusion perpendicular to the plane. As a comparison, we also show the effect of an isotropic filter process. The results of these tests are shown in Fig. 4 . As expected, the anisotropic filter does not change the image, while the isotropic filter clearly broadens the diameter of the plane. Fig. 4(a) Linear filter application on plane. (b) Anisotropically filtered plane. (c) Raw image of plane.  To investigate whether the filter can handle changes of direction in the structure, we filtered a sphere and later a sphere with holes of different diameters. Although the sphere changes its tangent direction in each point, there is hardly any broadening of the diameter [Figs. 5a and 5c ]. In the case of isotropic filtering, one can again see a drastic influence of the filter on the diameter [Figs. 5a and 5b]. Fig. 5(a) Raw image of sphere with holes. (b) Gaussian filter applied to raw data. (c) Inertia-based filter. (d) Perona-Malik filter. (e) Weickert filter.  On the four test geometries, the inertia-based nonlinear anisotropic filter proves to be ideal if diameters and geometric properties are to be kept unchanged. The effects of different filters on the sphere with holes are shown in Table 2 . As mentioned earlier, a vital issue is the continuity of the nuclear envelope. The next step was to investigate if the filter closes gaps in the object of interest. In Ref. 11, it was demonstrated that the filter closes apparent gaps in linear structures. We ran tests on surfaces with the adapted permeability tensor in Sec. 2.2. Table 2Effect of filters on membrane diameter and gaps. The membrane diameters and gap diameters were normed in respect to those of the raw data set. Shown is the effect of different filters on the diameters of the raw data. The inertia-based anisotropic diffusion filter (2-D structure detection) demonstrates the least membrane broadening while closing a gap entirely.
Figure 6 shows the results of different filters. The filter used in Ref. 11, designed for linear structures, shows no effect on the hole in the sphere [Fig. 6a]. Isotropic filtering does affect the hole in the structure to some extent, yet at the same time the diameter of the sphere membrane is broadened [Fig. 6b]. Our adapted filter for surfaces shows the desired effect (Table 2). The gap is visibly affected; at the same time, the diameter of the sphere membrane is hardly affected [Fig. 6c]. 5.2.Tests on Confocal ImagesThe surface filter showed the desired properties on our test geometries. We then applied our filter on confocal fluorescence microscopy image stacks. These stacks were recorded according to Sec. 4. Figure 1a shows a typical confocal image. The fluorescence signal along the membrane is not continuous; in certain areas the signal is clustered, in others there are gaps in the membrane signal. Also, there is background noise, which is not part of the nuclear envelope. Applying the anisotropic filter for surfaces, the signal-to-noise ratio is improved, and continuity in the membrane signal is established [Fig. 1b]. This effect can also be achieved by applying a linear filter; the disadvantage is a change in the diameter of the membrane, which changes the geometry of the nucleus visibly [Fig. 1c]. The important issue in the described preprocessing steps is the closing of gaps and elimination of background noise. By filtering the raw data, we have effectively prepared the image for segmentation. We made use of the Otsu-segmentation method as proposed in Ref. 12. Figure 1d shows the effect of this segmentation method on our filtered image. Figure 1e demonstrates the final result after filtering the binary image a second time. 5.3.Comparing Other Nonlinear Diffusion Filters to the Inertia-Based FilterA number of methods for directed diffusion filtering have been proposed in the past. Perona and Malik13 proposed the diffusion equation The function is used to direct diffusion in designated directions as well as dampen diffusion in other directions, resulting in nonlinear diffusion filtering. Here, we compare two methods well established in the literature, the Perona-Malik diffusivity 13 and the Weickert diffusivity,14 with the proposed inertia-based nonlinear anisotropic diffusion filter. The definitions of for these approaches are:
Fig. 7(a) Line plot perpendicular to membrane of the gray value profile of raw data and after application of different filters. (b) Line plot parallel and through a hole in the membrane of the gray value profile of raw data and after application of three different nonlinear diffusion filters. (c) Background noise levels of different nonlinear diffusion filters in respect to the inertia-based diffusion filter. 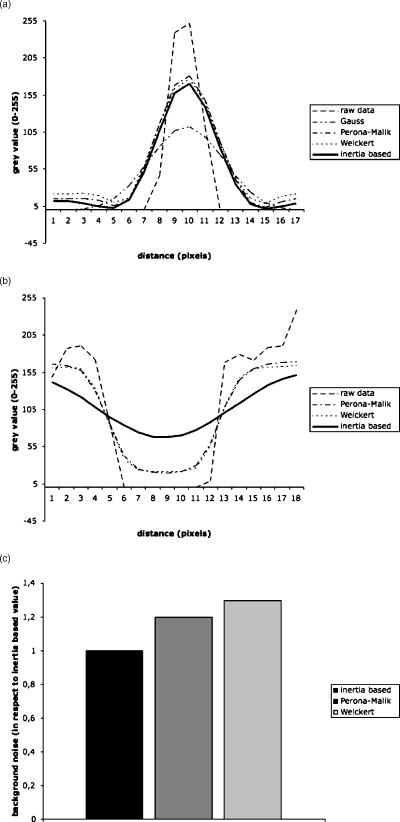 Table 3Results of Weickert filter on gap and membrane diameters in respect to the choice of λ , while m=4 and cW=−1 compared to the inertia-based filter. The minimum gray value was measured in the gap to be closed by the filter. Best results are achieved when maximizing the minimum gray value.
Table 4Results of Weickert filter when changing the parameter m . To that end, λ is set to 1 and cW=−1 .
The same investigations were carried out for the Perona-Malik filter; results of these tests are shown in Tables 5, 6 . The results for optimizing the Perona-Malik filter are comparable to the ones of the Weickert filter. In addition, Fig. 7c demonstrates the fact that the inertia-based filter produces less background noise than the two anisotropic diffusion filters tested here. The tests show that when trying to tune both parameters, i.e., membrane diameter and gap closure, at the same time, the inertia-based filter shows ideal effects. Table 5Effect of Perona-Malik filter on gap and membrane diameters in respect to variation of the parameter λ while α=1 and cPM=1 .
Table 6Perona-Malik filter results in respect to changes in the parameter α with λ=0.3 and cPM=1 .
5.4.Visualization and Measurement ResultsAt this point, the image data are sufficiently processed to retrieve the first 3-D visualization. Figure 8a shows a nucleus visualized using the software tool Data Explorer. As mentioned earlier, the fluorescence signal only follows the inner trajectory. Therefore, we developed a tool to open the nucleus to see the infoldings [Figs. 8b and 8c]. Fig. 8(a) 3-D reconstruction of a nucleus using Data Explorer. (b) Opened nucleus (a) (left half) and (c) (right half).  Since this way of visualizing the nucleus is apparently not advantageous, we extracted the inner geometry according to Sec. 3.1. The results of this procedure are demonstrated in Fig. 9 . We end up with a mathematical reconstruction of the nucleus, the nucleus now being described by a surface and volume grid. The pictures in Fig. 9 were taken by visualizing the surface grid with the VTK tool. 6.DiscussionIn Secs. 2, 3, we developed a method to reconstruct and measure the geometry of nuclei from hippocampal neurons. To reconstruct the geometry from confocal fluorescence microscopy stacks, it is necessary to preprocess the raw microscopy data. As a first preprocessing step, we applied an inertia-based nonlinear anisotropic filter. We adapted the anisotropic filter from Ref. 11, developed for the filtering of linear structures. This filter is based on the local moments of inertia, which are used to detect certain types of substructures in the filtered geometry as linear, planar, or isotropic. With the help of the diffusion tensor, we can allow diffusion in two directions (planar structure) and block diffusion perpendicular to the planar structure. As opposed to linear filters, for instance the Gaussian blur, or nonlinear anisotropic filters, such as the filters of Perona-Malik and Weickert, the inertia-based anisotropic filter for planar structures is ideal for reconstructing the 3-D geometry of nuclei. It closes gaps in the membrane and smoothes the noncontinuous fluorescence signal recorded from the microscope while keeping the geometry as constant as possible. These features were tested and demonstrated on test geometries, such as planes with and without holes, and spheres with and without holes of different diameters, and compared with other state of the art anisotropic filters. Next, the filter was applied to a large number of microscopy stacks. The desired effects of the filter are recorded in Ref. 15. Further, the inertia-based filter was compared to other anisotropic filters. Here, the effect of the filters on membrane diameters, gaps, and background noise was investigated. This showed that the inertia-based filter is an ideal method for closing gaps when trying to keep the biological morphology unaffected. After the filtering of raw data, we separated the signal from background noise. For this separation, the prior filtering is necessary to enhance the signal-to-noise ratio. We applied the Otsu-segmentation algorithm to the filtered data. This algorithm offers a dynamic adaptive segmentation threshold. Compared to global segmentation algorithms with a fixed threshold, the Otsu method enables us to preserve details in the membrane, i.e., fine infoldings of the membrane, and at the same time close gaps in the membrane. To retrieve the geometry of the nucleus, a continuous signal is fundamental. With the help of the inertia-based anisotropic filter for surfaces and the Otsu-segmetation algorithm, we are capable of retrieving the nucleus geometry from the preprocessed image stack. A marching tetrahedra algorithm, described in Sec. 3, was used to retrieve surface data of the nucleus and generate a surface grid. We provide several filters to translate this surface data into standard file formats, such as the tin-format, used by the software tool ICEM CFD. With ICEM CFD, a tetrahedral volume grid can be constructed for additional processing. We further provide an algorithm to measure the surface and volume of the cell nucleus. This reconstruction tool offers the possibility of visualizing neuron cell nuclei three dimensionally (for example, with the toolkit VTK), and therefore the possibility to closer examine the morphology of the infoldings of the nuclear envelope. The nuclear infoldings may be particularly relevant for the nucleo-cytoplasmic exchange of calcium ions that is central to the regulation of activity-driven gene expression in neurons. Having established a method to reconstruct neuronal nuclei, a future goal is to develop a geometry-based model of the dynamics of cytoplasmic and nuclear calcium signaling. For modeling results of calcium dynamics on reconstructed 3-D geometries of hippocampal neuron nuclei, we here refer to a forthcoming paper. ReferencesD. Görlich and
U. Kutay,
“Transport between the cell nucleus and the cytoplasm,”
Annu. Rev. Cell Dev. Biol., 15 607
–660
(1999). https://doi.org/10.1146/annurev.cellbio.15.1.607 1081-0706 Google Scholar
M. W. Hetzer,
T. C. Walther, and
I. W. Mattay,
“Pushing the envelope: structure, function, and dynamics of the nuclear periphery,”
Annu. Rev. Cell Dev. Biol., 21 347
–380
(2005). https://doi.org/10.1146/annurev.cellbio.21.090704.151152 1081-0706 Google Scholar
A. Peters,
S. L. Palay, and
H. Webster, deF, the Fine Structure of the Nervous System, 3rd ed.Oxford University Press, Oxford, UK (1991). Google Scholar
M. Fricker,
M. Hollinshead,
N. White, and
D. Vaux,
“Interphase nuclei of many mammalian cell types contain deep, dynamic, tubular membrane-bound invaginations of the nuclear envelope,”
J. Cell Biol., 136
(3), 531
–544
(1997). https://doi.org/10.1083/jcb.136.3.531 0021-9525 Google Scholar
H. Bading,
D. D. Ginty, and
M. E. Greenberg,
“Regulation of gene expression in hippocampal neurons by distinct calcium signaling pathways,”
Science, 260 181
–186
(1993). https://doi.org/10.1126/science.8097060 0036-8075 Google Scholar
A. E. West,
E. C. Griffith, and
M. E. Greenberg,
“Regulation of transcription factors by neuronal activity,”
Nat. Rev. Neurosci., 3 921
–931
(2002). https://doi.org/10.1038/nrn987 1471-003X Google Scholar
G. E. Hardingham,
S. Chawla,
C. M. Johnson, and
H. Bading,
“Distinct functions of nuclear and cytoplasmic calcium in the control of gene expression,”
Nature (London), 385 260
–265
(1997). https://doi.org/10.1038/385260a0 0028-0836 Google Scholar
H. Bading,
“Transcription-dependent neuronal plasticity: The nuclear calcium hypothesis,”
Eur. J. Biochem., 267 5280
–5283
(2000). https://doi.org/10.1046/j.1432-1327.2000.01565.x 0014-2956 Google Scholar
S. Papadia,
P. Stevenson,
N. R. Hardingham,
H. Bading, and
G. E. Hardingham,
“Nuclear calcium and CREB family mediate a late-phase of activity-dependent neuroprotection,”
J. Neurosci., 25 4279
–4287
(2005). https://doi.org/10.1523/JNEUROSCI.5019-04.2005 0270-6474 Google Scholar
K. Limback-Stokin,
E. Korzus,
R. Nagaoka-Yasuda, and
M. Mayford,
“Nuclear calcium/calmodulin regulates memory consolidation,”
J. Neurosci., 24 10858
–10867
(2004). https://doi.org/10.1523/JNEUROSCI.1022-04.2004 0270-6474 Google Scholar
P. J. Broser,
R. Schulte,
A. Roth,
F. Helmchen,
J. Waters,
S. Lang,
B. Sakmann, and
G. Wittum,
“Nonlinear anisotropic diffusion filtering of three-dimensional image data from 2-photon microscopy,”
J. Biomed. Opt., 9
(6), 1253
–1264
(2004). https://doi.org/10.1117/1.1806832 1083-3668 Google Scholar
N. Otsu,
“A threshold selection method from gray-level histograms,”
IEEE Trans. Syst. Man Cybern., 9
(1), 62
–66
(1979). 0018-9472 Google Scholar
P. Perona and
J. Malik,
“Scale-space and edge detection using anisotropic diffusion,”
IEEE Trans. Pattern Anal. Mach. Intell., 12 629
–639
(1990). https://doi.org/10.1109/34.56205 0162-8828 Google Scholar
J. Weickert, Anisotropic Diffusion in Image Processing, B.G. Teubner, Stuttgart, Germany (1998). Google Scholar
G. Queisser,
“Rekonstruktion und vermessung der geometrie von neuronen-zellkernen,”
Univ. of Heidelberg,
(2005). Google Scholar
R. Malladi and
J. A. Sethian,
“Level set methods for curvature flow, image enhancement, and shape recovery in medical images,”
Viusal. Math., 329
–345 1997). Google Scholar
E. W. Dijkstra,
“A note on two problems in connexion with graphs,”
Numerische Mathematik, 1 269
–271 Mathematical Centre, Amsterdam, The Netherlands (1959). Google Scholar
W. Schroeder,
K. Martin, and
B. Lorensen,
(2002) Google Scholar
J. Astola, Fundamentals of Nonlinear Digital Filtering, CRC Press, Boca Raton, FL (1997). Google Scholar
W. Nolting, Grundkurs: Theoretische Physik, Klassische Mechanik, Band 1, 3rd ed.Zimmermann-Neufang(1989). Google Scholar
F. Lenzen,
“3D-rekonstruktion von DNA-strukturen,”
Univ. at Bonn,
(2001). Google Scholar
R. Schulte,
“Filterung von 3D-neuronenaufnahmen durch nichtlineare anisotrope diffusion,”
Univ. of Heidelberg,
(2003). Google Scholar
E. Fein,
(1998) Google Scholar
P. Bastian,
K. Johannsen,
S. Lang,
S. Nägele,
V. Reichenberger,
C. Wieners, and
G. Wittum,
“Parallel solutions of partial differential equations with adaptive multigrid methods on unstructured grids,”
High Performance-Computing in Science and Engineering, Springer, Berlin (2000). Google Scholar
H. Bading and
M. E. Greenberg,
“Stimulation of protein tyrosine phosphorylation by NMDA receptor activation,”
Science, 253 912
–914
(1991). https://doi.org/10.1126/science.1715095 0036-8075 Google Scholar
|


