|
|
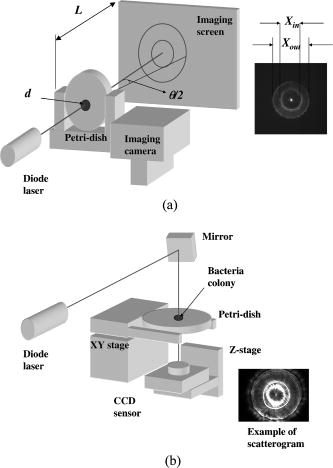
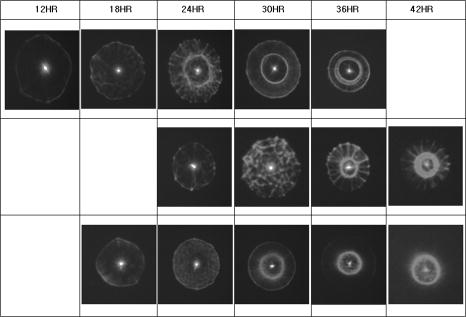
1.IntroductionThe ability to rapidly identify and classify food-borne pathogens is important to the food industry as well as public safety.1, 2 There are various methods for identifying bacteria, including morphological methods, serological methods, proteomics, and genomics. Among these approaches, morphological differences can be exploited if the interrogating agents such as photons are capable of sensing the variation of the micro/macroscopic differences among different species. Optical diagnostics have been widely applied to characterizing and sensing in engineering production and biological fields.3, 4 In the biophotonics area, most of the traditional identification techniques rely on either immunoassay (antibody-antigen reaction) or on spectroscopic methods such as fluorescence.5, 6 These specialized techniques to create differentiation show high specificity, but at the same time require considerable presample preparation or treatment. Alternatively, methods based on elastic light scattering potentially have considerable advantage, since less sample preparation would be required. Some studies exploiting elastic scattering have been published7, 8, 9 and show significant differences in scattering signature among different species that could be used to identify and classify the types of bacteria. These studies,7, 8, 9 however, were focused on testing bacteria in a liquid suspension, either as single bacterial cells or as ensembles. The former face signal-to-noise limitation in practical application, while the latter require some averaging technique in physical modeling. Here we take a different approach that leverages a substantial body of standard laboratory protocol. It starts with individual bacteria, plated on a medium, that divides and can eventually grow into a millimeter-size colony. In the work reported here, we interrogate the colonies with a laser beam of approximately the same diameter as the colony. The laser beam is directed normal to the surface of the growth medium, and the forward-scattered laser light is analyzed. This label-free and agent-free bacterial colony detection method was recently proposed from different points of view. Guo10 and Banada 11 showed that a forward scatterometer is an effective tool to rapidly differentiate the types of bacteria species, such as E. coli, Salmonella enterica, and Listeria species. Bayraktar 12 presented a feature extraction model using Zernike moments to efficiently identify and classify the bacterial species from their respective scatterograms. Bae 13 provided a biophysical modeling of the scatterograms from three types of Listeria species by modeling the bacterial colony as an amplitude/phase modulator. The scattering patterns we observe are closely related to the state of growth, along the characteristic sigmoid curve, of the bacterial colony. Since colonies of different species and strains grow at different rates at different stages of their existence, it is beneficial to investigate the relationship of growth time and scattering pattern. In this work, we performed time-resolved experiments to reveal a correlation between scattering pattern, colony growth time, and the microscopic and macroscopic physical properties of the bacterial colony. Three closely related Listeria species, L. innocua, L. ivanovii, and L. monocytogenes, were selected for the study. Listeria monocytogenes is a food-borne human pathogen with 20% mortality among immunocompromised people. L. innocua is a nonpathogenic species, while L. ivanovii is pathogenic to animals. To enable these experiments, and also to develop a prototype for future diagnostic applications, we redesigned the forward-scattering platform and named it bacteria rapid detection using optical scattering technology (BARDOT).13 Section 2 describes the experimental setups, sample preparation, and types of parameter that are measured. Section 3 describes the time-dependent scattering measurement and its correlated parameters. Last, Section 4 shows the new findings and understanding of bacterial colony scattering. 2.Materials and Methods2.1.System DescriptionThe forward scatterometer consists of a laser source, a sample holder, and an imaging screen. As shown in Fig. 1a , the first version of our instrument10, 11 used a 635-nm diode laser as the light source and a low-resolution digital camera to acquire images. This device revealed the overall characteristics of the scattering patterns but at a lower resolution than is needed. The system was redesigned and constructed as BARDOT,13 shown in Fig. 1b. The new system is equipped with a laser diode module of 635-nm wavelength, an XY stage to move the sample, and a pixel monochromatic IEEE-1394 CCD image sensor to acquire the scattering images. The new system uses a motor-controlled stage system, which reduced the total time of scattering measurement. The sample holder platform was also attached and can hold samples 2 to in diameter, which are the typical size of a Petri dish. The design decision for a monochromatic CCD image sensor was taken to maximize the quantum efficiency, and the -unit pixel size provided higher-resolution images. This new research system also enabled interrogation of near-field and far-field scattering characteristics to facilitate developing accurate physics-based models for the light scattering phenomena. 2.2.Sample Preparation and MethodWhen bacterial cells are incubated on an agar plate, their growth rate and pattern is the well-known sigmoid curve, which shows three phases: lag, exponential, and stationary. Since we are measuring the scattering response from bacterial colonies, it is critical to identify the relationship of colony growth with scattering pattern. Listeria innocua, Listeria monocytogenes, and Listeria ivanovii cultures were selected for our experiments. Each bacterium was grown in brain heart infusion (BHI) broth at for 15 to . Respective dilutions are plated on the surface of BHI agar so as to obtain 30 to 50 colonies per plate and are incubated at . Each species is cultured on six separate BHI agar plates, with half started incubating at zero h, while the other half is started later. Each bacterial colony is numbered, and every , three measurements are performed on one of the plates, with 10 to 15 colonies per plate. The three measurements are the forward scatterometer, BARDOT scattering, and phase contrast microscope images. The forward scatterometer and BARDOT systems reveal complementary scattering characteristics of the colony. The scatterogram from the forward scatterometer is displayed on the screen while the camera captures the image, and the diameters of and are measured using a ruler. For BARDOT, the image is captured using the CCD sensor directly. The phase contrast microscope (LEICA, Model DMLB, Wetzlar, Germany) image is recorded to provide colony diameter and two dimensional (2-D) phase information. The colony diameter is recorded by applying a built-in calibrated measurement function for a objective in the phase contrast microscope. The data from the microscope is used to develop a physical model for the colony morphology that is, in turn, used to inform the modeling of the physics of the scattering pattern formation. 2.3.Modeling Scattering ResponseThe three-dimensional (3-D) vector nature of light propagation can be simplified as 2-D when the dimensions of the diffracting object are larger than the wavelength and the diffracted light is measured far away from the object.14, 15 In addition, when there is a series of amplitude/phase modulation elements such as diffraction gratings or lenses between the object and the imaging plane, the amplitude/phase modulation is mathematically formulated as a kernel in the diffraction equation. These effects are utilized in optical vortices16 and spatial light modulators,17 observed in telescopic optics,18 and analyzed as spatial phase modulation (SPM) in characterizing liquid crystal material.19, 20, 21 We define coordinate systems for source, bacterial colony, and image plane as ; ; and , respectively, as shown in Fig. 2 . Assuming a mode of laser beam centered on the axis with its waist on the location, the electric field on the source plane can be expressed as: where are the points on the source plane, is the wave vector, and is the on-axis field strength. The three bracketed terms account for variations of amplitude of field, longitudinal phase, and radial phase, respectively. The variation of beam waist and radii of the wavefront is expressed as:15 where is defined as the location where the radius has expanded to . When there is a series of physical objects through which an incident beam passes, the wavefront modification is obtained by simply multiplying the amplitude and phase modulation caused by each independent object. We characterize the modulated field on the image plane by considering the transmission of the agar plate, the colony core, and an edge region. Applying the Huygens-Fresnel principle in rectangular coordinates, this can be expressed as:where are points on the image plane, denotes the colony surface, is the 2-D transmission coefficient, is the 2-D phase modulation factor, is the distance from aperture plane to image plane, and is the wavelength. As shown in Fig. 2, is the radius of the curvature of the bacteria colony, is the beam radius, and , and , are the refractive index and thickness of the BHI agar and the Petri dish, respectively. Based on the diffraction theory, assuming its validity criteria14 are met, the diffracted field on the image coordinates can be approximated as:where is the constant outside of the integrals, and are defined as and , is the total phase modulation, which is contributed from the shape (quadratic phase) and internal structure of the colony, assuming that the convex shape of the colony is assumed and expressed as a phase modulation. More detailed derivation of the model and explanation of the parameter is published in an other paper.12Fig. 2Definition of coordinate system and model parameters for the bacterial colony scattering. , and denote the source, aperture, and imaging coordinate system. Inset: denotes the radius of the incident beam; is the curvature of the colony surface; are the refractive indices for the colony, agar, and Petri dish; and are the thickness of the agar and Petri dish.  3.Experimental Results3.1.Forward ScatterogramsFigure 1 provides the definition of the parameters used in the experiment. is the distance between bacterial colonies and the imaging plane, is the bacterial colony diameter, is the maximum half scattering angle of the edge of the scattering pattern, and and are the linear dimensions of the outer most and brighter inner ring pattern. is set to and for the forward scatterometer and BARDOT. Figure 1 also shows the sample image from the measurement. The top image is from the forward scatterometer, and the bottom is from the BARDOT system for Listeria innocua incubated at . A beam diameter is selected to match the size of the colony diameter in the stationary phase of the sigmoid growth curve. When the laser beam is smaller than the bacterial colony, the colony outside of the incident beam does not contribute to the scattering signal even though there exist amplitude/phase modulators. Both images show multiple concentric rings, along with a brighter ring in the middle. The BARDOT image shows the pattern in detail from the same colony with higher resolution. The result of the time-dependent measurement is summarized in Fig. 3 . Figure 3a shows the relationship between the incubation time and the average diameter of the bacterial colony. The three different species showed different rates of growth. Listeria innocua was distinguishable to the human eye and reached a diameter of approximately . This species showed scattering patterns as early as and reached the stationary phase after about . Listeria monocytogenes, which grew slower than Listeria innocua, started to show scattering patterns around and reached the stationary phase around . Listeria ivanovii forward scattering was visible around , and their stationary phase was reached after . Statistical results of the measurement are summarized in Table 1 with the mean and standard deviation of bacterial colony diameter and maximum half scattering angle. Fig. 3Result of time-dependent scattering measurement for three types of Listeria species: Listeria innocua, L. ivanovii, and L. monocytogenes: (a) incubation time versus colony diameter; (b) incubation time versus scatterogram diameter.  Table 1Statistical parameters for the time-dependent measurement of three Listeria species.
μ,σ
are the mean and standard deviations of 15 samples/plate. Figure 3b shows the relationship of incubation time versus linear dimension of the scatterogram. We can see that for all three Listeria species: (1) there is a growth time and colony diameter that creates the maximum scattering angle, and (2) the inner bright ring starts to appear after a certain incubation time. The maximum outer diameter increases and hits a peak value at for Listeria innocua and at for Listeria ivanovii and Listeria monocytogenes. After that, the dimension of the scatterogram tends to decrease with its half scattering angle of 4 to . The inner bright rings appear after for Listeria innocua and for Listeria ivanovii and Listeria monocytogenes. Therefore, considering both the time and the differentiability, a map of incubation time versus the scattering pattern could be summarized for the three Listeria species, as shown in Fig. 4 . The top, middle, and bottom rows show the scatterogram variations for Listeria innocua, Listeria monocytogenes, and Listeria ivanovii. This map provides an overall picture of the dependence of scatterogram properties versus growth time, which can provide the characteristic pattern for individual bacterial species or provide the experimental protocol for incubation time. To provide minimal variation in the scatterogram for the current instrument setup, we use an incubation time for which the specific species are in the stationary phase, which is for Listeria innocua and Listeria ivanovii and for Listeria monocytogenes. 3.2.Phase Contrast MicroscopeAccording to Fig. 4, scatterograms show distinctive patterns for different species. For example, a 30-h grown Listeria ivanovii colony shows a speckle effect around the center of the scatterogram, while Listeria monocytogenes displays radial spoke features. Although these features are possible candidates for automated image analysis, the biophysical characteristics that cause the distinctive scattering patterns are of most interest here. Figure 5a shows the phase contrast microscope image taken for Listeria ivanovii at . This image provides the measured diameter of the bacterial colony and information about the mechanism of formation of the speckle cells, which are circular features 50 to in diameter. These circular speckle features are not observed in early hours of incubation but started to appear in the 30-h samples. Figure 5b shows the same result for Listeria monocytogenes for of incubation. This species also shows circumferential or arc-shaped features that are not observed in any other species. 4.DiscussionThe time-dependent scattering experiment produced valuable results that could provide the origin of the difference of the scattering along with the degree of variation of the scatterogram. The two characteristics observed from Fig. 4 can be explained as follows. We postulate that the first effect is caused by the relationship between fixed laser spot size, the varying colony diameter, and the spatial variations of the density of the bacteria and of the intercellular material excreted during the growth process. When the colony diameter exceeds the laser spot diameter, additional growth of the outer colony has no effect on scattering pattern. However, we observe a decrease in the scattering pattern diameter, which suggests that some physical aspects of the colony continue to change. But in the stationary phases, the size of the scattering pattern varies, while the scattering pattern itself stays relatively similar compared to the exponential phase where the colony is growing rapidly. The second observation is explained similarly. starts to appear after a certain growth time, which suggests some variation in the optical properties of the colony creating the bright ring. One possible explanation is that as bacteria are accumulated in the central core of the colony, the transmission of the incident light will decrease. The bacteria in the center are possibly dead or dying and attenuate the light (through scattering or absorption), thereby reducing the amount of light transmitted through the center, i.e., a “hole” is created in the center part of the transmitted laser beam. This phenomenon is similar to blocking the center part of a circular laser beam with a stop, which creates a circularly symmetric knife edge pattern along the circumference.22 Close investigation of the variation of the scatterograms in Fig. 4 shows similar characteristics between Listeria innocua at and Listeria monocytogenes at 36 and . First, these two figures are clearly similar to the human observer and suggest that a quantitative method to discriminate and classify the scatterogram would be feasible. Second, the radial spoke features in Listeria innocua scattering patterns occur during the log phase and disappear after of incubation, while Listeria monocytogenes is in the stationary phase on the growth curve and appears until of incubation. This result provides a rationale for including an additional time parameter in the discrimination and classification process that will increase the differentiability among species. Another interesting point is that Listeria ivanovii is the least transmissive of the three species. At 36 and , Listeria ivanovii starts to disappear, while for the other two species it remains visible. To explain in more detail, we have sorted the data in Fig. 3b for each species such that the relationship of bacterial colony diameter and maximum half scattering angle is revealed. Fig. 6a shows the sorted data ascending by bacterial colony diameter. Three different growth regions are shown. The first region is up to colony diameter of , where the scatterogram diameter is proportional to bacterial colony diameter. When incident light is passed through the aperture, angular distribution of the pattern is inversely proportional to the diameter of the aperture. However, the bacterial colony is more close to a circular stop, since the agar shows 90% transmission with no phase modulation while the bacterial colony shows radial amplitude and phase modulation from Eq. 4. A similar effect is observed in the analysis of the SPM of the nematic liquid crystal film.19, 20, 21 Given a constant film thickness of the liquid crystal film, the result indicates that interference is generated by the phase difference caused by the difference in spatial intensity of the Gaussian incident beam that modulates the nonlinear phase relationship. When the modulated wavefront shows the same gradient from a different spatial location, the scattered light has same wave vector and creates an interference pattern at the far-field. The maximum scattering angle is determined by the maximum absolute value of the gradient of the wavefront right after the light passes the film. While the liquid crystal film has constant film thickness with different phase modulation, the bacterial colony has a dome-shaped colony profile that can produce the same effect because the phase modulation is the multiplication of path length and refractive index. Fig. 6Scattering pattern and phase-contrast microscope image for Listeria innocua that are grown : (a) colony diameter versus scatterogram diameter; (b) four samples of colony scatterogram and corresponding phase-contrast microscope image.  The second region is up to colony diameter of , where there is some random variation in scatterogram sizes. To explain this, we have selected four data points and closely observed the phase contrast images. Figure 6b shows the scatterogram and corresponding phase contrast microscope image for Listeria innocua at . The image pair numbered (1) and (2) showed 6.84 and , while (3) and (4) showed 9.28 and of maximum half scattering angles. Even though the colony diameter is similar, the difference in modulation and the gradient of the wavefront can change the maximum scattering angle, which may be caused by the variation in refractive index, thickness, or volume concentration, etc. The third region is where colony diameter exceeds , which is closely related to the fixed incident beam diameter. The current experiment employs a diode laser with diameter. Therefore, additional growth of the bacterial colony that exceeds this region will not be sensed by the incident photons, and other macroscopic parameters such as curvature can affect the extent of the scatterogram. Similar results are found for Listeria ivanovii and Listeria monocytogenes, as shown in Fig. 7 . We applied the previous equation with its individual amplitude and phase modulation terms, as shown in Fig. 8 . The amplitude modulation is modeled as the multiplication of the transmission coefficient and the Gaussian beam profile, while the phase modulation is modeled in terms of a convex surface profile.13, 14 The left figure shows the scattering pattern from Listeria ivanovii at . The BARDOT system revealed more detail in the scatteringpattern compared to forward scatterometer images. For example, Fig. 8a shows another bright ring at the center. According to the physical model of Eq. 1, the innermost bright ring, which measures about , originated from the nondeviated portion of the incident beam, which is incident on the bare agar area. The brighter ring, which measures about , is the dimension of the , which starts to appear after . As shown in Fig. 8b, the random speckle effect originates from a circular phase object that we modeled with 50 circles of 20 to diameter. The phase value was randomly set between to . 5.ConclusionTime-resolved forward-scattering experiments were performed on colonies of three species of bacteria: Listeria innocua, Listeria monocytogenes, and Listeria ivanovii. The samples were incubated up to on BHI agar, and two scattering patterns and a phase contrast microscope image were recorded. The scattering patterns varied as a function of growth time, and were related to the fixed beam diameter, bacterial colony diameter, and the spatial distribution of optical amplitude and phase properties across the colonies. The phase contrast microscope images showed distinctive features for different species that were also incorporated in the modeling of the scattering response from the colony. A relationship of scatterogram variation versus growth time was discovered and reported here, which provides the overall picture of scatterogram variation against the growth phase of the bacterial colony. The results and resulting understanding of the relevant biophysical processes provided the basis for a laboratory protocol for the scattering experiments and for differentiating Listeria species. AcknowledgmentsThis research was supported through a cooperative agreement with the Agricultural Research Service of the US Department of Agriculture Project No. 1935-42000-035 and the Center for Food Safety and Engineering at Purdue University. ReferencesG. D. Curtis,
R. G. Mitchell,
A. F. King, and
E. J. Griffin,
“A selective medium for the isolation of Listeria monocytogenes,”
Lett. Appl. Microbiol., 8 85
–98
(1989). 0266-8254 Google Scholar
A. D. Hitchins, Food and Drug Administration Bacteriological Analytical Manual, AOAC International, Gaitherburg, MD (1998). Google Scholar
R. Schmehl,
B. M. Nebeker, and
E. D. Hirleman,
“The coupled-dipole method for scattering by particles on surfaces using a two-dimensional fast Fourier transform technique,”
J. Opt. Soc. Am. A, 14 3026
–3036
(1997). 0740-3232 Google Scholar
P. J. Wyatt,
“Differential light scattering: a physical method for identifying living bacterial cells,”
Appl. Opt., 7
(10), 1879
–1896
(1968). 0003-6935 Google Scholar
J. D. Andrade,
R. A. Vanwagenen,
D. E. Gregonis,
K. Newby, and
J. N. Lin,
“Remote fiber-optics biosensors based on evanescent-exited fluoro-immunoassay: concept and progress,”
IEEE Trans. Electron Devices, 32
(7), 1175
–1179
(1985). 0018-9383 Google Scholar
Y. L. Pan,
S. Holler,
R. K. Chang,
S. C. Hill,
R. G. Pinnick,
S. Niles,
J. R. Bottiger, and
B. V. Bronk,
“Real-time detection and characterization of individual flowing airborne biological particles: fluorescence spectra and elastic scattering measurements,”
Proc. SPIE, 3855 117
–125
(1999). https://doi.org/10.1117/12.371270 0277-786X Google Scholar
P. H. Kaye,
E. Hirst,
J. M. Clark, and
F. Micheli,
“Airborne particle shape and size classification from spatial scattering profiles,”
J. Aerosol Sci., 23
(6), 597
–611
(1992). https://doi.org/10.1016/0021-8502(92)90027-S 0021-8502 Google Scholar
S. Holler,
Y. Pan,
J. R. Bottiger,
S. C. Hill,
D. B. Hillis, and
R. K. Chang,
“Two-dimensional angular scattering measurements of single airborne micro-particles,”
Proc. SPIE, 3533 64
–72
(1998). https://doi.org/10.1117/12.336844 0277-786X Google Scholar
B. Bronk,
S. D. Druger,
J. Crégé, and
W. P. Van De Merwe,
“Measuring diameters of rod-shaped bacteria in vivo with polarized light scattering,”
Biophys. J., 69 1170
–1177
(1995). 0006-3495 Google Scholar
S. Guo,
“Optical scattering for bacteria colony detection and characterization,”
School of Mechanical Engineering,
(2004). Google Scholar
P. P. Banada,
S. Guo,
B. Bayraktar,
E. Bae,
B. Rajwa,
J. P. Robinson,
E. D. Hirleman, and
A. K. Bhunia,
“Optical forward scattering for colony identification and differentiation of Listeria species,”
Biosens. Bioelectron., 22 1664
–1671
(2007). https://doi.org/10.1016/j.bios.2006.07.028 0956-5663 Google Scholar
B. Bayraktar,
P. P. Banada,
E. D. Hirleman,
A. K. Bhunia, and
J. P. Robinson,
“Feature extraction from light-scatter patterns of Listeria colonies for identification and classification,”
J. Biomed. Opt., 11 034006
(2006). https://doi.org/10.1117/1.2203987 1083-3668 Google Scholar
E. Bae,
P. P. Banada,
K. Huff,
A. K. Bhunia,
J. P. Robinson, and
E. D. Hirleman,
“Biophysical modeling of forward scattering from bacterial colonies using scalar diffraction theory,”
Appl. Opt., 40 3639
–3648
(2007). https://doi.org/10.1364/AO.46.003639 0003-6935 Google Scholar
J. W. Goodman, Introduction to Fourier Optics, 2nd ed.McGraw-Hill, Boston (1996). Google Scholar
J. T. Verdeyen, Laser Electronics, Prentice Hall, Englewood Cliffs, NJ (1995). Google Scholar
C. S. Guo,
X. Liu,
J. L. He, and
H. T. Wang,
“Optimal annulus structure of optical vortices,”
Opt. Express, 12 4625
–4634
(2004). https://doi.org/10.1364/OPEX.12.004625 1094-4087 Google Scholar
M. A. A. Neil and
E. G. S. Paige,
“Improved transmission in a two-level, phase-only, spatial light modulator,”
Electron. Lett., 30 445
–446
(1994). https://doi.org/10.1049/el:19940266 0013-5194 Google Scholar
H. R. Suiter, Star Testing Astronomical Telescopes,
(2003) Google Scholar
S. D. Durbin,
S. M. Arakelian, and
Y. R. Shen,
“Laser-induced diffraction rings from a nematic-liquid-crystal film,”
Opt. Lett., 6 411
–413
(1981). 0146-9592 Google Scholar
I. C. Khoo,
J. Y. Hou,
T. H. Liu,
P. Y. Yan,
R. R. Michael, and
G. M. Finn,
“Transverse self-phase modulation and bistability in the transmission of a laser beam through a nonlinear thin film,”
J. Opt. Soc. Am. B, 4 886
–891
(1987). 0740-3224 Google Scholar
K. Ogusu,
Y. Kothani, and
H. Shao,
“Laser-induced diffraction rings from an absorbing solution,”
Opt. Rev., 3 232
–234
(1996). https://doi.org/10.1007/s10043-996-0232-1 1340-6000 Google Scholar
E. Hecht, Optics, 4th ed.Addison-Wesley, Boston (2002). Google Scholar
|
||||||||||||||||||||||||||||||||||||||||||||||||||||||||||||||||||||||||||||||||||||||||||||||||||||||||||||||