
|
|
1.IntroductionMelanin is the characteristic chromophore of human skin with various potential biological functions, which include protection from solar radiation,1, 2 antioxidant defense, and camouflage.3 Melanin is also involved in skin diseases such as malignant melanoma, an aggressive skin cancer with high metastatic potential. Despite its importance, melanin is poorly understood because it is an insoluble polymer without well-defined structure, which is difficult to isolate and study.4 Skin melanin is divided into two basic types: the black-brown eumelanin and the red–yellow pheomelanin. Both types are biopolymers synthesized in vivo starting with the enzymatic oxidation of tyrosine that leads, through intermediate steps, to eumelanin, composed of dihydroxyindoles (DHI 5,6-dihydroxyindole and DHICA 5,6-dihydroxyindole-2-carboxylic acid), and pheomelanin, composed of benzothiazine intermediates5 [Fig. 1a ]. Attempts to elucidate its structure are hampered by the lack of effective physicochemical methods because, in contrast to other biopolymers such as proteins and nucleic acids, melanin resists chemical analysis mainly due to the strong nonhydrolyzable carbon-carbon bonds linking its monomers.4 Fig. 1(a) Eumelanin is a polymer of 5,6-dihydroxyindole (DHI) and 5,6-dihydroxyindole-2-carboxylic acid (DHICA), while pheomelanin is a polymer of benzothiazine intermediates (wavy lines indicate bonding sites for polymerization). For both melanin types, the detailed polymer structure is undetermined. (b) The proposed structure of melanin protomolecules consists of tetramers arranged so that they form an inner ring resembling the structure of porphyrin. The variability in protomolecule structure is due to the presence or absence of H atoms bonded to the three non-C atoms in each monomer (the N atom in the pentagonal ring and the two O atoms attached to the hexagonal ring).  Detailed investigation of melanin is crucial for the assessment of skin color as well as for the study of various pathological conditions associated with it, such as albinism, vitiligo, melasma, lentigo, and melanoma. Of high importance and interest, in particular, is the investigation of melanoma along with its potential precursors, which may include congenital melanocytic nevi (common skin moles) and dysplastic or atypical nevi. In light of reports of altered melanin production in melanoma and dysplastic nevi,6 the characterization and detection of melanocytic lesions through the study of melanin is even more crucial. One way to assess melanin in vivo noninvasively is through the study of its optical properties. The in vitro spectral absorption characteristics of melanin have been extensively studied for various types of melanin, such as synthetic melanin produced by oxidation of tyrosine, melanin from Sepia officinalis, and melanin extracted from human and animal skin and hair by employing various chemical processing methods.7, 8 In contrast to the abundance of in vitro data, there is a scarcity of data on the in vivo optical properties of melanin. The absorption spectrum of melanin has been previously investigated in vivo using diffuse reflectance spectroscopy by using empirical methods for data analysis.9, 10 The results from these studies provide important qualitative information regarding the melanin absorption properties in its native environment, but the empirical nature of data analysis calls for a more extensive study. We provide here a more detailed quantitative study of the in vivo melanin absorption properties through the use of diffuse reflectance spectroscopy. The data are analyzed by means of an analytical diffuse reflectance model, which provides direct information about the optical properties of skin chromophores as well as about the light scattering properties of skin.11 We have used the model for the assessment of melanin in cutaneous melanoma and skin nevi in human subjects, and we present results both from analysis of our own clinical data as well as from analysis of previously published data, demonstrating intrinsic differences in the optical properties of melanin present in the skin lesions studied. 2.Methods2.1.InstrumentationThe experimental setup has been described in more detail elsewhere.11 Briefly, we use a charge-coupled device (CCD) spectrophotometer (Ocean Optics, USB2000) with illumination provided by a tungsten-halogen light source (Ocean Optics, HL-2000). For light delivery, we use a fiber optic probe consisting of six concentrically arranged core optical fibers, and for diffuse reflectance collection a single core central optical fiber (Ocean Optics, R200-7). Calibration was performed on a diffuse reflectance calibration standard (Ocean Optics, WS-1). Data were collected in the 460- to 1000-nm range with resolution. Signal-to-noise ratio was typically greater than 100:1 and integration time was typically . 2.2.Theoretical ModelThe theoretical model used has been described in detail elsewhere.12 The melanin protomolecules are taken to be tetramers composed of DHI, its redox form indolequinone (IQ), and two tautomers, quinone-methide and quinone-imine (QM, QI). The differences between these molecules consist of the non-C atoms (the N atom in the pentagonal ring and the two O atoms attached to the hexagonal ring) having an H atom bonded to them or not. Specifically, DHI has three H atoms bonded to all of the non-C sites; IQ has only one H atom bonded to the N atom; and QM and QI have only one H atom bonded to one of the two O atoms. The generic structure of the tetramer model is shown in Fig. 1b, and involves the formation of an inner ring that resembles the structure of porphyrin. The chemical variability of the tetramer structure is the result of a random combination of DHI, IQ, QM, and QI as its constituents. In calculating the optical absorption spectrum of melanin, a total of 16 different tetramer structures were considered. For the simulation of the structure and the calculation of the optical absorption spectrum of melanin protomolecules, we used the time-dependent density functional theory (TDDFT),13 an established theoretical methodology that has been proven to give reliable results for finite-size systems, especially for biomolecules.14 TDDFT can be viewed as an exact reformulation of time-dependent quantum mechanics, where the fundamental variable is no longer the many-body wave function but the density. This allows the derivation of a calculational scheme in which the effect of the many-body particle-particle interactions is represented by a density-dependent single-particle potential, so that the time evolution of an interacting system can be studied by solving a time-dependent auxiliary single-particle problem. In our approach, we use a basis of localized, atomic-like orbitals to represent the electronic wave functions as implemented in the SIESTA code,15 and propagate the electronic wave functions in time to obtain the absorption spectrum from the time evolution of the dipole moment.16 Technical details of the melanin absorption spectrum calculations are the same as in our previous work.12, 14 2.3.Diffuse Reflectance ModelAssuming skin to be a homogeneous semi-infinite medium, the diffuse reflectance is given11 by: where and are the absorption and reduced scattering coefficients of skin, and and are constants that depend on the probe geometry.11 The optical coefficients and are related to the absorption and scattering properties of skin through Eqs. 2, 3 11, 17: Here, is the hemoglobin concentration, is the hemoglobin oxygen saturation , is the melanin concentration, is the water concentration, is the absorption coefficient of water,18 and is a parameter related to the effective scatterer size.17 and are the absorption coefficients of oxyhemoglobin and deoxyhemoglobin,19 and the remaining parameters are , , and .11 The melanin absorption spectrum in Eq. 2 is described by an exponential dependence on wavelength, with the corresponding exponential decay constant. The exponential is normalized to unity at and it is measured in the same units as the absorption coefficients of the remaining chromophores in Eq. 2. Equation 1 is valid for diffuse reflectance measured with an optical fiber probe. When an integrating sphere is used for collection, the appropriate expression for the total diffuse reflectance becomeswith and .11 The values of and were obtained using a calibration procedure on a tissue phantom as explained in Ref. 11. Data analysis was performed by fitting the experimental spectra to the model described by Eq. 1 with the absorption and reduced scattering coefficients described by Eqs. 2, 3. Thus, fitting produced a set of seven parameters characteristic for each skin spectrum: , , , , and . Fitting was performed using the Levenberg-Marquardt minimization method offered by the MERLIN optimization environment.20 In addition to automated fitting, a chi-square analysis was conducted by manually varying the fit parameters and evaluating the corresponding goodness of fit. In all cases, this search showed that the optimization software identified the global minimum that yielded the best agreement between the experimental data and the model. This observation is consistent with what one would expect by inspecting Eqs. 2, 3. The spectral line shapes for hemoglobin, melanin, water, and the reduced scattering coefficient are distinct enough such that a unique fit of the data to the model can be achieved.2.4.In Vivo DataDiffuse reflectance spectra were measured on six human subjects with dysplastic nevi, one human subject with melanoma in situ and three human subjects with malignant melanoma. Data were collected at the Dermatology and Venereal Diseases Clinic of University Hospital, Ioannina, Greece, with informed subject content. The human subjects had Fitzpatrick skin type III. Data were collected by gently placing the probe on the skin with no pressure applied. 3.ResultsThe melanin absorption spectrum has been extensively studied experimentally by many research groups. Table 1 summarizes data available in the literature, mostly referring to in vitro studies. The most striking feature of the melanin spectra is the degree to which they exhibit a universal exponential dependence on wavelength, despite the wide variety of different melanin samples studied. For the data shown in Table 1, the exponential decay constant takes values in the 1.2 to 5.5 range. The variation in is noteworthy and is probably an indication of a heterogeneous polymer structure. In addition, melanin absorption appears to depend on factors such as melanin type, molecular weight, method of extraction from skin or hair, and bleaching. The observation that bleaching of melanin with hydrogen peroxide does not remove the exponential dependence but merely increases is also very interesting.21 Most of the data presented in Table 1 concern eumelanin. Data available for pheomelanin are scarce and are generally characterized by higher values, a fact consistent with the expected characteristic reddish color of pheomelanin. The in vivo data for melanin are also limited, and values are in general agreement with those for synthetic eumelanin, even though in vivo melanin is expected to be composed of both eumelanin and pheomelanin.22 Table 1Literature review data for melanin absorption.
In Fig. 2 we show the calculated optical absorption spectra of the 16 individual tetramers and their average, using our theoretical model. In the inset of Fig. 2, we show representative absorption spectra of eumelanin and pheomelanin, reported in the literature (and included in Table 1), together with fits to an exponential function. Also in the inset, we show the average theoretical spectrum (top blue line). The agreement between theory and experiment for the key feature of the spectrum, the exponential decay, is excellent. Fig. 2Theoretical results for absorbance (in arbitrary units) of the 16 eumelanin tetramer protomolecules (thin red lines) and their average (thick black line). Inset: typical in vitro absorption spectra of eumelanin and pheomelanin on a log-normal plot, from Refs. 31, 39, respectively; black lines represent experimental data, red lines correspond to the exponential fits; the top blue line corresponds to the theoretical result shown by the thick black line on the large plot . 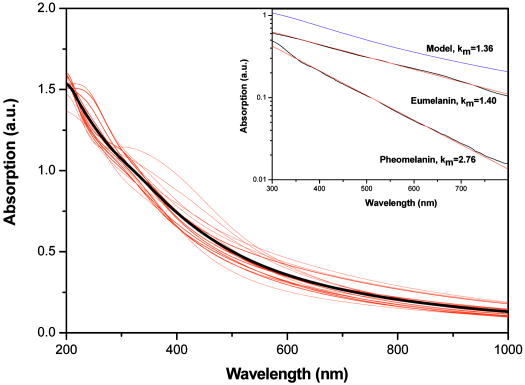 Analysis of diffuse reflectance spectra provides more detailed information about the absorption of melanin in vivo. Figure 3a shows average spectra from malignant melanoma, melanoma in situ, and dysplastic nevi, together with model fits [see Eq. 1 in Methods in Sec. 2]. The model describes the spectra remarkably well, which confirms the exponential nature of melanin absorption in vivo. Besides our own data, we have also analyzed average diffuse reflectance spectra from three similar independent, previously published studies. Table 2 summarizes the number of cases for the different skin lesions studied for each study. Two of these studies employed an optical fiber probe for data collection,23, 24 in which case diffuse reflectance is described by Eq. 1 [see Figs. 3b and 3c], while the third25 employed an integrating sphere, in which case diffuse reflectance is described by Eq. 4 [see Fig. 3d]. In all three cases, we obtained excellent fits to the model, which yielded corresponding values for the melanin absorption spectrum. Fig. 3Average diffuse reflectance spectra (black lines) from malignant melanoma (MM), melanoma in situ (MS), dysplastic nevi (DN), and benign congenital nevi (BN), along with the corresponding model fits (red lines). (a) This study, (b) Murphy, 23 (c) Wallace 24 and (d) Marchesini 25 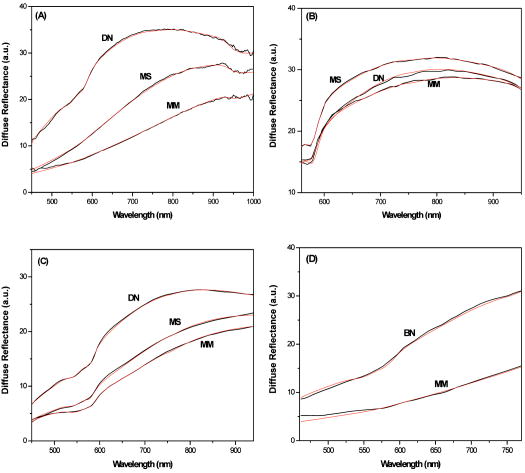 Table 2Number of cases, for each skin lesion type, for each study. Figure 4 summarizes the values obtained from all four studies and illustrates the clear and consistent differences observed among the different skin lesions. In all studies, melanoma is characterized by consistently lower values compared to skin nevi, while values for melanomas in situ fall between the melanoma and nevi values. This is an indication that intrinsic changes associated with the histological transition are reflected in the optical absorption spectrum of melanin. A detailed analysis of the model fits revealed that the typical uncertainty in determining is approximately . The remaining parameters, obtained by fitting the data to the model, did not exhibit any specific correlation with , and hence are not presented here in further detail.4.DiscussionOur key findings concerning the melanin absorption spectrum are as follows.
Our results are also promising for the better understanding of melanin structure and function, especially in vivo. The key concept in our analysis is the utilization of the exponential shape of the melanin absorption spectrum, which facilitates the analysis of diffuse reflectance spectra and the characterization of melanin spectra using a single parameter. The origin of this universal exponential dependence is not well understood, but there is evidence relating it to the highly disordered and heterogeneous nature of the melanin polymer structure.12, 26, 27 This last argument is further supported by the fact that different types of melanins, melanins with different molecular weights and even bleached melanins, all exhibit the exponential dependence in their absorption spectrum. The differences found in the optical properties of melanin between melanoma and dysplastic nevi present an opportunity for developing further insight. A possible explanation may be related to increased pheomelanin content in dysplastic nevi,6 which would yield higher values. Eumelanin composition may offer an alternative explanation. In particular, DHI-rich melanin is characterized by a dark brown to black color, while DHICA-rich melanin is characterized by a lighter brown color.28 Accordingly, DHI-rich melanin would yield lower values. Other possible explanations may include differences in the actual molecular weight of the melanin polymer8 and possible contributions from scattering effects, although these are generally considered small.29 The structure of melanin may also be affected in vivo by interactions with melanosome proteins.30 Finally, other undetermined factors related to the melanosome microenvironment may be involved. An important lesson from our analysis is the feasibility of studying melanin in vivo, in its natural environment. As is the case for many other biochemical compounds, melanin does not appear to be exactly the same polymer in vivo and in vitro. Inspection of Table 1 reveals that melanin is probably altered by the chemical processing involved in extracting it from skin or hair. This is evident by the different values corresponding to different extraction methods.8 Also, synthetic melanin may be intrinsically different due to the very nature of the “artificial” way of producing it—the very low values reported for some synthetic melanins seem unrealistic for in vivo melanin, based on our analysis. This last argument appears valid for both eumelanin and pheomelanin. In the case of eumelanin, a possible explanation could be related to the fact that synthetic eumelanin is generally richer in DHI.5 In the case of pheomelanin, the uncertainties appear even greater, since it is generally less well studied and characterized than eumelanin. It is important to stress that the present analysis has inherent limitations, especially in what concerns the analysis of data from previously published studies. More accurate values of for each skin type and skin lesion can be determined only by fine tuning the model to the specific experimental setup and by analyzing individual (rather than average) reflectance spectra, a goal beyond the scope of the present work. The central point of Fig. 4 is the fact that the relative differences in values among different skin lesion types within each study are evidently significant and consistent (in fact, they are approximately the same) across all four studies analyzed. An important point we also need to stress is the fact that the reported differences in can be actually confirmed, on a qualitative basis, by a simple visual inspection of the spectra. Consider Figs. 3a and 3c, which best illustrate the point: in the NIR region, the intensity of the dysplastic nevi spectra slightly increases, then begins to fall rapidly as the wavelength becomes shorter. In contrast, the melanoma spectra intensity decreases steadily as the wavelength becomes shorter. This behavior can only be explained in terms of melanin absorption, with lower for melanoma, i.e., increased melanin absorption in the NIR region. This observation was actually the starting point of this work and the model just puts this qualitative observation in quantitative form. Most importantly, the results of this study are model independent, as they should be, and they can also be obtained using the diffusion-theory model described elsewhere.17 Another source of uncertainty is related to biological variability; we have used a limited set of data in our study, but the results are in reasonable agreement with the published average spectra reported by the three other studies that used a wider dataset (a total of 156 cases). We expect our on-going clinical study to provide more conclusive and statistically significant results in the future. This will eventually permit us to quantify the sensitivity and specificity of this method for diagnosing melanoma, melanoma in situ, and dysplastic nevi. Nevertheless, we believe that the findings presented here constitute a solid basis for noninvasive monitoring and screening of pigmented skin lesions, and for a deeper understanding of the biological function of melanin. AcknowledgmentsThis work was cofunded by the European Union in the framework of the program “Pythagoras II” of the “Operational Program for Education and Initial Vocational Training” of the Third Community Support Framework of the Hellenic Ministry of Education, funded 25% from national sources and 75% from the European Social Fund (ESF). ReferencesN. Kollias,
R. M. Sayre,
L. Zeise, and
M. R. Chedekel,
“Photoprotection by melanin,”
J. Photochem. Photobiol. B, 9 135
–160
(1991). https://doi.org/10.1016/1011-1344(91)80147-A 1011-1344 Google Scholar
J. P. Ortonne,
“Photoprotective properties of skin melanin,”
Br. J. Dermatol., 146 7
–10
(2002). https://doi.org/10.1046/j.1365-2133.146.s61.3.x 0007-0963 Google Scholar
H. Z. Hill,
“The function of melanin or 6 blind people examine an elephant,”
BioEssays, 14 49
–56
(1992). https://doi.org/10.1002/bies.950140111 0265-9247 Google Scholar
J. D. Simon and
S. Ito,
“The chemical structure of melanin,”
Pigment Cell Res., 17 423
–424
(2004). 0893-5785 Google Scholar
S. Ito,
“A chemist’s view of melanogenesis,”
Pigment Cell Res., 16 230
–236
(2003). 0893-5785 Google Scholar
S. Pavel,
F. van Nieuwpoort,
H. van der Meulen,
C. Out,
K. Prizinger,
P. Cetkovska,
N. P. M. Smit, and
H. K. Koerten,
“Disturbed melanin synthesis and chronic oxidative stress in dysplastic naevi,”
Eur. J. Cancer, 40 1423
–1430
(2004). https://doi.org/10.1016/j.ejca.2003.11.035 0959-8049 Google Scholar
I. A. Menon,
S. Persad,
H. F. Haberman, and
C. J. Kurian,
“A comparative study of the physical and chemical properties of melanins isolated from human black and red hair,”
J. Invest. Dermatol., 80 202
–206
(1983). https://doi.org/10.1111/1523-1747.ep12534045 0022-202X Google Scholar
Y. Liu,
V. R. Kempf,
J. B. Nofsinger,
E. E. Weinert,
M. Rudnicki,
K. Wakamatsu,
S. Ito, and
J. D. Simon,
“Comparison of the structural and physical properties of human hair eumelanin following enzymatic or acid/base extraction,”
Pigment Cell Res., 16 355
–365
(2003). 0893-5785 Google Scholar
N. Kollias and
A. Baqer,
“Spectroscopic characteristics of human melanin in vivo,”
J. Invest. Dermatol., 85 38
–42
(1985). https://doi.org/10.1111/1523-1747.ep12275011 0022-202X Google Scholar
N. Kollias,
“The spectroscopy of human melanin pigmentation,”
Melanin: Its Role in Human Photoprotection, Valdenmar Publishing, Overland Park, KS (1995). Google Scholar
G. Zonios and
A. Dimou,
“Modeling diffuse reflectance from semi-infinite turbid media: application to the study of skin optical properties,”
Opt. Express, 14 8661
–8674
(2006). https://doi.org/10.1364/OE.14.008661 1094-4087 Google Scholar
E. Kaxiras,
A. Tsolakidis,
G. Zonios, and
S. Meng,
“Structural model of eumelanin,”
Phys. Rev. Lett., 97 218102
(2006). https://doi.org/10.1103/PhysRevLett.97.218102 0031-9007 Google Scholar
E. Runge and
E. K. U. Gross,
“Density-functional theory for time-dependent systems,”
Phys. Rev. Lett., 52 997
–1000
(1984). https://doi.org/10.1103/PhysRevLett.52.997 0031-9007 Google Scholar
A. Tsolakidis and
E. Kaxiras,
“A TDDFT study of the optical response of DNA bases, base pairs, and their tautomers in the gas phase,”
J. Phys. Chem. A, 109 2373
–2380
(2005). https://doi.org/10.1021/jp044729w 1089-5639 Google Scholar
D. Sanchez-Portal,
P. Ordejon,
E. Artacho, and
J. M. Soler,
“Density-functional method for very large systems with LCAO basis sets,”
Int. J. Quantum Chem., 65 453
–461
(1997). https://doi.org/10.1002/(SICI)1097-461X(1997)65:5<453::AID-QUA9>3.0.CO;2-V 0020-7608 Google Scholar
A. Tsolakidis,
D. Sanchez-Portal, and
R. M. Martin,
“Calculation of the optical response of atomic clusters using time-dependent density functional theory and local orbitals,”
Phys. Rev. B, 66 235416
(2002). https://doi.org/10.1103/PhysRevB.66.235416 0163-1829 Google Scholar
G. Zonios,
J. Bykowski, and
N. Kollias,
“Skin melanin, hemoglobin, and light scattering properties can be quantitatively assessed in vivo using diffuse reflectance spectroscopy,”
J. Invest. Dermatol., 117 1452
–1457
(2001). https://doi.org/10.1046/j.0022-202x.2001.01577.x 0022-202X Google Scholar
G. M. Hale and
M. R. Querry,
“Optical-constants of water in the to wavelength region,”
Appl. Opt., 12 555
–563
(1973). https://doi.org/10.1007/BF00934777 0003-6935 Google Scholar
O. W. van Assendelft, Spectrophotometry of Haemoglobin Derivatives, CC Thomas, Springfield, IL (1970). Google Scholar
D. G. Papageorgiou,
I. N. Demetropoulos, and
I. E. Lagaris,
“MERLIN-3.0—A multidimensional optimization environment,”
Comput. Phys. Commun., 109 227
–249
(1998). https://doi.org/10.1016/S0010-4655(98)00005-8 0010-4655 Google Scholar
K. C. Littrell,
J. M. Gallas,
G. W. Zajac, and
P. Thiyagarajan,
“Structural studies of bleached melanin by synchrotron small-angle X-ray scattering,”
Photochem. Photobiol., 77 115
–120
(2003). https://doi.org/10.1562/0031-8655(2003)077<0115:SSOBMB>2.0.CO;2 0031-8655 Google Scholar
A. J. Thody,
E. M. Higgins,
K. Wakamatsu,
S. Ito,
S. A. Burchill, and
J. M. Marks,
“Pheomelanin as well as eumelanin is present in human epidermis,”
J. Invest. Dermatol., 97 340
–344
(1991). https://doi.org/10.1111/1523-1747.ep12480680 0022-202X Google Scholar
B. W. Murphy,
R. J. Webster,
B. A. Turlach,
C. J. Quirk,
C. D. Clay,
P. J. Heenan, and
D. D. Sampson,
“Toward the discrimination of early melanoma from common and dysplastic nevus using fiber optic diffuse reflectance spectroscopy,”
J. Biomed. Opt., 10
(6), 064020
(2005). https://doi.org/10.1117/1.2135799 1083-3668 Google Scholar
V. P. Wallace,
D. C. Crawford,
P. S. Mortimer,
R. J. Ott, and
J. C. Bamber,
“Spectrophotometric assessment of pigmented skin lesions: methods and feature selection for evaluation of diagnostic performance,”
Phys. Med. Biol., 45 735
–751
(2004). https://doi.org/10.1088/0031-9155/45/3/312 0031-9155 Google Scholar
R. Marchesini,
M. Brambilla,
C. Clemente,
M. Maniezzo,
A. E. Sichirollo,
A. Testori,
D. R. Venturoli, and
N. cascinelli,
“In vivo spectrophotometric evaluation of neoplastic and nonneoplastic skin pigmented lesions—I Reflectance measurements,”
Photochem. Photobiol., 53 77
–84
(1991). https://doi.org/10.1111/j.1751-1097.1991.tb08470.x 0031-8655 Google Scholar
M. L. Tran,
B. J. Powell, and
P. Meredith,
“Chemical and structural disorder in eumelanins: a possible explanation for broadband absorbance,”
Biophys. J., 90 743
–752
(2006). https://doi.org/10.1529/biophysj.105.069096 0006-3495 Google Scholar
P. Meredith,
B. J. Powell,
J. Riesz,
S. P. Nighswander-Rempel,
M. R. Pederson, and
E. G. Moore,
“Towards structure-property-function relationships for eumelanin,”
Soft Matter, 2 37
–44
(2006). https://doi.org/10.1039/b511922g 1744-683X Google Scholar
S. J. Orlow,
M. P. Osber, and
J. M. Pawelek,
“Synthesis and characterization of melanins from dihydroxy-2-carboxylic acid and dihydroxyindole,”
Pigment Cell Res., 5 113
–121
(1992). 0893-5785 Google Scholar
J. Riesz,
J. Gilmore, and
P. Meredith,
“Quantitative scattering of melanin solutions,”
Biophys. J., 90 4137
–4144
(2006). https://doi.org/10.1529/biophysj.105.075713 0006-3495 Google Scholar
R. Sarangarajan and
S. P. Apte,
“The polymerization of melanin: a poorly understood phenomenon with egregious biological implications,”
Melanoma Res., 16 3
–10
(2006). 0960-8931 Google Scholar
J. B. Nofsinger,
S. E. Forest, and
J. D. Simon,
“Explanation for the disparity among absorption and action spectra of eumelanin,”
J. Phys. Chem. B, 103 11428
–11432
(1999). https://doi.org/10.1021/jp992640y 1089-5647 Google Scholar
K. Bochenek and
E. Gudowska-Nowak,
“Electronic properties of random polymers: modeling optical spectra of melanins,”
Acta Phys. Pol. B, 34 2775
–2790
(2003). 0587-4254 Google Scholar
V. Capozzi,
G. Perna,
P. Carmone,
A. Gallone,
M. Lastella, and
E. Mezzenga,
“Optical and photoelectronic properties of melanin,”
Thin Solid Films, 511 362
–366
(2006). https://doi.org/10.1016/j.tsf.2005.12.065 0040-6090 Google Scholar
S. L. Jacques and
D. J. McAuliffe,
“The melanosome - threshold temperature for explosive vaporization and internal absorption-coefficient during pulsed laser irradiation,”
Photochem. Photobiol., 53 769
–775
(1991). 0031-8655 Google Scholar
R. R. Crippa,
V. Christofoletti, and
N. Romeo,
“A band model for melanin deduced from optical absorption and photoconductivity experiments,”
Biochim. Biophys. Acta, 538 164
–170
(1978). https://doi.org/10.1016/0304-4165(78)90260-X 0006-3002 Google Scholar
J. Riesz,
T. Sarna, and
P. Meredith,
“Radiative relaxation in synthetic pheomelanin,”
J. Phys. Chem. B, 110 13985
–13990
(2006). https://doi.org/10.1021/jp054869l 1089-5647 Google Scholar
J. B. Nofsinger,
T. Ye, and
J. D. Simon,
“Ultrafast nonradiative relaxation dynamics of eumelanin,”
J. Phys. Chem. B, 105 2864
–2866
(2001). https://doi.org/10.1021/jp004045y 1089-5647 Google Scholar
P. Meredith and
J. Riesz,
“Radiative relaxation quantum yields for synthetic eumelanin,”
Photochem. Photobiol., 79 211
–216
(2004). https://doi.org/10.1562/0031-8655(2004)079<0211:RCRQYF>2.0.CO;2 0031-8655 Google Scholar
T. Ye,
J. D. Simon, and
T. Sarna,
“Ultrafast energy transfer from bound tetra(4-N,N,N,N-trimethylanilinium)porphyrin to synthetic dopa and cysteinyldopa melanins,”
Photochem. Photobiol., 77 1
–4
(2003). https://doi.org/10.1562/0031-8655(2003)077<0001:UETFBT>2.0.CO;2 0031-8655 Google Scholar
H. Ou-Yang,
G. Stamatas, and
N. Kollias,
“Spectral responses of melanin to ultraviolet A irradiation,”
J. Invest. Dermatol., 122 492
–496
(2004). https://doi.org/10.1046/j.0022-202X.2004.22247.x 0022-202X Google Scholar
K. Teuchner,
J. Ehlert,
W. Freyer,
D. Leupold,
P. Altmeyer,
M. Stucker, and
K. Hoffmann,
“Fluorescence studies of melanin by stepwise two-photon femtosecond laser excitation,”
J. Fluoresc., 10 275
–281
(2000). https://doi.org/10.1023/A:1009453228102 1053-0509 Google Scholar
S. Ito,
K. Wakamatsu, and
H. Ozeki,
“Spectrophotometric assay of eumelanin in tissue samples,”
Anal. Biochem., 215 273
–277
(1993). https://doi.org/10.1006/abio.1993.1586 0003-2697 Google Scholar
|


