|
|
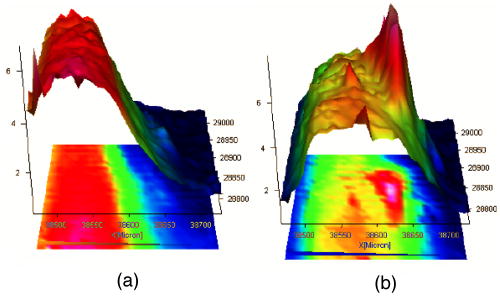
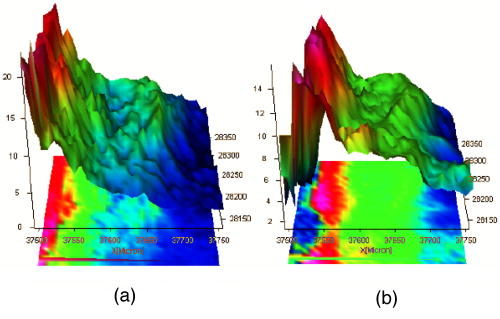
1.IntroductionThe effects of optical clearing of highly scattering biological tissue by use of hyperosmotically biocompatible agents have been observed by using a number of techniques, 1, 2, 3, 4, 5, 6, 7, 8, 9, 10 examples of which include near-infrared spectrophotometers,2, 3 optical coherence tomography (OCT) imaging,4, 5, 6 charge-coupled device (CCD) cameras7 for direct observation, mass loss assess ment,7 transdermal skin resistance (TSR) measurement,8 and second harmonic generation imaging.10 The existing results are encouraging, since they demonstrate that the addition of hyperosmotically biocompatible agents such as glycerol,5, 8, 10 propylene glycol,2, 5, 6 DMSO,2, 8 glucose,4 oleic acid,7 or dex trose9 may lead to turbid tissue (for example skin, gastrointestinal tissue, and sclera or aorta), becoming optically clear. The explanations for optical improvements brought by optical clearing were proposed as the creation of a better refractive index matching environment induced by dehydration and structural reorganization within the tissue, which could lead to the reduction of light scattering. Despite numerous studies being performed to demonstrate the optical clearing effect within highly scattering biological tissue after application of the biocompatible chemical agents, our understanding of the actual clearing mechanisms involved is still relatively poor. To facilitate the availability of the optical clearing technique in the enhancement of light penetration depth and in the improvement of imaging performance for high-resolution imaging of biological tissue, there is a need to perform further systematic studies to delineate accurate mechanisms of the dynamic optical clearing process. In this regard, penetration kinetics in the tissue clearing process, i.e., the penetration characteristics of hyperosmotically biocompatible agents within tissue, should be examined in the first place. For this aim, new analytical tools need to be introduced. Spectroscopic imaging is an attractive method, since it can provide simultaneous information on both spatial and chemical properties of an intact system while preserving the sample integrity. By taking advantage of the vibrational spectral signatures of biological components, such as lipids and proteins, it is possible to obtain images of the intrinsic distribution of these molecules. Fourier transform infrared (FTIR) spectroscopic imaging with focal plane array (FPA) detectors for spectroscopic detection is a relatively new technique that is capable of real-time microscopic chemical characterizations.11 As opposed to conventional FTIR microspectroscopic instrumentation that employs a single detection element hundreds of micrometers in size,11 spectral multiplexing combined with multichannel detection in a FTIR interferometer, microscope, and FPA assembly enables spectroscopic and spatial discrimination over a sample field of view in minutes.11 To date, FTIR spectroscopic imaging has been used to examine a variety of polymers and biological systems.12, 13 The good chemical specificity of FTIR spectroscopic imaging would allow the analysis of a broader range of pharmaceuticals. Furthermore, FTIR spectroscopic imaging has a relatively high spatial resolution down to and the possibility of accurate quantification. The fast acquisition required for an FTIR spectroscopic imaging experiment allows a time resolution on the order of minutes. This time resolution has enabled the study of polymer dissolution by solvents14, 15 and the study of transdermal drug delivery systems.16 Therefore, FTIR spectroscopic imaging could be a good candidate for the study of penetration kinetics of dynamic optical clearing processes. The objectives of this study were to 1. determine the feasibility of FTIR spectroscopic imaging techniques as an analytical tool for the investigation of optical clearing by use of hyperosmotic agents, and 2. examine the penetration kinetics of dimethyl sulphoxide (DMSO) and glycerol within tissue during optical clearing processes. For these aims, we examined two hyperosmotically biocompatible agents, i.e., 50% DMSO/distilled water (v/v) and 80% glycerol/distilled water (v/v) solutions, for their dynamic optical clearing effect on porcine skin tissue after topical applications. The sequential collection of images in a time series has been obtained by a FTIR spectroscopic imaging technique, which provides good opportunity to assess the penetration kinetics of glycerol and DMSO beneath the surface of skin tissue over time. 2.Materials and Methods2.1.Tissue Sample PreparationFresh porcine skin was obtained from an accredited slaughter house with removal of muscle and fat tissue layers using a scalpel blade. After depilation, porcine skin was cut in -mm pieces. The sample pieces were immediately sealed in a plastic bag to prevent them from natural dehydration, and kept frozen in a freezer at until sectioning. Sections with the thickness of were cut along the vertical direction of stratum corneum on a cryostat prior to performing FTIR spectroscopic imaging experiments. was allowed for samples left under room temperature before each measurement. 2.2.Preparation of Hyperosmotically Biocompatible AgentsDMSO and glycerol were chosen in this study, not only because they are common biocompatible agents that are used currently for optical clearing of tissue, but also because they possess different penetration characteristics within tissue, with DMSO having a much faster diffusion rate than glycerol.17, 18 Anhydrous DMSO and glycerol were purchased from Sigma Chemical Company, Saint Louis, Missouri. In this study, 50% DMSO and 80% glycerol solutions mixed with the distilled water (v/v) were prepared for FTIR spectroscopic imaging measurements. 2.3.Data Acquisition and AnalysesThe imaging setup used in this study consisted of a step-scan spectrometer (Bruker IFS-66/s), a HgCdTe (MCT) focal plane array (MCT-FPA) detector, and Hyperion 3000 microscope (Bruker Optics, Germany) with a NIR source and beamsplitter. All experiments were carried out in transmittance mode within the spectral range of 7500 to at spectral resolution and ( pixel binning) spatial resolution. A Cassegrain objective was used to image a sample area field of view onto a pixel MCT-FPA that is equipped with an optimal-sized cold shield. The total data collection time per each individual image (nine scans) was approximately two minutes. Figure 1 shows a video image of porcine skin, where the area marked by the box indicates the measured area of the MCT-FPA detector. A small volume of DMSO or glycerol solution was applied on the stratum corneum side of the porcine skin (indicated by arrows), and then the continuous measurements were immediately initiated. All data analysis was performed with OPUS/3D (Bruker Optics, Germany). Using OPUS/3D, the data can be visualized as diverse 2-D IR spectroscopic images and/or 3-D false color plots. In addition, spectral measurements of intact porcine skin, pure DMSO, and anhydrous glycerol were performed with single element detectors on Hyperion 3000 to identify the marker bands for different species so that the spectroscopic imaging can be specific, i.e., the spectroscopic imaging can be more meaningful by integration of the signals within the marker bands. Figure 2 shows the spectral results measured within the range of 7500 to . The red ellipses in the figures are indicating the marker bands, that is, 4750 to for pig skin, 4500 to for pure DMSO, and 4900 to for anhydrous glycerol. Fig. 2Spectra of skin, DMSO, and glycerol between 7500 to measured by FTIR microscope. (a) Spectra of DMSO and porcine skin, where the red ellipse indicates the marker band of 4750 to for the skin and 4500 to for DMSO. (b) Spectra of glycerol and porcine skin, where the red ellipse indicates the marker band of 4750 to for the skin and 4900 to for glycerol. (Color online only.)  3.Results3.1.Penetration Kinetics of Dimethyl Sulphoxide within Porcine Skin3.1.1.Marker bands for porcine skin and dimethyl sulphoxideThe FTIR spectroscopic imaging technique gave a set of three dimensional data with - of the specimen size and the dimension being the spectroscopic signal, i.e., wavenumber axis. Figure 3 illustrates IR spectroscopic images and spectra of porcine skin impregnated with 50% DMSO solution, and also shows the marker bands of spectra: 4750 to for the skin and 4500 to for DMSO. Figures 3a and 3b are the collapsed images into the - plane by integration of the spectroscopic signal within the marker band for skin and DMSO. The plots in Figs. 3c and 3d show the spectroscopic signal at the points indicated in Figs. 3a and 3b. Within 4750 to for a porcine skin marker band, three possible bonds may be responsible for the spectral peak, i.e., the straight carbon chain and cis-double bands (4761 to ), the combination of vibrations of protein side chains , and vibration of C-H bonds bound to various fatty acids (4651 and ). For DMSO marker bands within 4500 to , the spectral peak could derive from the N-H peptide and amino acids . Fig. 3IR spectroscopic images and marker bands for porcine skin and DMSO. (a) and (b) are the - collapsed images by integrating spectroscopic signal within the marker band for skin and DMSO, respectively. The plots (c) and (d) show the spectroscopic signals at the points indicated in (a) and (b). The scale bar indicates . (Color online only.) 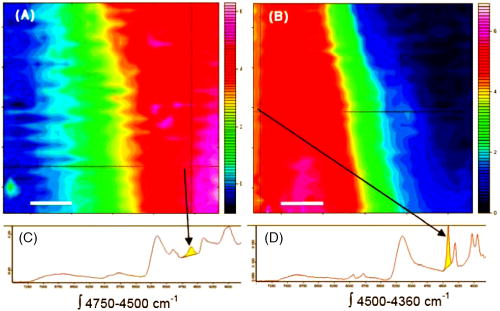 3.1.2.Infrared spectroscopic images for penetration kinetics of dimethyl sulphoxideFigure 4 demonstrated the dynamic penetration process of 50% DMSO/distilled water(v/v) solution into the porcine skin. A series of IR spectroscopic images over the time course within the range of 4500 to were obtained by the FTIR spectroscopic imaging technique. Four representative images, start time [Fig. 4a, at the time right after placing the DMSO on the skin], [Fig. 4b], [Fig. 4c], and [Fig. 4d], are shown in the figure. From Fig. 4, it can be seen that DMSO already penetrated into the epidermis layer after [Fig. 4b] of being placed on the stratum corneum side of porcine skin. With the elapse of time, DMSO continued penetrating into the superficial layer of dermis after [Fig. 4c], and finally into the deep layer of dermis after [Fig. 4d]. 3.1.3.Three dimensional false color plots for penetration kinetics of dimethyl sulphoxide3-D false color plots and contours at start time and after for 50% DMSO/distilled water(v/v) into porcine skin are shown in Fig. 5 . From Fig. 5, it can be seen that DMSO dynamically penetrated into the deep layer (at more than ) of porcine skin. 3.2.Penetration Kinetics of Glycerol within Porcine Skin3.2.1.Marker bands for porcine skin and glycerolSimilar to that described in Sec. 3.1.1, Fig. 6 illustrates IR spectroscopic images and spectra of porcine skin impregnated with 80% glycerol solution, and also shown are the marker bands of spectra: 4750 to for the skin and 4900 to for glycerol. Figures 6a and 6b are the collapsed images into the - plane by integration of the spectroscopic signal within the marker band for skin and glycerol, respectively. Figures 6c and 6d show the spectroscopic signal at the points indicated in Figs. 6a and 6b. For glycerol, marker band within 4900 to , the O-H deformation and C-O stretch of the third overtone could motivate the spectral peak within the range. Fig. 6IR spectroscopic images and marker bands for porcine skin and glycerol. (a) and (b) are the - collapsed images by integrating spectroscopic signal within the marker band for skin and glycerol, respectively. And plots (c) and (d) show the spectroscopic signals at the points indicated in (a) and (b). Scale bar indicates . (Color online only.)  3.2.2.Infrared spectroscopic images for penetration kinetics of glycerolFigure 7 illustrates the dynamic penetration process of 80% glycerol solution into porcine skin. A series of IR spectroscopic images within 4900 to in the course of time were obtained by a FTIR imaging microscope. Four representative images, start time [Fig. 7a right after application of the glycerol onto the skin surface], [Fig. 7b], [Fig. 7c], and [Fig. 7d], are shown in the figure. From Fig. 7, it can be seen that glycerol penetrated slowly into skin tissue. Only after , the slight changes in IR images appeared. later, it seemed that glycerol finally penetrated into the layer of epidermis (at around ). No further penetration action could be seen. 3.2.3.Three dimensional false color plots for penetration kinetics of dimethyl sulphoxide3-D false color plots and contours at start time and after for 80% glycerol/distilled water (v/v) into porcine skin are shown in Fig. 8 . From Fig. 8, it can be seen that glycerol slowly penetrated into porcine skin, since it could be examined only in the superficial layer (at ) even after 30-min penetration. 4.DiscussionIn this study, by using the FTIR spectroscopic imaging technique, we have investigated for the first time the penetration kinetics of hyperosmotically biocompatible agents such as DMSO and glycerol during the optical clearing process of porcine skin. First of all, the presented results revealed that both DMSO and glycerol could to some degree penetrate into porcine skin. Moreover, both anhydrous glycerol and DMSO have the higher refractive index of 1.47, which is near to that of collagen. Thus, when they diffuse into tissue fluid, they can cause an increase in the refractive index of the fluid; therefore, the reduced scattering coefficient decreases, leading to an increase in light penetration, as shown in the previous experimental results.19 Furthermore, DMSO, a dipolar aprotic solvent, has a tendency to accept rather than donate protons. DMSO has been extensively studied previously as a carrier to enhance the percutaneous penetration of drugs through human skin20 and guinea pig skin.21 Since Stoughton and Fritsch22 reported that DMSO can be used to enhance the percutaneous penetration of various agents in 1964, this characteristic has been exploited clinically in many different circumstances. By employing DMSO, Kolb 17 evaluated the absorption and distribution of DMSO in small animals and humans. They reported that after cutaneous application in the rat, radioactivity was measured in the blood. In humans, radioactivity appeared in the blood after cutaneous application. These findings indicate that the DMSO penetration happens within a very short time. The fast penetration rate of DMSO could decrease the osmolarity of the solution rapidly, even if the original one is high. He and Wang19 demonstrated that DMSO has a fast penetration rate into tissue and therefore could bring enhancement in the penetration depth of light within tissue than other optical clearing agents. This is confirmed by the experimental results shown in Figs. 4 (IR spectroscopic images) and 5 (3-D false color plot, indicating the magnitude of the integrated signal fallen within the wavenumber range versus - coordinates of the sampling area). Glycerol is biologically inert and is generally considered a safe additive by the Food and Drug Administration. It is widely used in the commercial formulations of foods, drugs, and cosmetics. He and Wang19 reported that, compared to with DMSO, glycerol could be the best choice for improvement in optical imaging performance. However, it is difficult for glycerol alone to penetrate into the stratum corneum because of the hydrophilicity of glycerol, as the results shown in Figs. 7 (IR spectroscopic images) and 8 (3-D false color plots) by FTIR spectroscopic imaging technique demonstrated. Figure 9 shows the penetration depth of DMSO and glycerol into porcine skin over the time course measured from the FTIR images. From Fig. 9, the penetration rate of DMSO within porcine skin was estimated as within the first , within the period of the next (from min 4 to min 12), and from min 12 to min 40, while that of glycerol was within the first , from min 4 to min 15 and from min 16 to min 30, respectively. The plot shows that at the end of , DMSO rapidly penetrated into porcine skin at while glycerol was detected only at , even after . It is clear that DMSO has faster penetration into porcine skin than glycerol does. One possible reason is that the size of glycerol (with the molecular weight of 92.10) is larger than that of DMSO (with the molecular weight of 78.13), which has an effect on the penetration because of the brick-mortar structure of the stratum corneum that prevents large molecules from passing through. Additionally, compared with glycerol, the interaction between DMSO and the polar membrane surface affected the close packing of hydrocarbon chains of lipid molecules. The interaction between DMSO and the polar membrane surface gives rise to defects in the bilayer structure of skin tissue, which results in the increase of DMSO permeability. To summarize, current results from the FTIR spectroscopic imaging technique showed the dynamic penetration process of DMSO and glycerol within porcine skin tissue. At the same time, the results also revealed that DMSO possesses the faster penetration rate than that of glycerol, which agreed well with previous studies.19 Fast penetration is particularly important for in-vivo applications, because it could create a rapid refractive index matching environment within tissue that would consequently lead to an improvement in light penetration depth, benefiting a number of optical techniques, for example in-vivo optical imaging of biological tissues.23 5.ConclusionWe show that the FTIR spectroscopic imaging technique is a powerful analytical tool for investigation penetration kinetics of agents within tissue. Furthermore, both IR spectroscopic images and 3-D false color plots can be used to show the penetration kinetics through grayscale mode or false color mode. With appropriate image processing techniques, quantification of kinetic penetration of optical clearing agents into the different tissues is therefore possible. The current results demonstrate that FTIR spectroscopic imaging is not only useful for our further understanding of tissue optical clearing dynamics of glycerol and DMSO, but also could further provide an opportunity to quantify hyperosmotically biocompatible agents used for the optical clearing of different biological tissues. Therefore, FTIR spectroscopic imaging techniques may have great potential in further studies of optical clearing approaches in applications for light-based therapeutic and diagnostic techniques, as well as optical imaging techniques. AcknowledgmentsThis research was supported in part by the Engineering and Physical Science Research Council, United Kingdom, under the project GR/R52978. J.J. acknowledges the K. C. Wong Fellowship of the Royal Society (United Kingdom) and the support from the National Natural Science Foundation of China (NSFC, number 30600126). The results presented in this work were collected when Jiang and Wang were at the Institute of Bioscience and Technology, Cranfield University, United Kingdom. ReferencesV. V. Tuchin,
I. L. Maksimova,
D. A. Zimnyakov,
I. L. Kon,
A. H. Mavlutov, and
A. A. Mishin,
“Light propagation in tissues with controlled optical properties,”
J. Biomed. Opt., 2
(4), 401
–407
(1997). https://doi.org/10.1117/1.429841 1083-3668 Google Scholar
J. Jiang and
R. K. Wang,
“Synergistic effect of hyperosmotic agents undertopical application on optical clearing of skin tissue in vitro,”
Proc. SPIE, 5696 80
–90
(2005). 0277-786X Google Scholar
X. Xu,
R. K. Wang,
J. B. Elder, and
V. V. Tuchin,
“Effect of dextran-induced changes in refractive index and aggregation on optical properties of whole blood,”
Phys. Med. Biol., 48 1205
–1221
(2003). https://doi.org/10.1088/0031-9155/48/9/309 0031-9155 Google Scholar
H. Liu,
B. Beauvoit,
M. Kimura, and
B. Chance,
“Dependence of tissue optical properties on solute-induced changes in refractive index and osmolarity,”
J. Biomed. Opt., 1
(2), 200
–211
(1996). https://doi.org/10.1117/12.231370 1083-3668 Google Scholar
V. V. Tuchin,
X. Xu, and
R. K. Wang,
“Dynamic optical coherence tomography in optical clearing, sedimentation and aggregation study of immersed blood,”
Appl. Opt., 41 258
–271
(2002). https://doi.org/10.1364/AO.41.000258 0003-6935 Google Scholar
R. K. Wang,
X. Xu,
V. V. Tuchin, and
J. B. Elder,
“Concurrent enhancement of imaging depth and contrast for optical coherence tomography by hyperosmotic agents,”
J. Opt. Soc. Am. B, 18 948
–953
(2001). https://doi.org/10.1364/JOSAB.18.000948 0740-3224 Google Scholar
R. K. Wang and
J. B. Elder,
“Propylene glycerol as a contrasting agent for optical coherence tomography to image gastro-intestinal tissues,”
Lasers Surg. Med., 30 201
–208
(2002). https://doi.org/10.1002/lsm.10013 0196-8092 Google Scholar
J. Jiang and
R. K. Wang,
“Comparing synergistic effects of oleic acid and dimethyl sulfoxide as vehicle on optical clearing of skin tissue in vitro,”
Phys. Med. Biol., 49 5283
–5294
(2004). https://doi.org/10.1088/0031-9155/49/23/006 0031-9155 Google Scholar
G. Vargas,
E. K. Chan,
J. K. Barton,
H. G. Rylander, and
A. J. Welch,
“Use of an agent to reduce scattering in skin,”
Lasers Surg. Med., 24 133
–144
(1999). https://doi.org/10.1002/(SICI)1096-9101(1999)24:2<133::AID-LSM9>3.0.CO;2-X 0196-8092 Google Scholar
S. Plotnikov,
V. Juneja,
A. B. Isaacson,
W. A. Mohler, and
P. J. Campagnola,
“Optical clearing for improved contrast in second harmonic generation imaging of skeletal muscle,”
Biophys. J., 90 328
–339
(2006). https://doi.org/10.1529/biophysj.105.066944 0006-3495 Google Scholar
R. Bhargava,
B. G. Wall, and
J. L. Koenig,
“Comparison of the FTIR mapping and imaging techniques applied to polymeric systems,”
Appl. Spectrosc., 54 470
–479
(2000). 0003-7028 Google Scholar
E. N. Lewis,
A. M. Gorbach,
C. Marcott, and
I. W. Levin,
“High-fidelity Fourier transform infrared spectroscopic imaging of primate brain tissue,”
Appl. Spectrosc., 50 263
–269
(1996). https://doi.org/10.1366/0003702963906618 0003-7028 Google Scholar
M. van de Weert,
R. van’t Hof,
J. van der Weerd,
R. M. A. Heeren,
G. Posthuma,
W. E. Hennink, and
D. J. A. Crommelin,
“Lysozyme distribution and conformation in a biodegradable polymer matrix as determined by FTIR techniques,”
J. Controlled Release, 68 31
–40
(2000). 0168-3659 Google Scholar
T. Ribar,
J. L. Koenig, and
R. Bhargave,
“FTIR imaging of polymer dissolution. 2. Solvent/nonsolvent mixtures,”
Macromolecules, 34 8340
–8346
(2001). 0024-9297 Google Scholar
J. Gonzalez-Benito and
J. L. Koenig,
“FTIR imaging of the dissolution of polymers. 4. Poly(methyl methacrylate) using a cosolvent mixture (carbon tetrachloride/methanol),”
Macromolecules, 35 7361
–7367
(2002). 0024-9297 Google Scholar
D. W. Eafferty and
J. L. Koenig,
“FTIR imaging for the characterization of controlled-release, drug delivery applications,”
J. Controlled Release, 83 29
–39
(2002). https://doi.org/10.1016/S0168-3659(02)00135-9 0168-3659 Google Scholar
K. H. Kolb,
G. Janicke,
M. Kramer,
P. E. Schulze, and
G. Raspe,
“Absorption, distribution and elimination of labelled dimethyl sulfoxide in man and animals,”
Ann. N.Y. Acad. Sci., 141 85
–95
(1967). 0077-8923 Google Scholar
M. S. Frank,
M. C. Nahata, and
M. D. Hilty,
“Glycerol: a review of its pharmacology, pharmacokinetics, adverse reactions, and clinical use,”
Pharmacotherapy, 1,2 147
–160
(1981). 0277-0008 Google Scholar
Y. He and
R. K. Wang,
“Dynamic optical clearing effect of tissue impregnated with hyperosmotic agents and studied with optical coherence tomography,”
J. Biomed. Opt., 9
(1), 200
–206
(2004). https://doi.org/10.1117/1.1629682 1083-3668 Google Scholar
M. B. Sulzberger,
T. A. Cortese, and
L. Fishman,
“Some effects of DMSO on human skin in vivo,”
Ann. N.Y. Acad. Sci., 140 437
–506
(1966). 0077-8923 Google Scholar
S. V. Rudenko,
S. D. Gapochenko, and
V. A. Bondarenko,
“Effect of glycerol on the capacitance and conductivity of bilayer lipid membranes,”
Biophysics (Engl. Transl.), 29 245
–249
(1984). 0006-3509 Google Scholar
R. B. Stoughton and
W. Fritsch,
“Influence of dimethyl sulfoxide on human percutaneous absorption,”
Arch. Dermatol., 90 512
–517
(1964). 0003-987X Google Scholar
H. Zhao,
F. Gao,
Y. Tanikawa,
K. Homma, and
Y. Yamada,
“Time-resolved diffuse optical tomographic imaging for the provision of both anatomical and functional information about biological tissue,”
Appl. Opt., 44
(10), 906
–1916
(2005). https://doi.org/10.1364/AO.44.000906 0003-6935 Google Scholar
|