

|
|
1.IntroductionSince its introduction in 1991,1 optical coherence tomography (OCT) has been widely used and its biological applications broadly spread in different biomedical fields. OCT is a powerful imaging technique that is analogous to ultrasound imaging, except that it utilizes light instead of sound. The basic principle of OCT is to capture the backscattered photons from a sample of interest within a coherence length of the source using a two-beam interferometer. Scanning in depth ( axis) is performed by varying the optical path length of the sample arm while using a broadband laser source. OCT has many advantages over other popular imaging systems such as x-ray, magnetic resonance imaging, and ultrasound in terms of safety, cost, contrast, and resolution. However, lack of penetration depth into tissue is the main drawback of OCT. The turbidity of most biological tissues could prevent the ability of OCT to be fully engaged in various diagnostic and therapeutic procedures. The transformation of a turbid medium to a transparent one with no or minimal alteration of its composition has been the subject of a number of studies. This has led to the suggestion of a variety of different methods to achieve this phenomenon of tissue optical clearing. Among these is refractive index matching: the reduction of light scattering by addition of an analyte with a higher refractive index to reduce refractive index mismatch between cells and extracellular fluid. 2, 3, 4, 5, 6, 7, 8 Dehydration of the tissue could be another source of its clearing. This occurs with the administration of an analyte, in which water diffuses out of the tissue as the analyte diffuses in by osmotic forces.9 The use of an analyte for tissue “optical clearing” screens noncovalent intermolecular interactions between low-order collagen structures, resulting in collagen fiber dissociation.10 This could also be a cause of the clearing of biological tissues. Over the years, scleral anatomy has been thoroughly studied and an immense amount of information has been supplied. The sclera is composed of dense collagen fibrils arranged in bundles that cross each other in all directions and usually run parallel to the surface except at the limbus (transition zone where the sclera meets the cornea) and optic nerve.11 The variance in collagen fibrils thickness and orientation are attributed for the white, nontransparent appearance of the sclera. Different studies showed variation in the diameter values of the collagen fibrils in sclera from 12 to .13 Collagen bundles themselves had varying ranges of thickness from 14 to .11 Bundles were found to be wider and thicker toward the inner layers of the sclera.5 The three major layers of the sclera are the episclera, the scleral stroma, and the lamina fusca. The episclera is the outermost layer and is primarily composed of collagen bundles that intersect at different angles along the sclera. It is a thin (about ),15 dense, but well-vascularized layer of connective tissue.16 A small amount of elastic tissue could also be found in the episclera. The inner layers, the stroma and the lamina fusca, have collagen bundles that are more organized and oriented in two different patterns: merdionally and circularly. The refractive index of collagen bundles was measured to be 1.47 and that of the ground substance as 1.345.17 The refractive index mismatch between the collagen and elastin fibers and interstitial fluid could be the major source of scattering,4, 18, 19, 20, 21, 22 thus creating a turbid environment in the scleral tissue. Introducing a chemical analyte with a refractive index higher than that of the ground substance could raise the refractive index of the extracellular fluid, reduce the refractive index mismatch, and thus decrease the light scattering altogether. The tissue regains its optical properties and turbidity once it is immersed back in saline solution.23 Reducing optical scattering enhances the efficiency and broadens the applicability of light-based systems such as OCT.4, 19, 24 OCT has been recently proposed to be utilized in diffusion experiments to monitor and quantify the permeability coefficient of different drugs and analytes in various biological tissues (e.g., the sclera, cornea, and aorta).25, 26, 27, 28 Several diseases could alter the organization of the collagen bundles impacting the permeability coefficient of solutions and drugs diffusing into the tissue. For that, the knowledge of the diffusion values could assist in diagnosing diseases and differentiating among normal and abnormal tissues, as well as identifying various tissue layers. In these experiments, we studied diffusion of a hyperosmotic compound (aqueous solution of glucose) in the sclera for its dual exploitation: depth-resolved quantification of its permeability as well as creating a “more clear” medium that could assist in achieving higher depth penetration, and thus, enhancing diagnostic possibilities of light-based techniques. 2.Materials and Methods2.1.Experimental SetupThe experiments were carried out using a portable time-domain OCT system entirely controlled by a personal computer (Imalux Corporation, Cleveland, Ohio). The optical source used was a near-infrared low-coherence broadband light source (Superlum, Incorporated, Russia) with a wavelength of , output power of , and a resolution of (in air). The light was led perpendicular to the tissue with a single-mode optical fiber and a miniature endoscopic probe, which allowed scanning of a sample in the lateral direction ( axis). In-depth ( -axis) scanning was produced electronically by the piezoelectric modulation of the fiber length. A photodiode registered an interferogram that was formed by the light backscattered from a sample and reflected from a mirror in the reference arm of the interferometer. 2-D images measuring were acquired approximately every by scanning the sample surface laterally with the incident beam and in-depth with the piezoelectric modulator. The 2-D images were averaged laterally (over approximately , which was enough for speckle noise suppression) generating a single 1-D curve displaying distribution of light in-depth in a logarithmic scale. 2.2.Tissue SamplesExperiments were conducted with fresh New Zealand white rabbit eyes (Vision Tech Incorporated, Dallas, Texas). The eyes were transferred to our laboratory and kept cool, then placed in 0.9% sodium chloride solution to prevent dehydration. They were freshly acquired and experiments were performed during the first three days on arrival to ensure minimal physiological changes to the samples due to aging. Before each trial, an eye was taken from its cooled environment and placed for an hour in a 0.9% sodium chloride solution, which was sufficient for the eye to reach room temperature. After being cleared from any extra tissues attached to the sclera, the bottom hemisphere of the eye was placed in saline solution and the upper part exposed to air. The saline bath was necessary to minimize dehydration of the eye during OCT experiments. The sclera was imaged for about before the addition of glucose to record a baseline. Subsequently, of 40% glucose was applied to the surface of the sclera (that was being exposed to air), and imaging was resumed for another at the same position. Continuous imaging was carried out to monitor depth-resolved changes in the tissue’s optical properties before and after application of this hyperosmotic agent. A total of five independent experiments were conducted while the temperature of the samples was maintained at a constant . Glucose solution was prepared by dissolving of glucose (Mallinckrodt Baker, Incorporated, Phillipsburg, New Jersey) in purified and distilled water. 2.3.Data ProcessingThe permeability coefficient of glucose in the sclera was calculated using the OCT signal slope (OCTSS) method (explained in detail in Ref. 26) with a specially developed C++ program. The same program was also utilized to evaluate the clearing effect of glucose at different depths away from the epithelial layer of the sclera. The average permeability coefficient of a specific region in a tissue was computed by analyzing the slope changes in the OCT signal due to glucose diffusion. First, the 2-D images were averaged and a 1-D OCT signal distribution was obtained. To reduce the effect of surface curvature, the most flat regions of the 2-D images were used for the averaging (typically, the first and last regions in the lateral direction were excluded from analysis). An in-depth region in that signal was chosen and its thickness was calculated. The increase in the local in-depth concentration of glucose in the monitored sclera region initiated a decrease in the scattering coefficient that was reflected in the OCTSS graph. Diffusion of glucose in the selected region was monitored, and the time of diffusion was recorded. Time was estimated from the instant OCTSS started decreasing until the point where a reverse process took place. The permeability coefficient was then calculated by dividing the thickness of the region selected by the time it took for glucose to diffuse through . The clearing effect of glucose on the sclera was computed using the OCT amplitude signal at different depths in the tissue during the diffusion process. The amplitude at a certain location inside the tissue was monitored during the diffusion process and the change in the light signal was observed; thus, the percent of optical clearing was calculated. The percentage of the clearing was estimated using the formula: , where and are the OCT signal amplitude values for the selected location before glucose started diffusing and after it had penetrated through, respectively. 3.Results1-D and 2-D images of the rabbit sclera are shown in Fig. 1 . Figures 1a and 1b represent the 2-D image and corresponding 1-D OCT signal distribution of the rabbit sclera taken before glucose was added. Figures 1c and 1d show the image and 1-D distribution of the sclera taken after glucose was added, while Figs. 1e and 1f show the image and signal distribution of the sclera taken after glucose was added. These figures and graphs demonstrate the change in the OCT signal as glucose diffused through the sclera. All three 1-D OCT signals presented were normalized to the maximum value from the original sclera signal to show the changes occurring due to glucose diffusion. From these figures, one can see that the signal from the sclera dropped to about 90% of its original value after and 82% after from the application of glucose. The depth scales shown in the 1-D graphs were calculated by dividing the optical path length given by the OCT system with the mean refractive index of the tissue, assumed to be 1.4 in the sclera. Fig. 1(a), (c), and (e) 2-D OCT images of rabbit sclera during a glucose diffusion experiment recorded at 0, 20, and from the onset of the experiment. (b), (d), and (f) are the corresponding 1-D signal distribution of the OCT images.  The permeability coefficient of glucose was calculated in different regions in two separate areas in the rabbit sclera: the upper , which constitutes a layer that includes the episclera, and the following region (which is thought to be in the stroma or the second layer). Figure 2 demonstrates a typical OCTSS graph acquired from a rabbit sclera during a glucose diffusion experiment. First, the sclera was imaged for about to record a baseline. Then, of 40% glucose was added to the area where the sclera was being imaged. The OCT signal slope was calculated from the upper layer of the tissue. The OCT detected the changes in the local scattering coefficient caused by the propagation of glucose through the selected region of the sclera. The increase in the local in-depth glucose concentration led to the decrease in the scattering coefficient and consequently to the decrease in the OCT signal slope.29, 30, 31 About into the application, the glucose had entirely penetrated through the monitored region and an increase in the signal slope was observed. Fig. 2Typical OCTSS graph as a function of time recorded from a rabbit sclera during 40% glucose diffusion experiment  From the physiology of cells and tissues, the variation in concentrations between intracellular and extracellular mediums generate a driving force for fluids, mainly water, to move from the higher concentrated area to the lower one, causing an osmotic effect. This force is likely to be the source of the increase in the OCTSS graph seen in Fig. 2. From five independent experiments, the permeability coefficient of glucose was found to be in the upper region and in the lower one. Figure 3 represents an OCT signal graph acquired about away from the epithelial layer of the rabbit sclera. The sclera was imaged for to record a baseline for each experiment. During this time, a decrease in the OCT signal was noticed. Exposing the tissue’s top surface directly to air could have allowed dehydration to take effect, thus decreasing the detected signal. Subsequently, of 40% glucose was added to the sclera. As the glucose reached the monitored depth, the OCT signal decreased, thus the sclera at that depth started clearing. The optical clearing was calculated at different depths within the tissue. The clearing percentage in the deeper regions was found to be higher than that of the superficial ones. Figure 4 summarizes the percent clearing of a rabbit sclera with 40% glucose measured at different depths in the two selected regions. Roughly, the first cleared around 10%, while the deeper region cleared about 17 to 22% in these experiments. Fig. 3A typical OCT signal graph as a function of time recorded from about away from the epithelial layer of rabbit sclera during the 40% glucose diffusion experiment, where and values are about 0.98 and 0.87, respectively. 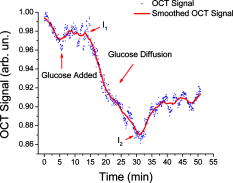 Fig. 4Optical clearing at different depths in rabbit sclera during the 40% glucose diffusion experiment. 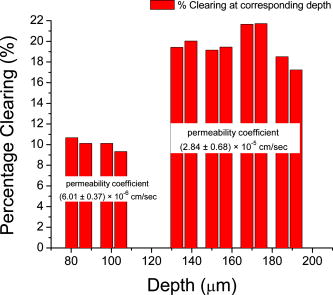 Figure 5 depicts the effect of glucose diffusion in tissue. Intensities as a function of depth are shown at three different times after the administration of glucose (0, 20, and ) and normalized to their respective maximum value. As the solution diffused through the tissue, an increase in intensity was detected by the OCT system. This increase signifies OCT’s deeper penetration into the tissue as a result of the “clearing effect.” 4.DiscussionThe presented results and experiments suggest the capability of the OCT technique for quantifying the permeability coefficient of glucose and its clearing effect in different layers of rabbit sclera. Glucose was monitored in two different regions: the uppermost region (including the episclera) and a lower region (in the stroma). The episclera layer is composed mainly of connective tissues, while a small amount of elastic tissue16 is also found. The bulbar conjunctiva is a thin, translucent mucous membrane that covers the sclera.32 This epithelial layer composed of elastic tissue covering the episclera is thought to create a natural barrier that slows the penetration of analytes and solutions. Our observation of the permeability coefficient in various depths of the sclera provided the first nondestructive experimental support for the prior assumption. Glucose traveled faster when it was past the outermost layer. Another reason for the difference in the permeability coefficient of glucose in the two regions could have been the diverse anatomical properties of collagen bundles in each layer. Collagen bundles show a wide range of width and thickness among the layers of the sclera. They tend to be wider and thicker toward the inner layers, therefore creating more spacing for analytes to diffuse through more easily. Additionally, our study suggests that more clearing is occurring in the inner region than in the upper one. The disparity in the collagen fibril sizes among the various layers in the sclera could have been the main reason for the dissimilarity in the clearing effect among different regions in the tissue. The structures of the different layers could have also been another source of differentiation in the optical clearing. The refractive index mismatch between the mitochondria, cytoplasm, cell membrane, extracellular media, and its components such as collagen and elastin fibers, could be the major source of scattering.4, 18, 19, 22 Penetration of glucose in the episclera could have been mainly through the intracellular spaces; thus less glucose enters the cells and matches its organelles inside to the surrounding environment. The results for clearing in the rabbit stroma of these experiments correlated well with previous studies. Bashkatov used a fiber optic spectrometer in their clearing studies to find that the rabbit sclera cleared by about 15 to 17% after from being exposed to 40% glucose.5 To the best of our knowledge, the episclera has not been represented separately in previous optical clearing studies. The results from this study show that the glucose clearing of the layer of which the episclera is a part of is not as effective as in the stroma; however, it is significant regardless of its size due to the fact that the episclera is the first layer of tissue that light and chemical agents have to penetrate. Utilization of this information could lead to the formulation of new drugs and analytes that would allow the clearing effect to be more effective in all layers of the tissue, including the episcleral layer. 5.ConclusionIn the presented study, glucose solution is utilized in dual applications: quantification of the permeability coefficient and optical clearing of turbid tissues. The monitoring and evaluation of glucose diffusion in biological tissues could assist in the diagnostics of diseases by distinguishing among normal and abnormal tissues. Moreover, glucose’s effectiveness in clearing turbid tissues can increase the efficacy of OCT in penetrating deeper into tissues. We also demonstrate that the OCT technique could be used in depth-resolved diffusion studies as well as quantifying the effectiveness of a clearing agent on distinct regions within the tissue. It is shown that the region in the rabbit sclera, which the episclera is part of, has a slower permeability coefficient to glucose than did the stroma. In addition, the clearing effect of glucose solution is higher in the stroma than it is in the episcleral region. The information from this study could enhance the use of OCT and other optical modalities in medical imaging and disease diagnostics due to its ability to measure the permeability coefficient and optical clearing in different layers of scleral tissue. AcknowledgmentThe study was supported in part by grants from the W. Coulter Foundation and Office of Naval Research (Larin), Federal Agency of Education of RF number 1.4.06, RNP.2.1.1.4473 and RFBR number 06-02-16740 (Tuchin). ReferencesD. Huang,
E. A. Swanson,
C. P. Lin,
J. S. Schuman,
W. G. Stinson,
W. Chang,
M. R. Hee,
T. Flotte,
K. Gregory,
C. A. Puliafito and
J. G. Fujimoto,
“Optical coherence tomography,”
Science, 254
(5035), 1178
–1181
(1991). https://doi.org/10.1126/science.1957169 0036-8075 Google Scholar
G. Vargas,
E. K. Chan,
J. K. Barton, H. G. Rylander 3rd, A. J. Welch,
“Use of an agent to reduce scattering in skin,”
Lasers Surg. Med., 24
(2), 133
–141
(1999). https://doi.org/10.1002/(SICI)1096-9101(1999)24:2<133::AID-LSM9>3.0.CO;2-X 0196-8092 Google Scholar
R. K. Wang,
“Signal degradation by multiple scattering in optical coherence tomography of dense tissue: a Monte Carlo study towards optical clearing of biotissues,”
Phys. Med. Biol., 47
(13), 2281
–2299
(2002). https://doi.org/10.1088/0031-9155/47/13/307 0031-9155 Google Scholar
V. V. Tuchin,
I. L. Maksimova,
D. A. Zimnyakov,
I. L. Kon,
A. H. Mavlutov, and
A. A. Mishin,
“Light propagation in tissues with controlled optical properties,”
J. Biomed. Opt., 2
(4), 401
–417
(1997). https://doi.org/10.1117/1.429841 1083-3668 Google Scholar
A. N. Bashkatov,
V. V. Tuchin,
E. A. Genina,
Y. P. Sinichkin,
N. A. Lakodina, and
V. I. Kochubey,
“The human sclera dynamic spectra: in vitro and in vivo measurements,”
Proc. SPIE, 3591 311
–319
(1999). https://doi.org/10.1117/12.350592 0277-786X Google Scholar
A. N. Bashkatov,
E. A. Genina,
Y. P. Sinichkin,
V. I. Kochubey,
N. A. Lakodina, and
V. V. Tuchin,
“Glucose and mannitol diffusion in human dura mater,”
Biophys. J., 85
(5), 3310
–3318
(2003). 0006-3495 Google Scholar
A. N. Bashkatov,
E. A. Genina,
P. Sinichkin Iu,
V. I. Kochubei,
N. A. Lakodina, and
V. V. Tuchin,
“Determination of glucose diffusion coefficient in the human eye sclera,”
Biofizika, 48
(2), 309
–313
(2003). 0006-3029 Google Scholar
V. V. Tuchin, Optical Clearing of Tissues and Blood, SPIE Press, Bellingham, WA
(2005). Google Scholar
X. Xu and
R. K. Wang,
“The role of water desorption on optical clearing of biotissue: studied with near infrared reflectance spectroscopy,”
Med. Phys., 30
(6), 1246
–1253
(2003). https://doi.org/10.1118/1.1576228 0094-2405 Google Scholar
A. T. Yeh,
B. Choi,
J. S. Nelson, and
B. J. Tromberg,
“Reversible dissociation of collagen in tissues,”
J. Invest. Dermatol., 121
(6), 1332
–1335
(2003). https://doi.org/10.1046/j.1523-1747.2003.12634.x 0022-202X Google Scholar
D. H. Gold and
R. A. Lewis, Clinical Eye Atlas, AMA Press, Chicago, IL
(2002). Google Scholar
J. A. Rada,
S. Shelton, and
T. T. Norton,
“The sclera and myopia,”
Exp. Eye Res., 82
(2), 185
–200
(2006). 0014-4835 Google Scholar
D. Meller,
K. Peters, and
K. Meller,
“Human cornea and sclera studied by atomic force microscopy,”
Cell Tissue Res., 288
(1), 111
–118
(1997). 0302-766X Google Scholar
C. S. Foster and
M. S. d. l. Maza, The Sclera, Springer-Verlag, New York
(1994). Google Scholar
J. P. G. Bergmanson,
(2007) Google Scholar
P. G. Watson and
R. D. Young,
“Scleral structure, organisation and disease. A review,”
Exp. Eye Res., 78
(3), 609
–623
(2004). 0014-4835 Google Scholar
D. Maurice,
“The cornea and the sclera,”
The Eye,
(1969) Google Scholar
R. K. Wang,
“Modelling optical properties of soft tissue by fractal distribution of scatters,”
J. Mod. Opt., 47 103
–120
(2000). https://doi.org/10.1080/095003400148475 0950-0340 Google Scholar
R. K. Wang,
X. Xu,
V. V. Tuchin, and
J. B. Elder,
“Concurrent enhancement of imaging depth and contrast for optical coherence tomography by hyperosmotic agents,”
J. Opt. Soc. Am. B, 18
(7), 948
–953
(2001). https://doi.org/10.1364/JOSAB.18.000948 0740-3224 Google Scholar
V. V. Bakutkin,
I. L. Maksimova,
P. I. Saprykin,
V. V. Tuchin, and
L. P. Shubochkin,
“Light scattering by human eye sclera,”
J. Appl. Spectrosc., 46 104
–107
(1987). 0021-9037 Google Scholar
V. V. Tuchin,
“Coherent optical techniques for the analysis of tissue structure and dynamics,”
J. Biomed. Opt., 4 106
–124
(1999). https://doi.org/10.1117/1.429926 1083-3668 Google Scholar
J. M. Schmitt and
G. Kumar,
“Optical scattering properties of soft tissue: a discrete particle model,”
Appl. Opt., 37 2788
–2797
(1998). 0003-6935 Google Scholar
P. B. Wells,
A. T. Yeh, and
J. D. Humphrey,
“Influence of glycerol on the mechanical behavior and thermal damage susceptibility of collagenous tissues,”
IEEE Trans. Biomed. Eng., 53
(4), 747
–753
(2006). https://doi.org/10.1109/TBME.2006.870232 0018-9294 Google Scholar
G. Vargas,
K. F. Chan,
J. K. Barton, H. G. Rylander 3rd, A. J. Welch,
“Use of osmotically active agents to alter optical properties of tissue: effects on the detected fluorescence signal measured through skin,”
Lasers Surg. Med., 29 213
–220
(2001). https://doi.org/10.1002/lsm.1110 0196-8092 Google Scholar
M. G. Ghosn,
V. V. Tuchin, and
K. V. Larin,
“Depth-resolved monitoring of glucose diffusion in tissues by using optical coherence tomography,”
Opt. Lett., 31
(15), 2314
–2316
(2006). https://doi.org/10.1364/OL.31.002314 0146-9592 Google Scholar
M. G. Ghosn,
V. V. Tuchin, and
K. V. Larin,
“Nondestructive quantification of analyte diffusion in cornea and sclera using optical coherence tomography,”
Invest. Ophthalmol. Visual Sci., 48
(6), 2726
–2733
(2007). https://doi.org/10.1167/iovs.06-1331 0146-0404 Google Scholar
K. V. Larin,
M. G. Ghosn,
S. N. Ivers,
A. Tellez, and
J. F. Granada,
“Quantification of glucose diffusion in arterial tissues by using optical coherence tomography,”
Laser Phys. Lett., 4
(4), 312
–317
(2007). https://doi.org/10.1002/lapl.200610111 1612-2011 Google Scholar
K. V. Larin and
M. Ghosn,
“Influence of experimental conditions on drug diffusion in cornea,”
Quantum Electron., 36
(12), 1083
–1088
(2006). https://doi.org/10.1070/QE2006v036n12ABEH013225 1063-7818 Google Scholar
R. O. Esenaliev,
K. V. Larin,
I. V. Larina, and
M. Motamedi,
“Noninvasive monitoring of glucose concentration with optical coherence tomography,”
Opt. Lett., 26
(13), 992
–994
(2001). 0146-9592 Google Scholar
K. V. Larin,
M. S. Eledrisi,
M. Motamedi, and
R. O. Esenaliev,
“Noninvasive blood glucose monitoring with optical coherence tomography—a pilot study in human subjects,”
Diabetes Care, 25
(12), 2263
(2002). https://doi.org/10.2337/diacare.25.12.2263 0149-5992 Google Scholar
K. V. Larin,
M. Motamedi,
T. V. Ashitkov, and
R. O. Esenaliev,
“Specificity of noninvasive blood glucose sensing using optical coherence tomography technique: a pilot study,”
Phys. Med. Biol., 48
(10), 1371
(2003). https://doi.org/10.1088/0031-9155/48/10/310 0031-9155 Google Scholar
L. A. Remington, Clinical Anatomy of the Visual System, Elsevier, St. Louis, MO
(2005). Google Scholar
|


