
|
|
1.IntroductionLight-scattering spectroscopy (LSS) has proven to be a powerful tool for the characterization of tissue morphology, and in particular for cancer screening based on the light scattered from the nuclei of epithelial cells.1 Intensity scattering spectra as a function of wavelength1 or angle2, 3 can effectively determine nuclear size and index of refraction, with enlargement of nuclei interpreted as one indication of dysplastic or cancerous samples. Normal cell nuclei have diameters between 4 and , while dysplastic nuclei might enlarge to as much as .1 Optical coherence tomography (OCT) is a powerful technique for depth imaging of tissue in vivo by use of low-coherence interferometry.4 It has been shown that LSS can be combined practically with OCT to provide depth selectivity to scattered light.5 Present applications of LSS measured by OCT have neglected to investigate the potential value added from the ability to measure phase spectra using this technology. To date, experimental efforts have focused almost exclusively on the measurement and analysis of intensity scattering spectra.5, 6 We recently demonstrated that phase scattering spectra can also be used to determine the size and/or refractive index of scatterers.7 In that work, we discovered that even for the simplest case of a single scatterer, the phase and intensity spectra are, in general, independent (“nonminimum phase”). Therefore, each quantity must be measured independently, as neither can be inferred from the other. We expect this independence to hold for more complicated samples, such as tissue, in which the scatterers are located at different depths within a volume. Therefore, the measurement of phase together with intensity will more completely characterize the scattering material. We anticipate that this characterization will, in turn, provide further insight into the health of the tissue. Additionally, we find that existing analyses of scattering spectra to quantify size distributions of scatterers presently lack a rigorous analysis of the uncertainty in these quantifications. Concerning the use of this technology as well as any other bioimaging modality, it is increasingly apparent that both absolute quantification and the associated uncertainty analysis are equally important for use in biomedical applications.8, 9 In an attempt to demonstrate consistency and broad validation of our results through controlled diversity, this paper describes two different OCT techniques, two types of phantoms, and two different interferometer topologies. A brief outline of this paper follows. In Ref. 7, we presented a preliminary result for the phase scattering spectra from multiple spherical scatterers. Here we expand upon that result in Sec. 2, demonstrating the quantitative sizing of the scatterers while discussing the relative merits of size quantification from either intensity or phase spectra. Following this, an automated and robust swept-source OCT system is described that we use to raster scan across a National Institute of Standards and Technology (NIST)-developed surface phantom. This phantom was designed to exhibit a sharp discontinuity between two homogenous populations of polystyrene spherical scatterers with distinct diameters. Using only the phase spectra from the OCT scan, a size image was formed and was compared with the phantom specifications. We also present scattering measurements from a novel phantom composed of a single microsphere suspended by a carbon nanotube and discuss its potential as a calibration artifact for use in comparing intensity and phase measurements with the detailed analytic results of Mie theory. In Sec. 3, we present the tissue-relevant sizing of scatterers using a high-resolution Fourier domain measurement system. In Sec. 4, we present an uncertainty analysis of the spherical sizing obtained with the high-resolution Fourier system. Although we perform our uncertainty analysis only on this last system, with appropriate modifications, this analysis is generally applicable to various sizing techniques that utilize scattering spectra. 2.Measurements with Swept-Source OCT2.1.Swept-Source OCT SystemFigure 1 illustrates one of our swept-source OCT systems for measuring scattering spectra. The light source is a commercial swept laser (Thorlabs ECL5000DT 2 ) with a bandwidth of centered at . The light from the swept laser was combined with a red alignment laser and launched into a single-mode fiber interferometer. For measurements of multiple spheres, the light was formed into a cylindrical beam by use of a fiber collimator. We used the front surface of the sample slide as the reference surface of a common-path interferometer, which provided excellent temporal stability and low material dispersion. In contrast, measurements of a single sphere suspended by a nanotube were conducted with a two-arm Michelson interferometer, with the sample light focused to a spot size of in diameter. For both experimental configurations, the combination of backscattered and reference light was detected with a photoreceiver and sampled by Channel 1 of an analog-to-digital (A/D) circuit board (National Instruments PCI-6122 2). Fig. 1Swept-source OCT measurement system for scattering spectra: LD, laser diode; PD, photodetector; BPD, balanced photodetector; WDM, 1300/1500-nm wavelength-division multiplexer; MZ, Mach-Zehnder; Col, fiber collimator; Gap, adjustable air gap. 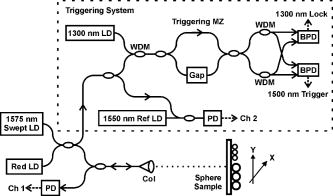 The dashed box in Fig. 1 shows our drift-free system for uniform frequency triggering and absolute wavelength calibration for the samples of Channel 1. We used a Mach-Zehnder interferometer topology to create zero-crossing triggers from the balanced detection of interference fringes of the 1575-nm swept source. Wavelength-division multiplexers and a second balanced photodetector were used to copropagate and separately detect the light from a stabilized 1300-nm laser, which created an error signal to monitor drift. The trigger interferometer was stabilized by applying the error signal as feedback to the adjustable air gap. The swept measurement laser was also combined with a stabilized reference laser at , resulting in a momentary beat-note signal on Channel 2 of the A/D board for coincident wavelengths. By knowing the exact frequency of one sample and the precise spacing between all samples, we were able to determine the absolute frequency of each sample of Channel 1. Our measurement technique for phase was described in detail previously,7 and involves using the method in Ref. 10 to calculate the group delay spectrum from the mirror-image-free complex impulse response. By computing the delay rather than the phase , where , we avoided the linear phase term that results from defining the point of the impulse response. Additionally, the intensity scattering spectrum was calculated by conventional methods of low-coherence interferometry.5 2.2.Quantitative Sizing of Multiple SpheresPolystyrene microspheres were deposited from solution onto 1-mm-thick microscope slides and dried naturally into hexagonally close-packed monolayers, with some spatial voids. The slides were oriented with the sphere depositions on the back surface relative to the collimated measurement beam,6 as shown in Fig. 1. Figures 2a and 2b show measured intensity and phase scattering spectra from separate depositions with 26- and spheres. For each sphere size, the intensity and phase spectra show a strong correlation of fringe features. We have observed as much as an order of magnitude reduction in the amplitude of phase and intensity fringes for scattering from multiple spheres, compared to the amplitudes of phase and intensity fringes for spectra from a single sphere. We believe that part of the reduction was caused by speckle, from our observation that the fringe amplitudes increased in response to a decrease in both the number of spheres illuminated and the acceptance angle of the detection. Also, part of the amplitude reduction may have been caused by the broad size distribution of the spheres, which was as large as 15%, as given in the following. Fig. 2Intensity (dashed line) and phase (solid line) scattering spectra for (a) and (b) polystyrene spheres measured with swept-source OCT. Dotted lines indicate average background slopes and curvatures of the measured spectra. The sizing distributions for polystyrene spheres of diameter (c) and (d) were determined by Fourier analysis of the intensity and phase spectra.  The size of the scatterers was determined by treating the spheres as etalons, dominated by slab-mode scattering,6, 11 and applying a Fourier transform to the measured spectra to identify the dominant optical path differences (OPDs). Here the , where is the refractive index of the sphere, and is its diameter. Figures 2c and 2d show the distributions for the OPD of 26- and spheres, respectively, obtained from both the measured phase and the intensity spectra. The value at zero OPD for each distribution, corresponding to a vertical shift of a spectrum, was set to zero to improve clarity. Based on the location of the peaks, the sphere diameters are calculated to be 24.0 and , assuming a refractive index of 1.58 for polystyrene. The diameters determined are in good agreement with the specified sizes of and , provided by the manufacturers of the microspheres. The resolution of the spherical sizing in this demonstration was limited by the finite wavelength coverage of the spectra and the use of Fourier analysis to determine the dominant OPD. The spectra shown in Fig. 2 cover , centered at . Because of edge effects from the signal processing,7 this recovered bandwidth is smaller than the 112-nm bandwidth of the interferogram. Assuming that the spectral profile of the swept laser was ideally rectangular, the OPD was determined with a resolution of . Treating the polystyrene spheres as etalons with a refractive index of 1.58 resulted in a sphere sizing resolution of . It is possible that improved resolution and sensitivity from the same measurement results could be achieved by curve fitting to predictions from Mie scattering theory. With that approach, approximations to the Mie theory solutions1 or numerical tabulations3 are typically employed. We can also improve the resolution by increasing the spectral coverage of our measurements, as we will demonstrate in Sec. 3. While the intensity and phase spectra agree on the peak OPD for each sphere size, the distributions themselves show slight differences. In particular, each distribution based on intensity contains more content at values of OPD below the peak location than the corresponding distributions based on phase. This is consistent with the observation that the intensity spectra of Figs. 2a and 2b, respectively show a larger background slope (factor of ) and curvature (factor of ). The backgrounds were estimated from polynomial curve fits of low order and are plotted as dotted lines in Figs. 2a and 2b. These effects are difficult to completely normalize because the laser tuning spectrum can vary from sweep to sweep. These effects will have a greater impact on the ability to size smaller spheres, which generate weaker scattering signals and have broader spectral features that more closely resemble background variations. 2.3.Size Imaging of ScatterersWe engineered a surface phantom specifically to test the size-imaging capabilities of the phase dispersion technique. Two slide samples, one with a deposition of spheres and the other with spheres, were butted together and aligned by a metal frame. By depositing the spheres to the very edge of each slide, the butting process created a distinct transition in sphere size on the combined surface. With this simple pattern and known locations for spheres of a given size, we were easily able to validate our imaging results. The operation of the swept-source OCT system was automated to enable error-free repetitive measurements. Particular care was taken to ensure that the software sizing routines were robustly able to handle noisy spectra, weak signals, and wavelength sweeps of varying bandwidth. Each measurement point within an image was the result of spatially compounding four separate measurements ( substeps in a square pattern) to reduce the effect of speckle. The OPD distributions from the four measurements were summed, and the peak of the combined distribution was used to determine the average diameter. The size image shown in Fig. 3 was produced by raster scanning the sample across the measurement beam. The image covers a area in steps and shows a clear distinction between the regions containing 15- and spheres. In the region of spheres, the measured diameter was consistently , with just a single measurement of . We attribute this one odd point to a shortened sweep of the laser’s bandwidth, resulting in a slight increase in the sizing resolution to . In the region of spheres, the measured diameters are split between values of 24.0 and , due to the resolution of the system. The average measured size of the spheres in this region was , showing a slight disagreement with the specified size. We suspect that the disagreement is caused by speckle as well as an increase in the angular structure of the scattering as the size of the spheres increases.2, 3 2.4.Sphere-Nanotube PhantomIn 1908, Gustav Mie provided a complete solution to the scattering of an electromagnetic plane wave by a homogenous sphere surrounded by a homogeneous nonabsorbing infinite medium.12, 13, 14 Experimentally, an approximation to this geometry might be achieved by casting the sphere in a curable substance, by floating it in a liquid with neutral buoyancy, or by suspending it in a gas flow. However, most potential liquid or solid host materials are optically absorbing, an effect requiring a nontrivial modification of Mie theory, and a flowing sphere can introduce motion artifacts. Furthermore, it would be of great utility to the study of small collections of scatterers if the orientations of the scatters with respect to each other could be precisely controlled rather than randomly distributed. Spheres can be simply supported by a surface, either at normal or angled incidence, but again at the expense of a nontrivial modification of Mie theory.15 A planar surface geometry, which we used extensively in the preceding sizing measurements, does not fully address the orientation of multiple scatterers or allow for volumetric samples that better represent tissue. Figure 4 shows a micrograph of a representative sphere-nanotube phantom we constructed, composed of an polystyrene sphere suspended by an approximately multiwall carbon nanotube. To facilitate handling, the nanotube was attached to the end of a tungsten probe tip. The bonding of the tube to the tip and the sphere was achieved by carbon welding using electron beam–induced deposition.16 The simplicity of this novel structure, and its approximation to an isolated sphere in free space, suggests the application as a quantitative calibration artifact for light scattering measurements. In addition, a collection of these sphere-nanotube structures, each held by an independent micro-positioner, could potentially be brought into a precise alignment, enabling the construction of designer phantoms. Fig. 4A micrograph of a typical sphere-nanotube structure that we constructed, consisting of an sphere suspended by a -diam multiwall carbon nanotube. The novel structure was used to compare measured scattering spectra to Mie theory calculations.  We measured the scattering spectra of a similar sphere-nanotube phantom with a larger sphere using our swept-source OCT system in a two-arm Michelson interferometry configuration. Two arms were required by this phantom to provide an optical reference surface in the absence of a front surface from a sample slide. To increase the detected backscatter power, the incident measurement light was focused to a spot size about twice the diameter of the sphere. According to the work of Xu, 17 if the spot size is equal to or greater than the diameter of a scatterer that is large compared to the wavelength of light, the scattering spectrum is essentially identical to that generated from an ideal plane wave. Figures 5a and 5b show the measured intensity and phase scattering spectra of the novel phantom, each acquired from the same interferogram. The theory curves are the Mie calculation for a sphere in air with a diameter of and a complex refractive index of . To aid visual comparison, the intensity spectra were normalized to their peak values, while constant delays were applied to the group delay curves. For intensity, the measurement and theory curves agree quite well, with a strong overall correspondence of features between the curves. However, despite this agreement, the comparison between measurement and theory curves for phase (group delay) is more complicated, showing correspondence for the location of spectral features but dramatic differences such as the inversion near . Our inability to achieve the desired quantitative agreement for the phase measurement may have resulted from both an observed sensitivity to the precise alignment of the focused light and the high index contrast between the sphere and the surrounding air. The high index contrast results in a relatively high quality-factor for the optical resonance within the sphere. The high increases the sensitivity to the optical coupling, making our Mie theory more sensitive to the exact measurement parameters. The index contrast could have been reduced by submerging the sphere in a denser material; however, this would have introduced optical absorption, which is not accounted for by Mie theory. Fig. 5(a) Intensity and (b) phase-scattering spectra for a novel sphere-nanotube structure. Measurements were performed with swept-source OCT; calculations are Mie theory for a scatterer with complex index . The minimum phase curve is a prediction based on the Mie theory intensity curve.  The condition of minimum phase implies that one type of scattering spectrum can in principle be predicted from the other by applying the Kramers-Kronig relation.7, 18 Shown in Fig. 5b is a minimum-phase prediction for the group delay based on the theoretical intensity spectrum of Fig. 5a. The prediction does not agree with the Mie theory calculation of phase and clearly indicates that to obtain the phase spectrum, it must be measured rather than inferred. In Fig. 5, the relative agreement of the intensity spectra contrasted by the disparity between the phase spectra may indicate that phase, if accurately measured, may provide a more unique and refined characterization of the underlying physical scattering process. 3.Measurements with Fourier Domain OCT3.1.Fourier Domain OCT SystemTo address the limited sizing resolution of our swept-source OCT demonstration, we constructed a second, high-resolution measurement system based on a supercontinuum source, spectrograph, and photodiode array. This Fourier domain OCT system was modeled after the work of others6, 19 and is currently the only reasonably practical approach to substantially increase the measurement bandwidth to improve resolution. Our implementation is illustrated in Fig. 6 . Again, we utilized a sample beam diameter of for measurements of multiple spheres. The ultrabroadband source was a commercially available nanosecond frequency comb (Koheras Super K Red2) with a low repetition frequency. The source uses a photonic crystal fiber to broaden its spectrum to span from 575 to , with a total output power of . After filtering out visible wavelengths and coupling into single-mode fiber, we obtained roughly of light in the 1200- to region for use in scattering measurements. The home-built spectrograph used a collimated incident beam in diameter, a 600-grooves/mm grating blazed at , and a spherical collection mirror with . The detector was an linear array (Goodrich SU-LDV2) with 1024 elements covering the measurement bandwidth. The pixel spacing corresponded to a wavelength change of , resulting in a single-pass OCT depth range of about in vacuum. We illuminated about 6200 grating lines in the spectrograph, resulting in a wavelength resolution of , which was finer than the pixel spacing. Accurate wavelength calibration of the detector pixels was achieved by correlating the peak location of an incident tunable laser to the actual wavelength recorded by a wavelength meter. Fig. 6Fourier domain OCT system for scattering measurements: Col, collimator; PD, photodiode. The system was specifically designed to address the limited sizing resolution of the swept-source system shown in Fig. 1.  3.2.Tissue-Relevant SizingFigure 7a shows measured group delay spectra from monolayers of 5- and polystyrene spheres deposited on glass cover slips in thickness. The same signal processing conditions were applied to both spectra, resulting in clean fringe features with a wavelength resolution of . By visual inspection, the period of the fringes for the spheres is about three times that of the spheres, as expected from the slab model. The fringe amplitude for spheres is about four times that for spheres. As we will discuss in Sec. 4.1, much of this difference in amplitude (more than a factor of 2) is an artifact of the signal processing conditions. The remainder of the amplitude difference may be explained by the relative numbers of spheres illuminated, their spatial distributions, and the size distributions of the spheres (presented in the following). Fig. 7(a) Phase-dispersion spectra of 5- and spheres measured with Fourier domain OCT. As expected, the fringe period for spheres is about three times that of spheres. (b) The sizing distributions calculated from the phase spectra. The distinction between 5- and spheres is very clear, with sizing resolution.  The normalized OPD distributions for the group delay spectra of Fig. 7a are shown together in Fig. 7b. The measured sphere sizes were calculated to be and (see the following section for the derivation of the uncertainty estimate), assuming a refractive index of 1.58 for polystyrene. These results are in good agreement with the median sizes of and provided by the microsphere manufacturer. In contrast to the swept-source scattering measurements, the sizing interval of spheres has been reduced from to , with four discrete intervals separating the peaks for 5- and spheres in Fig. 7b. This result represents tissue-relevant sizing,1 since normal cell nuclei typically have diameters of about , while enlarged, precancerous nuclei can be as large as . Even without the utilization of more optical bandwidth, the system has the potential for the intermediary sizing of scatterers due to the reduced sizing interval. As compared to our swept-source system, more subtle changes in tissue can now be detected, possibly at earlier stages of progression. For practical limitations, such as the finite number of array pixels, further improvements to sizing sensitivity and resolution may best be gained by implementing a more sophisticated spectral analysis based on Mie theory approximations and numerical tabulations.1, 3 The broadband spectrometer OCT system can be adapted to raster scanning and the formation of images such as Fig. 3 with improvements to automated operation. 4.Uncertainty AnalysisA complete NIST uncertainty analysis20, 21 of our scattering measurements using OCT is premature at this stage of development and beyond the scope of this paper. However, to enhance the quantitative value of our measurement results, and more generally to initiate a dialog on the uncertainty for this type of scattering measurement, we outline here an estimate. In general, the result of a measurement is only an approximation to the true value of a quantity, while the attached uncertainty describes the confidence in the measurement result. Many factors may contribute to the uncertainty, and they can be classified based on whether they are estimated from either modeled or statistical methods. While the uncertainty may depend on both the resolution and the repeatability of a measurement, the uncertainty is fundamentally a different quantity. Resolution describes how finely a quantity can be distinguished, while repeatability describes the consistency of a measurement. The result of a measurement can have both high resolution and repeatability but a large uncertainty caused by a large, systematic, and unknown offset from the true value. Our uncertainty estimate for the sizing of spheres using broadband Fourier domain OCT to measure phase spectra considered four components: processing sensitivity, sizing resolution, spectral normalization, and detector intensity calibration. Aside from the spectral normalization component, the estimation methods we describe are general and equally applicable to sizing methods using either phase or intensity spectra. 4.1.Signal ProcessingThe visual appearance of recovered scattering spectra can depend heavily on the conditions of the signal processing, and in turn the appearance of the spectra can influence the detected size of scatterers. After a measured frequency-domain interferogram is inverse-Fourier transformed, the resulting complex time-domain (spatial domain) impulse response is windowed to isolate the signal generated by the scatterers from secondary surface reflections, autocorrelations, and noise. To recover both spectra shown in Fig. 7a, the same tapered Blackman-Harris window with a half width at half maximum of was used to treat each measurement equally. This half width was much greater than the OPD of a sphere, and slightly larger than the OPD of a sphere ( for ). Therefore, we anticipate a negligible attenuation of fringe features characteristic of spheres and a reduction of about a factor of two for spheres. This signal processing distortion explains some of the difference in relative amplitude observed previously in Fig. 7a. The windowing greatly reduces the probability of measuring an OPD that is much larger than the chosen half width. Therefore, it is important to recognize a priori the largest scatterer that may be encountered during a measurement, which might be for precancerous human cell nuclei, or at least be aware of the maximum size that can be detected for a given window width. To demonstrate the sensitivity and robustness of the quantitative sizing using phase-dispersion spectra, we reanalyzed the measurement for scattering from spheres shown in Fig. 7 while varying the width of the impulse response window. Figure 8 shows the OPD distributions calculated from the spectra recovered as the window half width varied between 20 and . The OPD distribution for the window is identical to the curve shown in Fig. 7b, with a dominant peak near indicating the detection of spheres. The distribution curves for smaller windows show heavy attenuation of the peak and represent poorly configured analyses that falsely indicate dominant scatterer sizes much smaller than . As the width of the impulse response window increases to , the height of the peak near an OPD of increases, at the expense of more distribution content (noise) at larger OPD. The balance between sensitivity and noise is typical and manifests as a corresponding balance between systematic and random error in an uncertainty budget. For a window half width of , corresponding to the detection of a polystyrene scatterer as large as in diameter, the peak near OPD remains the tallest peak despite a substantial increase in noise. In the limit of an infinitely wide window, effectively corresponding to no signal processing, the height of the peak for spheres is more than double the height obtained with a window. The location of the peak corresponding to spheres varies slightly with an increase in window width, tending toward smaller OPD. The quantitative sizing we originally obtained from Fig. 7b was a slight overestimate compared to the sphere diameter as stated by the manufacturer, so the shift toward smaller OPD is an improvement and results from being able to recover slightly more spectral bandwidth as the window width increases. Sizing distributions computed from intensity spectra can be expected to display a similar dependence on the width of the impulse-response window. Fig. 8Demonstration of the sensitivity and robustness of the quantitative sizing to the spatial width of the impulse response window. Even for a window width three times too large, the correct OPD of still dominates. 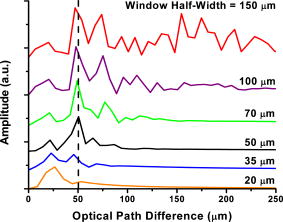 The signal processing sensitivity was used to estimate an uncertainty component. Treating the impulse response window as an approximation to no windowing, the use of a window caused an upward shift in the OPD location of . This corresponded to a maximum possible shift in the sizing diameter of . In the case of unknown probability distributions, the use of a uniform distribution as the maximum unbiased estimate is recommended.20 Therefore, assuming that the maximum shift in sizing diameter defines either the upper or lower bound of a uniform distribution, the uncertainty component due to processing sensitivity was . 4.2.Sizing ResolutionWith our etalon model, sphere size was determined from an OPD distribution as the product of a discrete peak location (measured in integral bins) and the physical sizing interval (i.e., resolution measured in microns). Both of these quantities have associated uncertainties. The peak locations for 5- and spheres were and 7, respectively. We assigned an uncertainty in the peak location of 1/2, based on the average theoretical distance required to just reach the next peak location. The sizing interval is computed as in Sec. 2.2 by the formula and gives a resolution of for the Fourier domain OCT system described in Sec. 3.1 with refractive index . The longest and shortest detected wavelengths ( and ) are not given a priori but, rather, determined from a calibration experiment that maps the pixels of the detector array in Fig. 6 to incident wavelength. As the preceding formula shows, the sizing interval uncertainty depends on this wavelength calibration via the wavelengths of the first and last pixels of the detector array. A covariance matrix for the wavelength calibration was calculated from the calibration data of correlated pixel location and tunable laser wavelength. Combining the peak distribution locations and their uncertainty with the sizing interval and the wavelength covariance matrix using an error propagation method,20 we obtained an uncertainty in sizing due to resolution of . The uncertainty due to resolution is nearly independent of size for small spheres because the contribution from the wavelength calibration is negligibly small.4.3.Spectral Normalization and Detector IntensityThe measurement of phase spectra is inherently independent of the spectral shape of the illuminating source to first order. In contrast, intensity spectra require spectral normalization, resulting in the division of two measurement results. However, phase measurements can be influenced to second order by signal-to-noise-ratio (SNR) variations caused by spectral shape. Our supercontinuum source intensity varied smoothly by no more than a factor of two across the 280-nm measurement bandwidth, maintaining a high SNR and contributing negligibly to the sizing uncertainty. Due to manufacturing tolerances, the dark current and transimpedence gain of individual pixels varied across the detector array. A average dark current level was accounted for to first order by subtracting shuttered measurements of the array. The transimpedance variation was found to be negligible from measurements of the array under uniform monochromatic illumination. In general, response variations that vary rapidly across the array have little influence on the sizing of small scatterers, which generate broad spectral features, because they are easily removed by the signal processing window. 4.4.Estimated Combined UncertaintyThe total uncertainty is computed as the root-sum-of-squares combination of the component uncertainties. Combining the non-negligible contributions from processing sensitivity and resolution , we obtain a total sizing uncertainty of for spheres between 5 and in diameter. If this estimate represented a complete uncertainty analysis, we would state that our measurement results were within of the true value with a confidence of 68%, or to within with a confidence of 95%. Effectively, we estimate at this time that we can measure spheres with 26% error and spheres with 9% error. 5.ConclusionOur goal was to develop various phantoms and OCT systems that would facilitate a quantitative analysis of measurement uncertainty. We have demonstrated the potential for using phase-dispersion spectra to form images based on the size of spherical scatterers on a surface. A surface phantom was engineered with a distinct transition in scatterer size, which allowed us to easily validate the size-imaging. In the future, combining phase and intensity spectra may be advantageous for weak signal measurements and for the sizing of small scatterers because phase measurements do not involve a spectral normalization. The potential of a novel sphere-nanotube structure was investigated as a quantitative calibration artifact and designer phantom. While the measured intensity spectrum for the sphere-nanotube showed agreement with theory, the phase spectrum did not, possibly due to the high quality factor of the spherical cavity. We also demonstrated sensitive and robust sizing of tissue-relevant scatterers using phase-dispersion spectra measured with broadband Fourier domain OCT. The high resolution was achieved despite using a simple slab-mode resonance model for the sizing. By outlining an uncertainty analysis for our Fourier domain measurement system, we have begun a dialog on quantitative sizing measurements using scattering spectra. While our uncertainty estimate was dominated by the discrete sizing method, substantial reductions may be achieved by using analytic approximations or numerical tabulations. Improving the uncertainty estimates will require experiments designed with tighter control and isolation of the experimental parameters. Future investigations should consider more complicated, tissue-like samples composed of dense materials such as optical gels embedded with scatterers. The reduction in index contrast would result in weaker scattering signals (lower ), which would be more difficult to detect but may improve measurement repeatability. Furthermore, the scatterers would be distributed throughout a volume, increasing the complexity of the speckle geometry and requiring greater utilization of the depth selectivity of OCT. In this situation, we anticipate that a combination of information gathered from phase and intensity spectra would provide a more complete picture of the scatterers than a single spectral quantity. We expect that a combined measurement would go beyond simple nuclear sizing to the broader measurement of cell organization and tissue structure, which are other common indicators of tissue health. Furthermore, as illustrated by Adler, 22 spectral intensity modulation alone may not be able to distinguish a single large scatterer from many smaller scatterers in the same volume. A combination of phase and intensity spectra may be able to distinguish between these two disparate cases that otherwise appear degenerate. Both scattering cases are in general non-minimum-phase, and thus the phase spectrum, being related to but in general independent of the intensity spectrum, may provide the distinguishing information. ReferencesL. T. Perelman,
V. Backman,
M. Wallace,
G. Zonios,
R. Manoharan,
A. Nusrat,
S. Shields,
M. Seiler,
C. Lima,
T. Hamano,
I. Itzkan,
J. Van Dam,
J. M. Crawford, and
M. S. Feld,
“Observation of periodic fine structure in reflectance from biological tissue: a new technique for measuring nuclear size distribution,”
Phys. Rev. Lett., 80 627
–630
(1998). https://doi.org/10.1103/PhysRevLett.80.627 0031-9007 Google Scholar
A. Wax,
C. H. Yang,
R. R. Dasari, and
M. S. Feld,
“Measurement of angular distributions by use of low-coherence interferometry for light-scattering spectroscopy,”
Opt. Lett., 26 322
–324
(2001). 0146-9592 Google Scholar
J. W. Pyhtila,
R. N. Graf, and
A. Wax,
“Determining nuclear morphology using an improved angle-resolved low coherence interferometry system,”
Opt. Express, 11 3473
–3484
(2003). 1094-4087 Google Scholar
A. F. Fercher,
W. Drexler,
C. K. Hitzenberger, and
T. Lasser,
“Optical coherence tomography—principles and applications,”
Rep. Prog. Phys., 66 239
–303
(2003). https://doi.org/10.1088/0034-4885/66/2/204 0034-4885 Google Scholar
A. Wax,
C. Yang, and
J. A. Izatt,
“Fourier-domain low-coherence interferometry for light-scattering spectroscopy,”
Opt. Lett., 28 1230
–1232
(2003). https://doi.org/10.1364/OL.28.001230 0146-9592 Google Scholar
R. N. Graf and
A. Wax,
“Nuclear morphology measurements using Fourier domain low coherence interferometry,”
Opt. Express, 13 4693
–4698
(2005). https://doi.org/10.1364/OPEX.13.004693 1094-4087 Google Scholar
S. D. Dyer,
T. Dennis,
L. K. Street,
S. M. Etzel,
T. A. Germer, and
A. Dienstfrey,
“Spectroscopic phase-dispersion optical coherence tomography measurements of scattering phantoms,”
Opt. Express, 14 8138
–8153
(2006). https://doi.org/10.1364/OE.14.008138 1094-4087 Google Scholar
M. Brownstein,
R. A. Hoffman,
R. Levenson,
T. E. Milner,
M. L. Dowell,
P. A. Williams,
G. S. White,
A. K. Gaigalas, and
J. C. Hwang,
“Biophotonic tools in cell and tissue diagnostics,”
J. Res. Natl. Inst. Stand. Technol., 112 139
–152
(2007). 1044-677X Google Scholar
P. H. Tomlins and
R. K. Wang,
“Theory, developments, and applications of optical coherence tomography,”
J. Phys. D, 38 2519
–2535
(2005). https://doi.org/10.1088/0022-3727/38/15/002 0022-3727 Google Scholar
V. Laude,
“Noise analysis of the measurement of group delay in Fourier white-light interferometric cross correlation,”
J. Opt. Soc. Am. B, 19 1001
–1008
(2002). 0740-3224 Google Scholar
Y. Liu,
X. Li,
Y. L. Kim, and
V. Backman,
“Elastic backscattering spectroscopic microscopy,”
Opt. Lett., 30 2445
–2447
(2005). https://doi.org/10.1364/OL.30.002445 0146-9592 Google Scholar
G. Mie,
“Beitrage zur Optik trüber Medien speziell kolloidaler Metallösungen,”
Ann. Phys., 25 377
–445
(1908). https://doi.org/10.1002/andp.19083300302 0003-3804 Google Scholar
C. F. Bohren and
D. R. Huffman,
“Absorption and scattering by a sphere,”
Absorption and Scattering of Light by Small Particles, 82
–129 John Wiley & Sons, New York (1983). Google Scholar
H. C. van de Hulst,
“Rigorous scattering theory for spheres of arbitrary size (Mie theory),”
Light Scattering by Small Particles, Dover, New York (1981). Google Scholar
P. A. Bobbert and
J. Vlieger,
“Light scattering by a sphere on a substrate,”
Physica A, 137A 209
–242
(1986). https://doi.org/10.1016/0378-4371(86)90072-5 0378-4371 Google Scholar
F. Banhart,
“The formation of a connection between carbon nanotubes in an electron beam,”
Nano Lett., 1 329
–332
(2001). https://doi.org/10.1021/nl015541g 1530-6984 Google Scholar
C. Xu,
P. S. Carney, and
S. A. Boppart,
“Wavelength-dependent scattering in spectroscopic optical coherence tomography,”
Opt. Express, 13 5450
–5462
(2005). https://doi.org/10.1364/OPEX.13.005450 1094-4087 Google Scholar
A. Ozcan,
M. J. F. Digonnet, and
G. S. Kino,
“Characterization of fiber Bragg gratings using spectral interferometry based on minimum-phase functions,”
J. Lightwave Technol., 24 1739
–1757
(2006). https://doi.org/10.1109/JLT.2006.871111 0733-8724 Google Scholar
S. Yun,
G. Tearney,
B. Bouma,
B. Park, and
J. de Boer,
“High-speed spectral-domain optical coherence tomography at wavelength,”
Opt. Express, 11 3598
–3604
(2003). 1094-4087 Google Scholar
B. N. Taylor and
C. E. Kuyatt,
“Guidelines for evaluating and expressing the uncertainty of NIST measurement results,”
(1994) Google Scholar
J. R. Taylor, An Introduction to Error Analysis, University Science Books, Sausalito, CA (1997). Google Scholar
D. C. Adler,
T. H. Ko,
P. R. Herz, and
J. G. Fujimoto,
“Optical coherence tomography contrast enhancement using spectroscopic analysis with spectral autocorrelation,”
Opt. Express, 12 5487
–5501
(2004). https://doi.org/10.1364/OPEX.12.005487 1094-4087 Google Scholar
Notes2Certain commercial equipment, instruments, or materials are identified in this paper in order to specify the experimental procedure adequately. Such identification is not intended to imply recommendation or endorsement by the National Institute of Standards and Technology, nor is it intended to imply that the materials or equipment identified are necessarily the best available for the purpose. |


