|
|
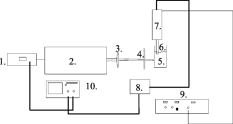
1.IntroductionPhantoms are used as tools in developing imaging techniques to detect tissue structures, tumors, and blood vessels, as well as to monitor different constituents of a sample.1 By using different materials and particles as well as by changing the structure and concentrations of these samples, it is possible to imitate the optical properties of human tissue, such as skin. Optical techniques are widely studied due to their nondestructive nature. Among the most investigated optical methods for imaging purposes2 and for constituent monitoring are optical coherence tomography (OCT), pulsed photoacoustic (PA), and time-of-flight (TOF) techniques. OCT is based on using an interferometer to detect photons that are backscattered from a sample. It has been used for imaging eye3, 4, 5 and skin tissue structures6 with a high resolution. The PA technique, on the other hand, is based on the detection of pressure waves generated by short laser pulses absorbed in a sample. This technique has its main applications in the imaging of strongly absorbing targets such as blood vessels7, 8 and tumors.9 It can also be used for measuring blood oxygenation.10 The TOF technique is based on detecting the transit time of short laser pulses.11 Photon migration studies involve measuring the shapes of laser pulses that have traveled through the investigated sample. Since its application to distance measurements,12 the TOF technique has also been applied to optical mammography.13 Both the OCT and PA techniques have been used in noninvasive glucose monitoring in vitro 14, 15 and in vivo,16, 17 while the TOF technique based on photon migration has been applied to monitoring glucose in vitro.18, 19 This article compares the usability of the OCT, PA, and TOF techniques for detecting changes in the scattering properties of a sample. Their capability to monitor glucose-induced changes in scattering are discussed in more detail. Studies with different kinds of phantoms facilitate the optimization of measurement systems. Intralipid has been used as a tissue-simulating phantom, because it is turbid and its scattering properties mimic those of human skin. Intralipid samples with different concentrations are easy to prepare, and changes in concentration mainly affect their scattering properties.20 This paper is an improved and extended version of the conference paper21 presented at the Saratov Fall Meeting Conference in September 2005. The phenomenon has also been discussed in Ref. 22. 2.Background of Experimental Techniques2.1.Optical Coherence TomographyOCT is a high-resolution imaging technique.3 It is based on an interferometer consisting of a low-coherence light source with a broad spectral width, a detector and a beam splitter, as well as sample and reference arms. As the light source, the system may use a superluminescense diode (SLD) or a pulsed laser with a femtosecond pulse duration. A scanner placed in the reference arm changes the arm’s length, allowing photons backscattered from the sample to be collected from different depths. The detection of these backscattering photons is based on observing interference between photons coming from the sample and reference arms. To form interference, the path length difference of these photons has to be smaller than the coherence length of the light source. Theoretical background and signal formation of OCT is described in more detail in Refs. 4, 23, 24, 25, 26, while applications of OCT are discussed in Ref. 26. 2.2.Pulsed Photoacoustic TechniqueThe pulsed photoacoustic technique is based on the photoacoustic effect, in which short laser pulses are used to generate pressure waves. Incident photons that are absorbed in the sample increase its temperature and induce a volumetric expansion. A semiquantitative explanation of the photoacoustic effect is given in the following presentation. To start with, the temperature rise induced by the absorption of photons can be described as: where and are the specific heat and density in the optically absorbed volume , and is the absorbed energy. This temperature rise induces changes in pressure in accordance with:where is the thermal expansion coefficient, and is the speed of sound in the optical absorption region. The expression is a temperature function that depends on the produced thermal energy being converted to mechanical stress, known as the Grüneisen parameter . is the absorbed optical energy density and equals the product of the laser fluence and the tissue absorption coefficient . It is useful to highlight that the pressure change is proportional to the optical absorption coefficient.Also the scattering properties of a sample may affect the PA signal. Changes in the sample’s optical scattering properties will alter the optical energy distribution and the energy fluence in the PA sound source and, hence, the PA pulse intensity.27, 28 The shape of the acoustic sound source, be it flat, cylindrical, or spherical, is defined by the sample’s optical properties. To generate acoustic waves with optical pulses in the nanosecond range, confined stress conditions have to be satisfied. In scattering-dominated media, these include the following requirements: (1) Stress has to be limited to the thermal elastic expansion volume and must not be allowed to relax during irradiation, and (2) and [ is the stress relaxation time, i.e., the time it takes for sound to propagate through the thickness of the irradiated region; is the laser pulse duration; and is the heat diffusion time] or . is the effective attenuation coefficient [ is the reduced scattering coefficient and can be defined by , where is the scattering coefficient, and is the anisotropy factor].28, 29, 30 2.3.Time-of-Flight TechniqueThe TOF technique is based on measuring the flight time of short laser pulses in the sample and the shape and arrival time of laser pulses in photon migration studies. Laser pulses can be detected in both the transmittance and the reflectance (backscattered) modes, which enhances the applicability of this technique. In highly scattering materials, incident photons undergo multiple scattering, producing random changes in their flight times and path lengths. As a result, the temporal profiles of the incident laser pulses reaching the detector will be modified. The process of light scattering in a turbid suspension can be described by the nonstationary radiative transport equation (also known as the Boltzmann transport equation).31 Diffuse approximation of this equation and its boundary conditions, as well as TOF and photon migration applications, are described in Refs. 31, 32, 33, 34, 35, 36, 37. Figure 1 introduces the basics of the measurement techniques, which differ in nature. OCT is based on detecting backscattered photons with an interferometer (a), the PA technique is based on detecting acoustic waves generated by the photoacoustic effect (b), and the TOF technique is based on measuring the laser pulse profiles and the average transit time (c). 2.4.Matching of Refractive IndexesIncreasing the glucose concentration of a medium increases its refractive index38 and reduces the refractive index mismatch between the medium’s scattering centers and its bulk material. The OCT technique relies mainly on measuring changes in the medium’s scattering properties. In noninvasive glucose monitoring, this is accomplished by analyzing changes in the OCT signal’s slope value, fitted to the depth profile at a certain depth. In the first approximation, light attenuation according to the Beer-Lambert law can be used ( is the incident light intensity, is the detected light intensity, , and is distance). In TOF signals, the effect of glucose manifests itself predominantly as a change in the rising part of the pulse and in pulse intensity. These changes are largely related to changes in the medium’s scattering properties, while changes in absorption play a minor role. In the PA technique, the effect of glucose can be analyzed by detecting changes in the peak-to-peak (PP) value of laser-induced pressure waves. This can be done, because glucose affects the Grüneisen parameter and the energy density distribution in the photoacoustic sound source. 3.Materials and Devices3.1.IntralipidIntralipid is an intravenous nutrient consisting of an emulsion of phospholipid micelles and water. It is a turbid medium with a relatively inert chemical nature. Its scattering properties dominate over absorption properties.39 The optical parameters ( , , and ) of Intralipid are wavelength dependent.39, 40 Phospholipid micelles are generally spherical in shape, and their size varies between 25 and , the average and standard deviation being and , respectively.40 The smallest particles show the largest deviation from the spherical shape, and due to their small size, they can be treated as Rayleigh scatterers. The acoustic impedance of Intralipid is almost identical to that of water. In our experiments, different Intralipid concentrations were prepared by diluting 10% Intralipid (Fresenius Kabi AB, Uppsala, Sweden) with distilled water. Many publications show that is nonlinearly dependent on concentration.41, 42, 43 Moreover, the results by Zaccanti 42 demonstrate that also the values of and change when the particle concentration of Intralipid increases. According to Ref. 40, the refractive index of 10% Intralipid is about 1.337 at the wavelength of ( and ). 3.2.GlucoseOur experiments were conducted using D-Glucose ( , , Merck, Eurolab), which was added to samples at concentrations of 1000 and . Large concentrations were used, because the effect of glucose on the optical properties of Intralipid is very weak. 3.3.Experimental Devices3.3.1.OCTThis study employed a commercial OCT device manufactured by the Institute of Applied Physics, Nizhny Novgorod, Russia. Its light source had a wavelength of , and the spectrum width was . With a Doppler frequency of , the device’s axial resolution in air was and its lateral resolution was without any magnification in the probe. The device was controlled with a PC via a USB channel. Signals were measured with a fiber optic probe and saved on the computer. Scanning of sample surfaces was accomplished by a scanner, placed inside the optical probe. This scanner’s adjustable scanning range along the and axes was between 0 and . The inner diameter of the optical fiber tip was , the diameter of the cladding was , and the outside diameter was . The size of the focus point was , when in the center of the probe’s focal range and with the magnification of the optics set at 1.4. Both the diameter of the probing beam and the lateral scanning range increase proportionally with the magnification rate of the output lens. The numerical aperture of the optical fiber was in the range of 0.13 to 0.15. Figure 2a shows a schematic diagram of the setup used in the OCT experiments, and Fig. 2b illustrates the setup of the optical probe and sample. The optical probe was aligned perpendicular to the sample surface, just above the sample surface. 3.3.2.PA techniqueA diode-pumped solid state Nd:YAG laser with a passive Q-switched crystal (Model LCS-DTL-112QT) was used in the PA measurements. This Nd:YAG-laser produced laser pulses at 1064 and , with an energy of and , respectively. Its pulse repetition rate was , and its pulse length was . A photoacoustic transducer, made of a -thick polyvinylidene difluoride (PVDF) material, was used for pressure wave detection. The preamplifier had 40-dB gain and a bandwidth of , while the three-stage inverting main amplifier had a gain of . To measure the signals, the setup employed a Tektronix TDS 420A 4-channel digital oscilloscope. All measurements were performed by immersing the acoustic transducer into a liquid placed in a cuvette measuring (length and width, respectively). Figure 3 shows the experimental PA setup. 3.3.3.TOF techniqueInformation about the shapes of laser pulses was acquired by using a streak camera as detector. As the light source in photon migration measurements, we used a diode laser with a wavelength of , spectral width of , and full width at half maximum (FWHM) of . To obtain a good incoming pulse profile without a tail required adjusting the laser’s temperature. The laser’s pulse repetition rate was , and the energy of each pulse . All samples were measured through a 1-cm glass slab cuvette (with a glass thickness of ) such that the laser beam was focused perpendicular to the cuvette wall. Transmitted light was then directed via a mirror and detected by a HAMAMATSU streak camera with a time resolution of . Images from the cathode ray tube were photographed by a CCD camera and saved on the computer (using the HPD-TA HAMAMATSU program). Figure 4 shows a schematic diagram of the setup used in the TOF studies. Fig. 4Schematic diagram of the setup used in the TOF experiments: 1—picosecond laser module, 2—blanking unit, 3—fast speed sweep unit, 4—streak camera, 5—digital camera, 6—PC, 7—camera controller, 8—power supply unit, and 9—delay unit. 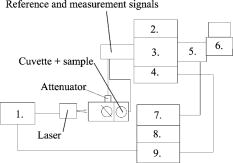 More detailed descriptions of the measurement setups used in this study can be found elsewhere. 18, 44, 45, 46, 47 3.4.Registered Signal ParametersChanges in the samples’ scattering properties were detected by registering the following signal parameters with different techniques: OCT signal slope value, PA signal PP value as well as the width (FWHM), amplitude and arrival time of the maximum of the photons’ TOF distribution. Figure 5 shows how these parameters were determined. Figure 5a shows the fitting of a line to the depth profile of an OCT signal, Fig. 5b shows the determination of the PP value of a PA signal, and Fig. 5c shows the registered pulse parameters in the TOF technique. 4.Results4.1.Effect of IntralipidFirst, the capabilities of the three techniques were demonstrated and compared by varying the Intralipid concentration of test samples. Increasing Intralipid concentration induces different changes in signals measured by the OCT, PA, and TOF techniques. In the OCT technique, an increase in Intralipid concentration raises the signal’s slope value, whereas in the PA technique, the PP value of the PA signal decreases and its pulse maximum shifts to later times. In photon migration studies, changes can be observed in pulse amplitude, pulse width, and the arrival time of the pulse maximum. Additional parameters can also be determined to show changes in the scattering and absorption of light.48, 49 Raising Intralipid concentration from 1% to 2% resulted in a 103.45% increase in the OCT slope value, a 14.40% decrease in the PP value of PA signals, a 64.69% decrease in TOF pulse amplitude, a 27.7% increase in pulse width, and a 69.05% increase in pulse delay. Raising the Intralipid concentration to 5% increased the OCT slope value by 390.89%, increased the TOF pulse width by 102.7%, delayed the pulse maximum by 207.14%, and decreased the pulse intensity by 91.78%. It is assumed in the Intralipid experiments that increasing concentration mainly affects the scattering properties of the measured sample.20 The values presented earlier show that the effect of changing Intralipid concentration is largest on the slope value of the OCT signal and smallest on the PP value of the PA signal. Values for the TOF measurements were obtained without optical fibers. Although optical fibers have the advantage of simultaneously measuring back scattered photons at several distances from the emitting fiber,50 the measurement results show that they greatly diminish the optical power delivered to the sample, thereby lowering the system’s resolution and detection sensitivity.18 4.2.Effect of GlucoseAt the next stage, the effect of adding glucose to 1%, 2%, and 5% Intralipid suspensions was studied using the three techniques under consideration. Table 1 , a modified version of that given in Ref. 22, presents the main results of the glucose and Intralipid experiments. Table 1Comparison of glucose-induced changes in signals measured from Intralipid with a glucose concentration of 1000mg∕dl .
Contrary to earlier results producing a 4.4% change51 in the slope value of the OCT signal in 5% Intralipid, the present results44 show a change of only 1.6%. According to Monte Carlo simulations, the effect of glucose on the OCT signal’s slope value should be larger in 2% Intralipid than in 5% Intralipid.51 This prediction is borne out by our experiments,44 and the obtained value for 2% Intralipid (3.9%) was indeed larger than that for 5% Intralipid (1.6%). As for PA measurements, glucose-induced changes of 2.74% and 5.49% were recorded in the PP values of PA signals in 1% Intralipid in different sets of experiments.45, 46, 47 Results of measurements on the effects of adding glucose to water and to 1% and 2% Intralipid samples show that increased glucose concentration raises the recorded PP value in both media. In water, the effect of adding of glucose varied in the range of 6 to 14%, while the corresponding range for 1% and 2% Intralipid was 6 to 9% and 6 to 14%, respectively, in two different measurements on different days. In agreement with Ref. 52, these results indicate that, in low-scattering suspensions, the PA signal is not much affected by glucose-induced changes in scattering. Thus, the paremeters , , and , which are affected by glucose,29 form the basis for detecting glucose-induced changes in low-concentration Intralipid suspensions. The results of photon migration studies indicate that the addition of glucose has a larger effect on the transmitted pulse’s amplitude than on its width and the maximum’s arrival time.45, 47 Detecting glucose-induced changes in 2% Intralipid by the TOF technique using optical fibers suffered from poor accuracy and resolution,18 produced partly by the low output energy of the picosecond laser module. 5.DiscussionThe results show that a change in Intralipid concentration has a much stronger effect on the slope value of OCT signals than on the PP value of PA signals . This can be explained by the fact that OCT relies on detecting changes in the light scattering properties and refractive index of Intralipid suspensions, whereas the PA technique is based on the absorption of photons that generate pressure waves. A change in the scattering property of Intralipid produces a corresponding alteration in the energy density of the sound source and, consequently, the PP value of the PA signal. In photon migration studies, photons are scattered and absorbed in the sample through which they propagate. As their paths constantly change over the whole sample depth, the cuvette’s length affects the strength of these scattering-induced changes. Multiple scattering photons are observable as a broadening of the pulse. Both single scattering and multiple scattering change the energy density of the PA sound source in weakly absorbing samples, but the effect of increasing the Intralipid concentration from 1% to 2% is less noticeable in the PA signal than in the TOF signal. This effect is less evident in the PA signal, due to the complicated energy conversion process required to generate pressure waves. Detected laser pulses in the TOF technique yield information about the total path length of photons, be they ballistic, snake, or diffuse photons. Typically, early arriving, i.e., ballistic and snake, photons are used in imaging. Interestingly, the same photons are the most important in determining changes in the scattering properties of samples. OCT, on the other hand, provides information obtained from specific depths within a sample. The TOF technique’s resolution is reduced by multiple scattering photons, but because OCT collects backscattered photons that have not lost their coherent properties, the number of multiple scattering photons in OCT signals is much smaller. The OCT, PA, and TOF techniques are different in origin. As a result, they have different optimal application areas and different components are used in these applications. Properties needed to sense glucose-induced changes in the scattering properties of a sample are presented in Table 2 , including detection principle, power or energy of light source, possible wavelengths, probing depth, and possibly determined optical parameters. Data in the table were collected with experimental devices in the Optoelectronics and Measurement Techniques Laboratory at the University of Oulu, Finland, as well as from relevant literature. Table 2Properties of the techniques used affecting glucose detection sensitivity.
Providing a comparison of the techniques is a demanding task, because the OCT, PA, and TOF techniques involve different experimental geometries. In OCT experiments, the optical probe must always be kept in the same position near the sample surface to improve accuracy. In that way, the position of the focus in the sample remains unchanged. The observed glucose-induced changes in the OCT and PA signals are relatively similar. Experiments with glucose in Intralipid phantoms show disparate results. In PA measurements, when the transducer is immersed in the liquid, a change in the position of the acoustic transducer relative to the incoming laser beam as well as the detection distance has a clear effect and may explain the disparate results for water and 1% and 2% Intralipid.45, 46, 47 In 2% Intralipid, the variation in results obtained with the TOF technique are caused by the use of optical fibers, variations in the incoming laser pulses, and different geometries of the cuvettes used.18, 45, 47 Also signal processing and accuracy of sample preparation affect the results. Variations in the shape of the incoming laser pulse can be decreased by averaging. Another important consideration involves stabilizing the setup during the measurements. The measurement results demonstrate that the studied techniques are capable of detecting glucose-induced changes in the optical properties of a sample in a single measurement. However, when the measurement geometry is changed, the results may vary. Thus, future research should study the repeatability of the measurements in more detail. The absorption capacity of Intralipid suspensions is assumed to equal that of water. Because absorption changes as a function of wavelength, the photoacoustic effect varies at different wavelengths. Results in Ref. 45 show that PA systems can be used to detect changes in scattering properties at , but not at . This is due to the different absorption properties of water at these wavelengths.54, 55 Also the scattering coefficient of Intralipid changes as a function of wavelength.40 Thus, the effect of glucose on the measured signals will be different with different techniques at different wavelengths. The devices used in our experiments had different light sources. The picosecond laser module used in the TOF experiments had a pulse energy of , resulting in a low glucose-detection sensitivity. In addition, its long pulse duration prevented us from observing glucose-induced changes in pulse profiles with low glucose concentrations, particularly when using fiber-optic probes.18 A pulsed laser with a pulse duration in the femtosecond range might offer better sensitivity to evaluating the effect of glucose. Also the Nd:YAG laser used in the PA measurements had a fairly low energy output. Due to the conversion of optical energy to acoustic energy, the energy used with the 10-ns laser pulses was insufficient for detecting changes in the PA pulse profiles at low glucose concentrations. Moreover, the achieved accuracy in the detection of pressure waves was not high enough and has to be improved. However, the OCT device has a sufficiently high energy output to enable the detection of scattering-induced changes almost to the depth of , but the position of the light beam’s focus area greatly affects the registered profiles. Problems were confronted in the OCT experiments when focusing the beam into the sample. It was not possible to exactly determine the place of the focus under the surface. We attempted to minimize the effect of the focus plane’s curvature on the results by selecting a narrower lateral scanning range for the optical beam. Conditions in most in vivo measurements necessitate conducting the measurements on the same side of the measured object as the incident light source. This requires specialized sensor design, particularly as the probes cannot be immersed in the sample. Our comparison of the techniques is based on in vitro measurements involving Intralipid suspensions. When aiming toward noninvasive glucose monitoring, biological materials and in vivo measurements would be very important. Fortunately, the effect of glucose has been found to be larger in such conditions with both the OCT and the PA techniques.44, 46 The experiments described in this paper are based on the assumption that changes in Intralipid concentration and increases in glucose concentration mainly affect scattering. Increasing glucose concentration increases the refractive index of the medium and, hence, manifests itself as a scattering change. This basis is not sufficient for the determination of specific glucose concentrations, because many other bodily substances may also change the refractive index mismatch. In the future, more specific methods for detecting glucose should be investigated. These could include the concurrent use of different techniques as well as searching for specific spectral features of each studied technique. 6.ConclusionsOCT shows the largest change in the registered slope value of the recorded signals as a function of increasing Intralipid concentration, whereas changes in laser pulse properties measured with the TOF technique are less pronounced. In contrast, the PA technique shows the smallest signal change when measuring 1% and 2% Intralipid suspensions, indicating that the method lends itself to measuring strongly absorbing targets. In weakly absorbing turbid suspensions, the range of changes induced by the addition of glucose is the same for the OCT slope value, PA PP value, and transmitted pulse amplitude of the photons’ TOF distribution. However, the detection principle of OCT, which enables acquiring information from specific depths, makes it superior to the TOF method. Moreover, unlike the PA technique with a piezoelectric transducer, OCT does not require direct contact with the investigated sample in phantom measurements. It needs to be emphasized that the Grüneisen parameter is affected by glucose and contributes to the glucose-induced change in the PA signal. Thus, since only a minor part of the changes in the PA signal may be caused by changes in scattering, the PA technique differs in principle from the presented glucose-sensing techniques based on optical scattering. Our photon migration studies demonstrate that the long measurement time and small output energy of the picosecond laser module restrict the TOF technique’s applicability to detect glucose-induced changes in the scattering properties of Intralipids. Noninvasive glucose monitoring could benefit from the simultaneous use of different techniques to measure the effect of glucose. AcknowledgmentThe authors express their thanks to the Infotech Oulu Graduate School for financial support during this study. ReferencesB. W. Pogue and
M. S. Patterson,
“Review of tissue simulating phantoms for optical spectroscopy, imaging, and dosimetry,”
J. Biomed. Opt., 11
(4), 041102
(2006). https://doi.org/10.1117/1.2335429 1083-3668 Google Scholar
D. A. Zimnyakov and
V. V. Tuchin,
“Optical tomography of tissues,”
Quantum Electron., 32 849
–867
(2002). https://doi.org/10.1070/QE2002v032n10ABEH002307 1063-7818 Google Scholar
D. Huang,
E. A. Swanson,
C. P. Lin,
J. S. Schuman,
W. G. Stinson,
W. Chang,
M. R. Hee,
T. Flotte,
K. Gregory,
C. A. Puliafito, and
J. G. Fujimoto,
“Optical coherence tomography,”
Science, 254 1178
–1181
(1991). https://doi.org/10.1126/science.1957169 0036-8075 Google Scholar
W. Drexler,
“Ultrahigh-resolution optical coherence tomography,”
J. Biomed. Opt., 9 47
–74
(2004). https://doi.org/10.1117/1.1629679 1083-3668 Google Scholar
M. Hee,
J. A. Izatt,
E. A. Swanson,
D. Huang,
J. S. Schuman,
C. P. Lin,
C. A. Puliafito, and
J. G. Fujimoto,
“Optical coherence tomography of the human retina,”
Arch. Ophthalmol. (Chicago), 113 325
–332
(1995). 0003-9950 Google Scholar
J. Welzel,
E. Lankenau,
R. Birngruber, and
R. Engelhardt,
“Optical coherence tomography of the human skin,”
J. Am. Acad. Dermatol., 37 958
–963
(1997). 0190-9622 Google Scholar
R. G. M. Kolkman,
E. Hondebrink,
W. Steenbergen, and
F. F. M. de Mul,
“In vivo photoacoustic imaging of blood vessels using an extreme-narrow aperture sensor,”
IEEE J. Sel. Top. Quantum Electron., 9 343
–346
(2003). https://doi.org/10.1109/JSTQE.2003.813302 1077-260X Google Scholar
R. G. M. Kolkman,
J. H. G. M. Klaessens,
E. Hondebrink,
J. C. W. Hopman,
F. F. M. de Mul,
W. Steenbergen,
J. M. Thijssen, and
T. G. van Leeuwen,
“Photoacoustic determination of blood vessel diameter,”
Phys. Med. Biol., 49 4745
–4756
(2004). https://doi.org/10.1088/0031-9155/49/20/006 0031-9155 Google Scholar
A. A. Oraevsky,
A. A. Karabutov,
S. V. Solomatin,
E. V. Savateeva,
V. A. Andreev,
Z. Gatalica,
H. Singh, and
R. D. Fleming,
“Laser optoacoustic imaging of breast cancer in vivo,”
Proc. SPIE, 4256 6
–15
(2001). https://doi.org/10.1117/12.429300 0277-786X Google Scholar
R. O. Esenaliev,
I. V. Larina,
K. V. Larin,
D. J. Deyo,
M. Motamedi, and
D. S. Prough,
“Optoacoustic technique for noninvasive monitoring of blood oxygenation: a feasibility study,”
Appl. Opt., 41 4722
–4731
(2002). https://doi.org/10.1364/AO.41.004722 0003-6935 Google Scholar
J. Saarela and
R. Myllylä,
“Changes in the time of flight of a laser pulse during paper compression,”
J. Pulp Pap. Sci., 29 224
–227
(2003). 0826-6220 Google Scholar
M.-C. Amann,
T. Bosch,
M. Lescure,
R. Myllylä, and
M. Rioux,
“Laser ranging: a critical review of usual techniques for distance measurement,”
Opt. Eng., 40 10
–19
(2001). https://doi.org/10.1117/1.1330700 0091-3286 Google Scholar
T. Yates,
J. C. Hebden,
A. Gibson,
N. Everdell,
S. R. Arridge, and
M. Douek,
“Optical tomography of the breast using a multi-channel time-resolved imager,”
Phys. Med. Biol., 50 2503
–2517
(2005). https://doi.org/10.1088/0031-9155/50/11/005 0031-9155 Google Scholar
K. V. Larin,
T. V. Ashitkov,
I. Larina,
I. Petrova,
M. Eledrisi,
M. Motamedi, and
R. O. Esenaliev,
“Optical coherence tomography and noninvasive blood glucose monitoring: a review,”
Proc. SPIE, 5474 285
–290
(2004). https://doi.org/10.1117/12.578965 0277-786X Google Scholar
K. M. Quan,
G. B. Christison,
H. A. MacKenzie, and
P. Hodgson,
“Glucose determination by a pulsed photoacoustic technique: an experimental study using a gelatin-based tissue phantom,”
Phys. Med. Biol., 38 1911
–1922
(1993). https://doi.org/10.1088/0031-9155/38/12/014 0031-9155 Google Scholar
K. V. Larin,
M. Motamedi,
M. S. Eledrisi, and
R. O. Esenaliev,
“Noninvasive blood glucose monitoring with optical coherence tomography, a pilot study in human subjects,”
Diabetes Care, 25 2263
–2267
(2002). https://doi.org/10.2337/diacare.25.12.2263 0149-5992 Google Scholar
H. A. MacKenzie,
H. S. Ashton,
S. Spiers,
Y. Shen,
S. S. Freeborn,
J. Hannigan,
J. Lindberg, and
P. Rae,
“Advances in photoacoustic noninvasive glucose testing,”
Clin. Chem., 45 1587
–1595
(1999). 0009-9147 Google Scholar
M. Kinnunen,
A. P. Popov,
J. Pluciński,
R. Myllylä, A. V. Priezzhev,
“Measurements of glucose content in scattering media with time of flight technique: comparison with Monte Carlo simulations,”
Proc. SPIE, 5474 181
–191
(2004). https://doi.org/10.1117/12.578897 0277-786X Google Scholar
Z. Zhao and
R. Myllylä,
“Photoacoustic blood glucose and skin measurement based on optical scattering effect,”
Proc. SPIE, 4707 153
–157
(2001). https://doi.org/10.1117/12.475582 0277-786X Google Scholar
R. Cubeddu,
A. Pifferi,
P. Taroni,
A. Torricelli, and
G. Valentini,
“A solid tissue phantom for photon migration studies,”
Phys. Med. Biol., 42 1971
–1979
(1997). https://doi.org/10.1088/0031-9155/42/10/011 0031-9155 Google Scholar
M. Kinnunen and
R. Myllylä,
“Comparative study of optical coherence tomography, photoacoustic technique, and time-of-flight technique in phantom measurements,”
Proc. SPIE, 6163 616304
(2006). 0277-786X Google Scholar
M. Kinnunen,
“Comparison of optical coherence tomography, the pulsed photoacoustic technique, and the time-of-flight technique in glucose measurements in vitro,”
University of Oulu,
(2006). Google Scholar
Y. Pan,
R. Birngruber,
J. Rosperich, and
R. Engelhardt,
“Low-coherence optical tomography in turbid tissue: theoretical analysis,”
Appl. Opt., 34 6564
–6574
(1995). 0003-6935 Google Scholar
J. M. Schmitt,
“Optical coherence tomography (OCT): a review,”
IEEE J. Sel. Top. Quantum Electron., 5 1205
–1215
(1999). https://doi.org/10.1109/2944.796348 1077-260X Google Scholar
J. M. Schmitt,
S. H. Xiang, and
K. M. Yung,
“Speckle in optical coherence tomography,”
J. Biomed. Opt., 4 95
–105
(1999). https://doi.org/10.1117/1.429925 1083-3668 Google Scholar
M. Kinnunen,
Z. Zhao, and
R. Myllylä,
“Comparison of the pulsed photoacoustic technique and the optical coherence tomography from the viewpoint of biomedical sensing,”
Proc. SPIE, 5946 468
–480
(2005). 0277-786X Google Scholar
Z. Zhao and
R. Myllylä,
“The effects of optical scattering on pulsed photoacoustic measurement in weakly absorbing liquids,”
Meas. Sci. Technol., 12 2172
–2177
(2001). https://doi.org/10.1088/0957-0233/12/12/319 0957-0233 Google Scholar
Z. Zhao,
S. Nissilä,
O. Ahola, and
R. Myllylä,
“Production and detection theory of pulsed photoacoustic wave with maximum amplitude and minimum distortion in absorbing liquid,”
IEEE Trans. Instrum. Meas., 47 578
–583
(1998). https://doi.org/10.1109/19.744208 0018-9456 Google Scholar
Z. Zhao,
“Pulsed photoacoustic techniques and glucose determination in human blood and tissue,”
University of Oulu,
(2002). Google Scholar
A. A. Oraevsky,
S. L. Jacques, and
F. K. Tittel,
“Measurement of tissue optical properties by time-resolved detection of laser-induced transient stress,”
Appl. Opt., 36 402
–415
(1997). https://doi.org/10.1038/385402a0 0003-6935 Google Scholar
A. Ishimaru, Wave Propagation and Scattering in Random Media, 1 Academic Press, New York (1978). Google Scholar
Selected Papers on Tissue Optics, Application in Medical Diagnosis and Therapy, MS 102 SPIE Press, Bellingham, WA (1994). Google Scholar
M. S. Patterson,
B. Chance, and
B. C. Wilson,
“Time-resolved reflectance and transmittance for the noninvasive measurement of tissue optical properties,”
Appl. Opt., 28
(12), 2331
–2336
(1989). 0003-6935 Google Scholar
S. L. Jacques,
“Time-resolved reflectance spectroscopy in turbid tissues,”
IEEE Trans. Biomed. Eng., 36 1155
–1161
(1989). https://doi.org/10.1109/10.42109 0018-9294 Google Scholar
J. Saarela,
M. Törmänen, and
R. Myllylä,
“Three methods for photon migration measurements in pulp,”
Optoelectronics Rev., 12 193
–197
(2004). Google Scholar
K. M. Yoo,
B. B. Das,
F. Liu, and
R. R. Alfano,
“Ultra short laser pulse propagation and imaging in biological tissue and model random media—steps toward optical mammography,”
IS 11 425
–449
(1993) Google Scholar
V. M. Podgaetsky,
S. A. Tereshchenko,
A. V. Smirnov, and
N. S. Vorob’ev,
“Bimodal temporal distribution of photons in ultrashort laser pulse passed through a turbid medium,”
Opt. Commun., 180 217
–223
(2000). https://doi.org/10.1016/S0030-4018(00)00684-2 0030-4018 Google Scholar
Handbook of Chemistry and Physics, D
–205 CRC, Cleveland, OH, p.1974). Google Scholar
S. T. Flock,
S. L. Jacques,
B. C. Wilson,
W. M. Star, and
M. J. C. van Gemert,
“Optical properties of Intralipid: a phantom medium for light propagation studies,”
Lasers Surg. Med., 12 510
–519
(1992). https://doi.org/10.1002/lsm.1900120510 0196-8092 Google Scholar
H. J. van Staveren,
C. J. M. Moes,
J. van Marle,
S. A. Prahl, and
M. J. C. van Gemert,
“Light scattering in Intralipid-10% in the wavelength range of ,”
Appl. Opt., 30 4507
–4514
(1991). 0003-6935 Google Scholar
M. Bondani,
D. Redaelli,
A. Spinelli,
A. Andreoni,
G. Roberti,
P. Riccio,
R. Liuzzi, and
I. Rech,
“Photon time-of-flight distributions through turbid media directly measured with single-photon avalanche diodes,”
J. Opt. Soc. Am. B, 20 2383
–2388
(2003). https://doi.org/10.1364/JOSAB.20.002383 0740-3224 Google Scholar
G. Zaccanti,
S. Del Bianco, and
F. Martelli,
“Measurements of optical properties of high-density media,”
Appl. Opt., 42 4023
–4030
(2003). https://doi.org/10.1364/AO.42.004023 0003-6935 Google Scholar
A. Giusto,
R. Saija,
M. A. Iati,
P. Denti,
F. Borghese, and
O. I. Sindoni,
“Optical properties of high-density dispersions of particles: application to Intralipid solution,”
Appl. Opt., 42 4375
–4380
(2003). https://doi.org/10.1364/AO.42.004375 0003-6935 Google Scholar
M. Kinnunen,
R. Myllylä,
T. Jokela, and
S. Vainio,
“In vitro studies toward noninvasive glucose monitoring with optical coherence tomography,”
Appl. Opt., 45
(10), 2251
–2260
(2006). https://doi.org/10.1364/AO.45.002251 0003-6935 Google Scholar
M. Kinnunen,
Z. Zhao, and
R. Myllylä,
“Effect of glucose on optical properties of Intralipid—measurements with photoacoustic and optical techniques,”
248
–255
(2004). Google Scholar
M. Kinnunen and
R. Myllylä,
“Effect of glucose on photoacoustic signals at the wavelengths of 1064 and in pig blood and Intralipid,”
J. Phys. D, 38 2654
–2661
(2005). https://doi.org/10.1088/0022-3727/38/15/018 0022-3727 Google Scholar
M. Kinnunen,
Z. Zhao, and
R. Myllylä,
“Glucose-induced changes in the optical properties of intralipid,”
Opt. Spectrosc., 101
(1), 54
–59
(2006). https://doi.org/10.1134/S0030400X06070101 0030-400X Google Scholar
M. Kinnunen and
R. Myllylä,
“Methods for evaluating the optical properties of a material from measured laser pulse shapes,”
340
–345
(2004). Google Scholar
L. Leonardi and
D. H. Burns,
“Quantitative measurements in scattering media: photon time-of-flight analysis with analytical descriptors,”
Appl. Spectrosc., 53 628
–636
(1999). https://doi.org/10.1366/0003702991947270 0003-7028 Google Scholar
U. Utzinger and
R. R. Richards-Kortum,
“Fiber optics probes for biomedical optical spectroscopy,”
J. Biomed. Opt., 8 121
–147
(2003). https://doi.org/10.1117/1.1528207 1083-3668 Google Scholar
M. Kirillin,
A. V. Priezzhev,
M. Kinnunen,
E. Alarousu,
Z. Zhao,
J. Hast, and
R. Myllylä,
“Glucose sensing in aqueous Intralipid suspension with an optical coherence tomography system: experiment and Monte Carlo simulation,”
Proc. SPIE, 5325 164
–173
(2004). https://doi.org/10.1117/12.535341 0277-786X Google Scholar
Z. Zhao and
R. Myllylä,
“Scattering photoacoustic study of weakly absorbing substances in aqueous suspensions,”
J. Phys. (France), 137 385
–390
(2006). 0302-0738 Google Scholar
O. Jarlman,
R. Berg,
S. Andersson-Engels,
S. Svanberg, H. Pettersson,
“Time-resolved white light transillumination for optical imaging,”
Acta Radiol., 38 185
–189
(1997). 0284-1851 Google Scholar
K. M. Quan,
H. A. MacKenzie,
P. Hodgson, and
G. B. Christison,
“Photoacoustic generation in liquids with low optical absorption,”
Ultrasonics, 32 181
–186
(1994). https://doi.org/10.1016/0041-624X(94)90031-0 0041-624X Google Scholar
A. C. Tam and
C. K. N. Patel,
“Optical absorptions of light and heavy water by laser optoacoustic spectroscopy,”
Appl. Opt., 18 3348
–3358
(1979). 0003-6935 Google Scholar
|
||||||||||||||||||||||||||||||||||||||||||||||||||||||||||||||||||||||||||||||||||||||||||||||||