
|
|
1.IntroductionBiomedical optics has shown great promise in extracting biochemical and morphologic information from precancerous and cancerous tissue in vivo that has been traditionally obtained exclusively by microscopic examination of excised tissue.1, 2, 3 Optical techniques can provide clinicians greater ability to noninvasively detect and monitor precancerous lesions during screening and treatment, particularly for extensive lesions that require multiple biopsies to adequately assess disease stage. The high turnover rate of cells in the epithelium makes it the most common site for cancer to emerge.4 Epithelial cancers are well characterized to develop in a multistep process from the accumulation of genetic mutations over time, resulting from carcinogenic exposure. For the majority of cancers, survival rate and quality of life are greatly improved when cancer and its precursors are detected early. An epithelial cancer where early detection is crucial to successful clinical outcome is oral cancer.5 If caught early, the 5-yr survival rate increases dramatically from 26% for distant staging to 82% for local staging.6 Even in developed countries such as the United States, where dental exams are routine, oral cancer is often not discovered until it has infiltrated surrounding organs or tissues.6 Indeed, U.S. 5-yr survival rates have changed little in the last , remaining7 at approximately 55%. Current oral cancer screening methods are limited by the variety of tissue architecture and by the similarity of appearance of benign inflammatory conditions to premalignant and malignant lesions. Further complications arise in high-risk patients, who often have carcinogenic exposure that covers the entire mucosal lining. After successful treatment of a cancerous tumor, secondary tumors can develop in adjacent areas over time. Monitoring these high-risk patients requires multiple biopsies taken routinely over many years. Clearly, noninvasive optical modalities to detect the early stages of oral cancer have the potential to reduce patient pain, morbidity, and mortality. To this end, significant efforts have been directed toward exploring optical imaging and optical spectroscopy techniques to aid screening and diagnosis of the early stages of oral cancer. 8, 9, 10, 11, 12, 13, 14, 15, 16, 17, 18, 19, 20 A comprehensive overview of the new emerging methods for the detection and treatment of oral carcinoma has recently been given in Refs. 21, 22. Optical imaging modalities such as confocal microscopy, optical coherence tomography (OCT), and nonlinear optical microscopy have shown great potential for oral lesion discrimination. While these nascent approaches alone or in combination with exogeneous dyes, vital stains, or nanoparticles are highly promising, they require some degree of equipment complexity and operator training. Autofluorescence imaging and spectroscopy has been shown to give improved lesion contrast, which has been attributed in part to porphyrin fluorescence. However, it has been argued that porphyrin fluorescence is not a good diagnostic indicator, as it is synthesized by bacteria not only on ulcerating tumors, but also on the dorsums of normal tongues and on gingival plaques.11 The presence of porphyrin fluorescence can therefore obscure detection of lesion grade using fluorescence techniques. Spectroscopic approaches that combine tissue autofluorescence and scattering showed promising sensitivity and specificity in pilot clinical trials, however, it required stratification of tissue sites according to level of keratinization before statistical analysis.16 Here we present the results of the first pilot clinical trial that assesses the optical technique of oblique polarized reflectance spectroscopy (OPRS) to discriminate oral precancers and cancers from normal or benign tissue. OPRS is a noninvasive optical modality that employs polarized light illumination and polarization sensitive detection. This method is very simple and robust and, thus, provides an attractive approach for earlier cancer detection in the oral cavity including screening in a high-risk population. OPRS is based on the following concept: the electric field orientation, or polarization, of the incident light remains unchanged after interaction with the optically dilute epithelial layer. In contrast, photons that propagate deeper to the optically dense stroma are remitted from tissue with their polarization state randomized. In OPRS, two scattered signals are collected: one with polarization parallel and the other with polarization perpendicular relative to the illumination polarization. The small epithelial signal can therefore be isolated by subtracting the perpendicular polarization intensity from the parallel polarization intensity. 23, 24, 25, 26, 27 Combining polarization-sensitive detection with an oblique endoscopic collection geometry further resolves scattering signals from the upper epithelial layer and from the lower stromal layer.28 This additional depth-dependent optical information carried by polarized light has the potential to enhance discrimination of the varying grades of dysplasia and carcinoma from visually indistinguishable benign lesions. The two scattering signals collected by OPRS can be used separately or in combination to yield diagnostically relevant parameters. In this pilot clinical study, we extracted 10 spectroscopic features and nuclear size of epithelial cells with the goal to identify key parameters for detection and monitoring of precancerous lesions in the oral cavity. A thorough statistical analysis of the spectral parameters and extracted nuclear size was performed using linear discriminant analysis (LDA) and evaluated using receiver operating characteristic (ROC) analysis. OPRS was found to be sensitive to four clinically relevant histological groups: normal, benign, mild dysplasia, and severe dysplasia (defined as tissue requiring surgical excision for treatment). We demonstrated that the features that provide the best discrimination differ according to diagnostic category. This result emphasizes that a combination of features is required to efficiently tackle the multitask problem of cancer detection and diagnoses. 2.Materials and Methods2.1.Clinical MeasurementA pilot clinical study was conducted with informed consent on 27 patients over the age of 18 that were referred to the Head and Neck Clinic at The University of Texas M. D. Anderson Cancer Center (MDACC) with oral mucosa lesions suspicious for dysplasia or carcinoma. A medical doctor performed a standard oral cavity examination, followed by spectroscopic measurements which were typically performed on one to two visually abnormal sites and one visually normal site. In some cases, more than one measurement was performed on the same tissue site without removing the probe. All measurements from the same tissue site were averaged to give a single spectrum. A calibration spectrum was acquired before or after each patient evaluation using a diffuse reflectance substrate standard (Labsphere, Inc.). Data from three patients were removed from the analysis because of improper handling of the endoscope or malfunctioning of the clinical device. Biopsies were taken of all measured tissue sites. The biopsied tissue was sectioned into transverse slices and mounted onto microscope slides. The slides were stained with a hematoxylin and eosin (H&E) stain for standard histological analysis. Paired normal and abnormal slides were reviewed by a trained pathologist at MDACC. Detailed descriptions were made of each slide indicating the extent of dysplasia, inflammation, keratinization, and hyperplasia. 2.2.InstrumentationAlthough detailed extensively in Refs. 28, 29, we briefly describe the instrument used in this clinical study for convenience. The illumination source was a broadband white light Xe pulsed lamp with ca. pulse widths and a wavelength range of 400 to . Light was delivered to the tissue site of interest though a single optical fiber with a core diameter of and 0.22 numerical aperture (NA). The power delivered to the tissue was approximately , well below the acceptable threshold limit value given by the American Conference of Governmental Industrial Hygienists.30 Two identical optical fibers were placed on either side of the illumination fiber for collection of the remitted light. Two pieces of polarizing film with an extinction transmittance of 0.002% were adhered to the distal end of the fiber optic probe. These polarizers set the orientation of the illumination and collection polarization states and were oriented orthogonal to each other. The two collection fibers had polarizing film with transmission axes either parallel or orthogonal to the illumination polarization state. A protective fused silica window of defined thickness was placed over the fibers and polarizing film. The illumination fiber was oriented normal to the silica window surface and the collection fibers were oriented at ca. with respect to the illumination fiber. With this geometry, the collection fiber’s acceptance cones cross each other and with the illumination beam in the superficial tissue layer as shown in Fig. 1 . The collection efficiency of a single obliquely oriented beveled fiber peaks at the maximum overlap of the illumination beam with the collection acceptance cone. Figure 1a is a plot of the collected intensity of a single collection fiber from a diffusely reflecting substrate (Labsphere, Inc.). The probe used in this study has a fused silica window that acts as a spacer such that the maximum overlap is at the tissue surface. The window and tissue thicknesses with respect to the maximum collection depth are illustrated above the plot in Fig. 1a. This overlap drops to 50% at a depth of 300 to , the typical thickness of oral epithelium. Hence, superficial traveling photons approximately below the tissue surface are collected with greater efficiency than deeper traveling photons. The collection fibers deliver the remitted light to a grating spectrograph coupled to a gated intensified photodiode array detector. Operating in gated mode enables all measurements to be conducted under room light illumination so that OPRS measurements could blend seamlessly into a clinical examination or preoperative surgical procedure. Fig. 1(a) Overlap of illumination and collection acceptance cones as a function of distance from the distal end of the illumination and collection fibers. Distance zero corresponds to the epithelium surface. Measurements were made in water using a reflectance standard (Labsphere, Inc.). (b) Illustration of distal probe geometry. The center fiber delivers light to the tissue; the outer two fibers collect the scattered light with polarization parallel and orthogonal to the incident polarization.  2.3.Data Analysis2.3.1.PreprocessingThe collected parallel and perpendicular spectra were dark subtracted and then divided by the sum of the scattered light collected through both collection channels from a diffuse reflectance standard (Labsphere, Inc.) to correct for the wavelength-dependent response of the detection system and the spectral profile of the source. The parallel and perpendicular signals were studied alone and in the following combinations: the ratio of parallel to perpendicular, parallel minus perpendicular, and the sum of the parallel and perpendicular signals. The sum of the parallel and perpendicular spectra is equivalent to the diffuse reflectance spectrum and their difference is defined as the depolarization ratio. Spectra were down-sampled using an averaging window with a spectral width of to reduce data size and computation time. The spectra were normalized to remove interpatient variation. Three approaches were tested: (1) no normalization, (2) division of entire spectra by the intensity value at , and (3) additive dc offset applied to the entire spectra such that value at was equal to the mean for all spectra within the same spectral type (e.g., parallel or ratio of parallel and perpendicular signals etc.). This normalization was intended to preserve the relative intensity scale between different spectral types. Normalization method 2 gave the highest area under the ROC curve for all classification tasks considered and hence was used throughout this study. 2.3.2.Determination of the Most Discriminatory WavelengthThe most discriminatory wavelengths were determined using the area under the ROC curve, which is a commonly used summary statistic to assess the effectiveness of a two-outcome classification process.31 The area under the nonparametric curve (AUC) was computed using the trapezoid rule. On the occasion when ties existed, the best wavelength was chosen manually such that wavelength variations were minimized. 2.3.3.FeaturesTwo features were extracted from each spectrum of the five spectral types (parallel, perpendicular, diffuse, depolarization ratio, parallel/perpendicular), one being the mean intensity across the entire spectrum and the other being the intensity at the most discriminatory wavelength, yielding 10 spectral features per measurement site. In addition, nuclear size was extracted from the depolarization ratio spectrum using a Mie theory based algorithm described in Refs. 27, 32. Figure 2a shows example depolarization ratio spectra for each diagnostic category and their corresponding fit. Figure 2b compares the mean nuclear size per diagnostic category extracted from OPRS measurements and from direct measurements of the biopsied tissue histology slides. Hence, a total of 11 features were extracted from each measurement site for use in eight binary classification tasks: (1) normal versus severe dysplasia (SD), (2) normal versus mild dysplasis (MD), (3) normal versus MD and SD combined, (4) MD versus SD, (5) benign versus SD, (6) benign versus MD, (7) benign versus MD and SD combined, and (8) benign versus normal. Fig. 2(a) Examples of experimental depolarization ratio spectra (solid curves) for each diagnostic category and corresponding theoretical simulations (dotted curves) obtained using Mie scattering calculations and (b) bar graph of mean nuclear size per diagnostic category. Light gray bars indicate nuclear size extracted using OPRS measurements and dark gray bars indicate nuclear size obtained directly from stained and sliced biopsied tissue mounted on microscope slides. The standard deviations show variations in nuclear sizes between different patient sites. 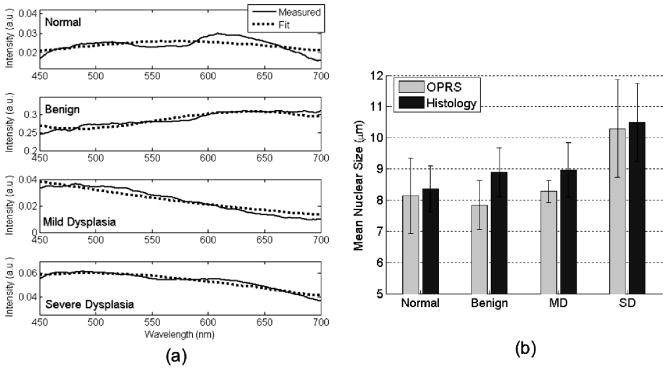 2.3.4.Selection of the Most Discriminatory FeaturesIn many classification tasks, a combination of features yields better discrimination than can be achieved with any single feature. Since there are 11 features in each of the two-class classification problems, different combinations of features are possible, for example: feature 1 alone; features 1 and 2 combined; features 1 and 3 combined; features 2 and 3 combined; features 1, 2, and 3 combined; etc. We exhaustively searched through these 2047 combinations to identify the feature or combination of features that best discriminates between two diagnostic classes using33 LDA. LDA was chosen because it works well with small datasets and it preserves the physical origins of features. Leave-one-out cross validation was employed to train and test all LDA models. The performance of a feature combination was evaluated using the area (AUC) under the nonparametric ROC curve generated from the LDA decision variable. All possible LDA models were compared. The best LDA model was defined as that which had the highest area under the ROC curve. LDA calculations were carried out using the classify function in R7 Statistics Toolbox (The MathWorks, Natick, Massachusetts). For each binary classification task, several of the 2047 LDA models can have statistically equivalent discrimination. A bootstrapping technique was used to estimate the mean difference in the AUC between LDA models and the two-sided value of that difference.34 Any values below the conventional threshold of 0.05 were regarded as statistically significant. The top models with AUCs statistically indistinguishable from the maximum AUC observed were considered to be comparable models. We hypothesized that dominant features would appear with higher frequency, while irrelevant features would appear randomly. Consequently, the fractional occurrence of individual features within the top LDA models within each diagnostic category was counted. Those features that appeared with a frequency of 0.5 or greater are considered to be of diagnostic importance. 2.3.5.Precautions Taken to Avoid OvertrainingOvertraining is a concern any time one develops a classification model with a small dataset. To reduce this risk, we used leave-one-out cross validation to generate the LDA models. As a further check, a permutation test was applied in which the pathology definition of each patient measurement was randomly shuffled while the prevalence of disease was kept constant.35 The shuffling was repeated 1000 times for each binary classification task, so that the mean and standard error of the area under ROC curves could be calculated and compared with the observed area under ROC curves. 3.Results3.1.Sample DistributionTable 1 summarizes the distribution of sites from the oral cavity that were measured, then subsequently biopsied. A total of 57 sites in 24 patients were measured and analyzed in this study. Table 1 is divided into two categories based on the examining physician’s visual impression at the time of biopsy: (1) normal and (2) abnormal. All visually normal sites were confirmed to be normal by histological analysis. The clinically appearing “abnormals” were further subdivided into three categories according to their histological diagnosis: benign (B), MD, or SD. We defined SD as tissue that requires surgical excision. In this study, all but one SD site were classified as carcinoma (the other was classified as moderate dysplasia). Figure 3 shows images taken of representative histopathology slides from this study illustrating the morphology of the different diagnostic categories. All binary combinations of the four diagnostic classes were used to test classification of OPRS data. Fig. 3Representative images of biopsied tissue diagnosed as (a) normal, (b) benign, (c) MD, or (d) SD. Tissue was stained with H&E for standard histopathological analysis. Scale bar is .  Table 1Distribution of anatomical sites within the oral mucosa measured with OPRS.
1Severe dysplasia is defined as tissue that requires surgery for treatment; it includes tissue that has the histopathological diagnosis of moderate to severe dysplasia or carcinoma. The physical appearance was noted prior to OPRS measurement as either normal or abnormal. Biopsies were taken of all 57 measured sites. Histopathology of abnormal biopsies is catergorized as benign, MD, or SD. 3.2.Measurement RepeatabilityTo assess the reproducibility of our measurements, 51 of the 57 tissue sites had two subsequent measurements performed without removing the probe. We calculated a mean intensity difference over all wavelengths between the two spectra from the same tissue site and their average spectrum. An average value for the intensity difference for all 51 sites was ca. 10%. The repeatability of spectral shape is also important especially when performing nuclear size extraction. Therefore, we ran the nuclear extraction algorithm on a subset of the 51 patient sites that had duplicate measurements. Fifteen sites were chosen randomly without reference to the diagnosis. The extracted nuclear size for both repeat measurements was compared to the nuclear size found using the mean spectrum. We found that the average nuclear size difference between the measured spectra and the mean spectrum was . This is well below the size difference (ca. ) between diagnostic categories of normal and SD. However, these data indicate that probe handling is an important issue in clinical trials that can lead to an increase in variations of optical measurements in vivo. Translation of the probe between measurements can cause differences in the spectra as the tissue volume sampled will have changed. The tissue volumes may have differing scattering characteristics that may affect collection of parallel and perpendicular components and extraction of the depolarization ratio spectrum. In addition, it has been shown that the pressure applied to the tissue can significantly affect fluorescence spectral intensity.36 Further work must be performed in this area to fully assess the effect of probe pressure and handling on spectroscopic measurements. 3.3.Polarized Reflectance SpectraFigure 4 shows the measured spectra before normalization. The diagnostic category is indicated by the color of the curves: solid green, normal; dashed blue, benign; dash-dotted red, mild dysplasia; and dotted black, severe dysplasia. The first row shows all measured spectra from the parallel and perpendicular collection channels. The second and third rows show the averaged spectra per diagnostic class for the parallel, perpendicular, diffuse reflectance, and the depolarization ratio. Analysis of the mean spectra showed a good, albeit qualitative, separation of all diagnostic classes. Fig. 4Measured spectra. The first row shows all the spectra collected from the two collection channels. The second and third rows show the mean spectra according to diagnostic class for the parallel, perpendicular, diffuse reflectance, and depolarization ratio. Spectra from normal tissue are shown as solid green curves, benign tissue shown as dashed blue curves, mild dysplasia as red dash-dotted curves, and severe dysplasia as black dotted curves. 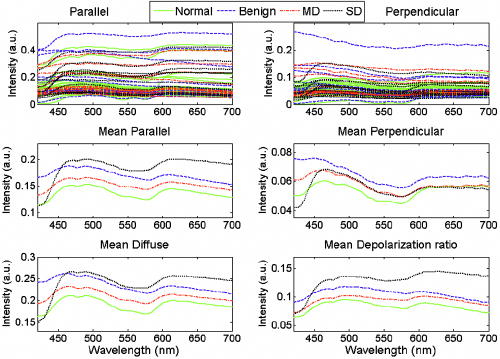 A qualitative look at the mean spectra reveals differences in the total intensity, which is modulated by hemoglobin absorption. Within a narrow wavelength band, the mean spectral differences can be quite large. For example, the mean perpendicular spectra have the largest separation between diagnostic classes for wavelengths shorter than . Similarly, the mean depolarization ratio spectra have the largest separation between normal and SD in the red or long-wavelength region. As a whole, the mean spectra hint at the possibility of using select wavelength regions for improved diagnostic discrimination, thus prompting an analysis of the optimal wavelength for maximum separation of two diagnostic classes for each spectral type. 3.4.Diagnostically Relevant FeaturesTable 2 shows the best wavelengths determined for the eight two-outcome diagnostic classification tasks and five spectral types. All spectra used in this analysis were normalized to one at , as described in Sec. 2.3.1. Table 3 lists the AUCs for individual features and the best combination of features, as determined by exhaustive LDA search, for each classification task considered. An AUC of 1 corresponds to perfect classification while an AUC of 0.5 corresponds to chance performance. Comparison of the individual feature AUC and the LDA AUC per classification task shows that the LDA model typically performs better. Note that the performance of individual features varies quite drastically, depending on the classification task. These results demonstrate that a combination of features is needed to efficiently tackle the multitask classification problem involved in cancer detection and diagnosis. Table 2The wavelengths, given in nanometers, that provided the maximum separation between two diagnostic classes.
Table 3Area under the ROC curve for individual features and the best LDA combination of features.
Eight binary classification tasks, indicated by the column headings, were considered. Features identified by
x
nm correspond to the intensity at the most discriminatory wavelength. A value of unity indicates perfect performance, while 0.5 is chance performance. Discrimination of normal from SD has a relatively high LDA AUC. This is consistent with our expectations since normal and SD are two extremes of the continuum of histopathological status. Likewise, histopathologically similar tissue such as normal and MD is more difficult to discriminate. The similarity of normal and MD tissue can be seen in Fig. 3, where the areas of MD (indicated by increased nuclear density) encompass a small section at the basal layer. It is not uncommon for MD to be focally located amid normal tissue. In an OPRS measurement, the optical signal from MD is weighted by the surrounding normal tissue. Similarly, the AUC for the classification task of normal from MD and SD combined yield a similar AUC to that of normal from MD. In comparison, clear diagnostic potential is shown for the classification task of MD versus SD. One of the most clinically challenging classification tasks requires the ability to distinguish between dysplastic tissue and benign tissue, which has the outward appearance of dysplasia or carcinoma but is histologically normal. Therefore, it is encouraging that some features in our study show clear separation between benign and SD sites. Similar to what is observed when normal tissue is used as the reference, there is less discriminatory power for the classification tasks differentiating benign from MD or benign from MD and SD combined. Due to the limited amount of data in this pilot study, there is not enough statistical power to distinguish between small differences in ROC area. For example, in the classification task of normal from SD, 36 LDA feature sets with the highest ROC areas were found to be statistically indistinguishable. Rather than attempting to identify a single “best” model, which is impossible to do in a pilot study, we identified the features that most frequently appear in the set of statistically indistinguishable best performing models. Table 4 shows the frequency with which each feature occurs in the top feature sets with statistically similar ROC areas for each classification task. Dashed lines delineate features that appear with a frequency of 0.5 or greater. We suggest that these features warrant the greatest attention in future large clinical trials. Table 4For each classification task, the frequency of appearance of individual features within the best performing statistically comparable LDA feature sets is shown. Features indentified by x nm correspond to the intesity at the most discriminatory wavelength. Features are sorted such that those that occur with a frequency greater than 0.5 appear above the dashed line. These features are considered to be the most diagnostically relevant. 3.5.Check for OvertrainingWith a small data set, overtraining is always a concern. As noted in the methods section, leave-one-out cross validation was used for classifier training to reduce this risk. As an additional check, a permutation test was conducted where the diagnostic state of the measured site was randomly assigned for a given classifier task while preserving the number of patients within each class. The results are shown in Fig. 5 . The mean standard deviation of the AUCs for a randomly shuffled task is shown as a gray cross-hair with error bars, while the real AUC of the top LDA model is shown as a filled black circle with a single bar indicating the extent of AUC values within the top comparable LDA models. The randomly assigned permutations have AUCs that are clustered around 0.5 or chance performance, whereas the real AUCs are well above the error bars. The values of the permutation tests showed significant difference between the real AUC and the randomly shuffled AUCs. For example, the permutation test for classifying normal and SD has a zero value. These results demonstrate that the LDA model is capturing meaningful differences between the diagnostic classes as opposed to merely magnifying chance differences in the feature values. Fig. 5Permutation test to check for overtraining. The diagnosis assignment was shuffled for each classification task while preserving the number of patients within each class. The mean and standard deviation of the area under the ROC curve, AUC, obtained using the shuffled data sets is shown as gray cross hairs. The AUC for the true LDA feature sets is shown in black. The highest LDA AUC is shown as a filled black circle, while a lower black whisker indicates the lowest statistically equivalent LDA AUC. The true LDA AUCs are well above the permuted AUCs, which are grouped around chance performance, demonstrating that the data is not overtrained.  4.DiscussionGiven the variety of oral mucosa and the resulting spectral diversity that can confound classification, it is noteworthy that statistical significance was obtained across diagnostic classes without the need to stratify the data according to tissue location (i.e., buccal, tongue, etc.) or tissue keratinization. The detailed interpretation of these findings as they relate to tissue morphology is somewhat difficult, although a qualitative understanding can be obtained, thus guiding future studies and probe designs. In Fig. 3, the progression of normal tissue to premalignancy then to malignancy can be viewed in terms of the physical alteration of normal tissue from a homogeneous two-layer structure to a very irregular single layer tissue. It has been shown that changes in spectral profiles that accompany progression to carcinoma can be related to changes in both the epithelium and the stroma such as increased microvascularization and scattering alterations.2, 37, 38 The frequency of appearance of features in Table 4 points toward their diagnostic importance. The features that occur most consistently are nuclear size, the intensity ratio of parallel to perpendicular channels, and the mean perpendicular signal. Nuclear size appears with the highest frequency in classification tasks involving normal tissue while the mean perpendicular feature and the ratio of parallel to perpendicular feature dominate cases that involve benign tissue. Clearly nuclear size is a measure of the morphological changes that occur in superficial (i.e., epithelial) tissue. The regular appearance of nuclear size is consistent with histopathology where epithelial cell nuclei are well documented to enlarge with the progression of cancer.4 In Fig. 2b both the extracted and measured nuclear size shows an increase with disease progression. The ratio of the parallel to the perpendicular signal, on the other hand, can be interpreted as the ratio of shallow to deep tissue changes. This can be seen if the parallel/perpendicular signal is rewritten as , where represents photons that have undergone few scattering events, while represents photons that have had many scattering interactions. The mean perpendicular feature is, therefore, a measure of the interaction of photons in tissue below the epithelium where increases in capillary density will manifest as hemoglobin modulation of the perpendicular scattering spectrum. These alterations in the perpendicular spectrum will then affect the parallel/perpendicular ratio. Recent work in other organ sites indicates that changes in blood content and oxygenation that occur below the epithelium can be related to tumor development and, potentially, to premalignant lesion formation. Siegel reported increased blood supply in subepithelial mucosa before the development of dysplasia in adenomatous human colon biopsies and rat colons treated with a carcinogen.39 Zonios found an increase in hemoglobin concentration in adenomatous colon polyps, but not hemoglobin oxygenation.40 In contrast, Bard found that endobroncho tumors were characterized by lower blood oxygenation.41 In another study, Fawzy demonstrated that malignant lung lesions had differences in blood volume fraction and oxygen saturation when compared to normal or benign lesions.42 In their investigation, the blood volume fraction was significantly higher in malignant lesions than benign lesions. These findings can be extended to the oral mucosa where 85% of all precancerous lesions have the clinical appearance of white patches or leukoplakia.43 Reviews of the prognosis of oral premalignant lesions in several countries including the USA, India, Hungary, Netherlands, and Norway by Silverman 44 and Rebeil45 has shown that the rate of malignant transformation of leukoplakia can range from less than 1% to 18%, where the highest transformation rate was found in the USA. Less frequently encountered is a red patch or erthyroplakia, which is nearly always associated with dysplasia or carcinoma at the time of identification.5 Both erythroplakia and their mixtures with leukoplakia are at a higher risk for malignancy. The clinical description of erythroplakia as a red patch indicates an increase in blood perfusion. The implication that capillary density is correlated with precancer progression in the oral cavity is a subject of interest for future work. Adding to the interpretation of the mean perpendicular feature is the fact that the polarization change that gives rise to the perpendicular signal can be viewed as a diffusion process where depolarization increases with increasing optical-tissue interaction.24 Consequently, areas of increased scattering in superficial regions of tissue such as keratin or dysplasia will also contribute to the perpendicular signal. The oblique collection geometry of our probe makes it more sensitive to superficial tissue changes as the collection efficiency is greatest in the first 300 to of tissue. This sensitivity enhances the effects of increased superficial scattering. It is well known that the nonuniformity of appearance of oral cavity lesions, arising from architectural and morphological changes, is correlated with transformation to invasive cancer.46, 47, 48 Work in the breast, cervix, and bronchus has also indicated that the local variation of tissue can potentially yield diagnostically relevant information. 41, 49, 50, 51 We hypothesize that it is this combination of blood absorption from deeper tissue and localized increases in epithelial scattering, resulting from changes in the local tissue morphology, that causes the perpindicular and the parallel/perpendicular features to appear with such high frequency in the top LDA models for classification tasks involving benign tissue. Further study of these high-frequency features is necessary to fully assess their physical meaning and their impact on diagnostic classification. Another important outcome of the statistical analysis is the ability of OPRS to separate benign lesions from all other lesion types despite having the same or similar outward appearance. Many optical techniques are capable of discerning normal from malignant oral mucosa with a high degree of sensitivity and specificity, but discrimination of benign lesions from precancer and cancer is more elusive. A few groups have reported discrimination of the differing grades of abnormal human oral cavity tissue in vivo using imaging techniques. Wang was able to separate benign from dysplastic and cancerous buccal mucosa autofluorescence (sensitivity of 81%, specificity of 96%) using a partial least squares artificial neural network analysis.52 Onizawa were able to separate benign from cancerous oral cavity tissue with a sensitivity and specificity of 91% and 84%, and also benign from dysplasia plus cancer with a sensitivity of 94% and a specificity of 96% using UV flash photography.8 Kulapaditharom and Boonkitticharoen reported a sensitivity and specificity of 100% and 73%, respectively, for separation of benign from dysplastic plus malignant tissue.53 Although these imaging studies showed good sensitivity and specificity they had certain limitations. The results by Wang were limited by the isolation of their study to a single oral cavity location (buccal mucosa) and the similar history of carcinogenic exposure (areca quid chewing and smoking). The results achieved by Onizawa and Kulapaditharom and Boonkitticharoen could be attributed to increased porphyrin fluorescence with dysplasia. However, Betz indicated that porphyrin fluorescence is not a good indicator of disease as it was only present in one-third of tumors they studied and was also present on normal tongue and gingival plaques.11 Overall spectroscopic studies have shown less optimistic results. Muller found a sensitivity and specificity of 64 and 90%, respectively, for separating dysplasia from cancer using trimodal spectroscopy.16 De Veld recently concluded that neither diffuse reflectance spectroscopy nor tissue autofluorescence (alone or in combination) could distinguish benign tissue from dysplastic and cancerous tissue based on a clinical trial of 134 abnormal lesions.54 The results of our pilot clinical trial are more consistent with the cited imaging work. We have also found that the OPRS is capable of distinguishing benign tissue from normal, precancerous, and cancerous tissue with good sensitivity and specificity. Although it is more informative to report AUCs rather than a single point on the ROC curve, Table 5 lists the sensitivity and specificity of OPRS for all diagnostic classification tasks for easy comparison to work by others. In each case, the ROC threshold was chosen such that it gave both high sensitivity and high specificity. We suggest that multiple diagnostically relevant features that can be extracted from a single OPRS measurement are the key to its diagnostic performance. Table 5Sensitivity and specificity of OPRS for all binary combinations of four distinct histological groups: normal, benign, MD, and SD.
Separation of normal tissue from SD yielded a sensitivity of 90% and a specificity of 86%. Discrimination of identical looking benign lesions from severe dysplasia was also achieved with high sensitivity (100%) and specificity (85%). Evaluation of all dysplasia (including carcinoma) against normal or benign tissue yielded sensitivities and specificities of 73 and 64% and 86 and 61%, respectively. Lesser diagnostic grades such as MD and benign lesions do not require surgical resection, but must be monitored for possible transformation to malignancy. OPRS was able to discriminant MD from SD with a sensitivity of 80% and specificity of 83%. These compelling findings emphasize the need for a large prospective study to assess OPRS as an adjunct to clinical examination for the detection and monitoring of precancerous and cancerous tissue. 5.ConclusionThe oral cavity has a variety of tissue architectures in addition to a whole host of benign conditions such as leukoplakia, erythroplakia, and lichen planus that can mask precancer and cancer. Using a multipronged approach to discriminate the earliest stages of precancer could solve this problem. An ideal pared down system would be simple, low-cost, robust, and noninvasive. We believe that OPRS has the potential to fulfill these requirements. Our results from a preliminary pilot clinical trial have demonstrated the ability of OPRS to discriminate, with high sensitivity and specificity, normal tissue from high-grade dysplasia and cancer (SD). Further, OPRS can discriminate visually identical lesions such as benign from SD and benign from premalignant and malignant lesions. These promising results suggest that OPRS has the potential to augment current clinical practice for diagnosis and monitoring of oral premalignancies and malignancies. AcknowledgmentsFinancial support from the Whitaker Foundation and the National Institute of Biomedical Imaging and BioEngineering (NIBIB) EB003540 is gratefully acknowledged. ReferencesR. Richards-Kortum and
E. Sevick-Muraca,
“Quantitative optical spectroscopy for tissue diagnosis,”
Annu. Rev. Biochem., 47 555
–606
(1996). 0066-4154 Google Scholar
I. J. Bigio and
J. R. Mourant,
“Ultraviolet and visible spectroscopies for tissue diagnostics: fluorescence spectroscopy and elastic-scattering spectroscopy,”
Phys. Med. Biol., 42 803
–814
(1997). https://doi.org/10.1088/0031-9155/42/5/005 0031-9155 Google Scholar
K. Sokolov,
M. Follen, and
R. Richards-Kortum,
“Optical spectroscopy for detection of neoplasia,”
Curr. Opin. Chem. Biol., 6
(5), 651
–658
(2002). https://doi.org/10.1016/S1367-5931(02)00381-2 1367-5931 Google Scholar
R. Cotran,
V. Kumar, and
S. Robbins,
(1994) Google Scholar
J. J. Sciubba,
“Oral cancer: the importance of early diagnosis and treatment,”
Am. J. Clin. Dermatol., 2
(4), 239
–251
(2001). Google Scholar
A. Jemal,
R. Siegel,
E. Ward,
T. Murray,
J. Xu, and
M. J. Thun,
“Cancer statistics, 2007,”
Ca-Cancer J. Clin., 57 43
–66
(2007). 0007-9235 Google Scholar
“SEER Statistics Review 1975–2003, Oral Cavity and Pharynx,”
Google Scholar
K. Onizawa,
H. Saginoya,
Y. Furuya,
H. Yoshida, and
H. Fukuda,
“Usefulness of fluorescence photography for diagnosis of oral cancer,”
Int. J. Oral Maxillofac Surg., 28
(3), 206
–210
(1999). 0901-5027 Google Scholar
B. Kulapaditharom and
V. Boonkitticharoen,
“Laser-induced fluorescence imaging in localization of head and neck cancers,”
Adv. Oto-Rhino-Laryngol., 107 241
–246
(1998). 0065-3071 Google Scholar
E. Svistun,
R. Alizadeh-Naderi,
A. El-Naggar,
R. Jacob,
A. Gillenwater, and
R. Richards-Kortum,
“Vision enhancement system for detection of oral cavity neoplasia based on autofluorescence,”
Head Neck, 26 205
–215
(2004). 1043-3074 Google Scholar
C. S. Betz,
M. Mehlmann,
K. Rick,
H. Stepp,
G. Grevers,
R. Baumgartner, and
A. Leunig,
“Autofluorescence imaging and spectroscopy of normal and malignant mucosa in patients with head and neck cancer,”
Lasers Surg. Med., 25 323
–334
(1999). https://doi.org/10.1002/(SICI)1096-9101(1999)25:4<323::AID-LSM7>3.3.CO;2-G 0196-8092 Google Scholar
A. L. Clark,
A. Gillenwater,
R. Alizadeh-Naderi,
A. K. El-Naggar, and
R. Richards-Kortum,
“Detection and diagnosis of oral neoplasia with an optical coherence microscope,”
J. Biomed. Opt., 9
(6), 1271
–1280
(2004). https://doi.org/10.1117/1.1805558 1083-3668 Google Scholar
P. Wilder-Smith,
T. Krasieva,
W. G. Jung,
J. Zhang,
Z. Chen,
K. Osann, and
B. Tromberg,
“Noninvasive imaging of oral premalignancy and malignancy,”
J. Biomed. Opt., 10 051601
(2005). https://doi.org/10.1117/1.2098930 1083-3668 Google Scholar
P. M. Lane,
T. Gilhuly,
P. Whitehead,
Z. Haishan,
C. F. Poh,
S. Ng,
P. M. Williams,
Z. Lewei,
M. P. Rosin, and
C. E. MacAulay,
“Simple device for the direct visualization of oral-cavity tissue fluorescence,”
J. Biomed. Opt., 11
(2), 24006
–24241
(2006). 1083-3668 Google Scholar
A. Gillenwater,
R. Jacob,
R. Ganeshappa,
B. Kemp,
A. K. El-Naggar,
J. L. Palmer,
G. Clayman,
M. F. Mitchell, and
R. Richards-Kortum,
“Noninvasive diagnosis of oral neoplasia based on fluorescence spectroscopy and native tissue autofluorescence,”
Arch. Otolaryngol. Head Neck Surg., 124 1251
–1258
(1998). 0886-4470 Google Scholar
M. G. Muller,
T. A. Valdez,
I. Georgakoudi,
V. Backman,
C. Fuentes,
S. Kabani,
N. Laver,
Z. Wang,
C. W. Boone,
R. R. Dasari,
S. M. Shapshay, and
M. S. Feld,
“Spectroscopic detection and evaluation of morphologic and biochemical changes in early human oral carcinoma,”
Cancer, 97
(7), 1681
–1692
(2003). 0008-543X Google Scholar
D. C. G. d. Veld,
M. Skurichina,
M. J. H. Witjes,
R. P. W. Duin,
H. J. C. M. Sterenborg, and
J. L. N. Roodenburg,
“Clinical study for classification of benign, dysplastic, and malignant oral lesions using autofluorescence spectroscopy,”
J. Biomed. Opt., 9
(5), 940
–950
(2004). https://doi.org/10.1117/1.1782611 1083-3668 Google Scholar
S. P. Schantz,
V. Kolli,
H. E. Savage,
G. Yu,
J. P. Shah,
D. E. Harris,
A. Katz,
R. R. Alfano, and
A. G. Huvos,
“In vivo native cellular fluorescence and histological characteristics of head and neck cancer,”
Clin. Cancer Res., 4
(5), 1177
–1182
(1998). 1078-0432 Google Scholar
J. K. Dhingra, D. F. Perrault Jr., K. McMillan,
E. E. Rebeiz,
S. Kabani,
R. Manoharan,
I. Itzkan,
M. S. Feld, and
S. M. Shapshay,
“Early diagnosis of upper aerodigestive tract cancer by autofluorescence,”
Arch. Otolaryngol. Head Neck Surg., 122
(11), 1181
–1186
(1996). 0886-4470 Google Scholar
D. L. Heintzelman,
U. Utzinger,
H. Fuchs,
A. Zuluaga,
K. Gossage,
A. M. Gillenwater,
R. Jacob,
B. Kemp, and
R. R. Richards-Kortum,
“Optimal excitation wavelengths for in vivo detection of oral neoplasia using fluorescence spectroscopy,”
Photochem. Photobiol., 72
(1), 103
–113
(2000). https://doi.org/10.1562/0031-8655(2000)072<0103:OEWFIV>2.0.CO;2 0031-8655 Google Scholar
A. Gillenwater,
V. Papadimitrakopoulou, and
R. Richards-Kortum,
“Oral premalignancy: new methods of detection and treatment,”
Curr. Oncol. Rep., 8
(2), 146
–154
(2006). Google Scholar
D. C. G. De Veld,
M. J. H. Witjes,
H. J. C. M. Sterenborg, and
J. L. N. Roodenburg,
“The status of in vivo autofluorescence spectroscopy and imaging for oral oncology,”
Oral Oncol., 41
(2), 117
–131
(2005). https://doi.org/10.1016/j.oraloncology.2004.07.007 0964-1955 Google Scholar
S. G. Demos and
R. R. Alfano,
“Temporal gating in highly scattering media by the degree of optical polarization,”
Opt. Lett., 21
(2), 161
–163
(1996). 0146-9592 Google Scholar
S. L. Jacques,
J. R. Roman, and
K. Lee,
“Imaging superficial tissues with polarized light,”
Lasers Surg. Med., 26 119
–129
(2000). https://doi.org/10.1002/(SICI)1096-9101(2000)26:2<119::AID-LSM3>3.0.CO;2-Y 0196-8092 Google Scholar
R. R. Anderson,
“Polarized light examination and photography of the skin,”
Arch. Dermatol., 127
(7), 1000
–1005
(1991). https://doi.org/10.1001/archderm.127.7.1000 0003-987X Google Scholar
V. Backman,
R. Gurjar,
K. Badizadegan,
I. Itzkan,
R. R. Dasari,
L. T. Perelman, and
M. S. Feld,
“Polarized light scattering spectroscopy for quantitative measurement of epithelial cellular structures in situ,”
IEEE J. Sel. Top. Quantum Electron., 5
(4), 1019
–1026
(1999). https://doi.org/10.1109/2944.796325 1077-260X Google Scholar
K. Sokolov,
R. Drezek,
K. Gossage, and
R. Richards-Kortum,
“Reflectance spectroscopy with polarized light: is it sensitive to cellular and nuclear morphology,”
Opt. Express, 5
(13), 302
–317
(1999). 1094-4087 Google Scholar
L. Nieman,
A. Myakov,
J. Aaron, and
K. Sokolov,
“Optical sectioning using a fiber probe with an angled illumination-collection geometry: evaluation in engineered tissue phantoms,”
Appl. Opt., 43
(6), 1308
–1319
(2004). https://doi.org/10.1364/AO.43.001308 0003-6935 Google Scholar
K. Sokolov,
L. T. Nieman,
A. Myakov, and
A. Gillenwater,
“Polarized reflectance spectroscopy for precancer detection,”
Technol. Cancer Res. Treat., 3
(1), 1
–14
(2004). 1533-0346 Google Scholar
“Threshold limit values and biological exposure indices,”
(1996). Google Scholar
J. A. Hanley,
“The meaning and use of the area under a receiver operating characteristic (ROC) curve,”
Radiology, 143
(1), 29
–36
(1982). 0033-8419 Google Scholar
A. Myakov,
L. Nieman,
L. Wicky,
U. Utzinger,
R. Richards-Kortum, and
K. Sokolov,
“Fiber optic probe for polarized reflectance spectroscopy in vivo: design and performance,”
J. Biomed. Opt., 7
(3), 388
–397
(2002). https://doi.org/10.1117/1.1483314 1083-3668 Google Scholar
R. O. Duda and
P. E. Hart, Pattern Classification and Scene Analysis, Wiley, New York (1973). Google Scholar
B. Efron and
R. J. Tibshirani, An Introduction to the Bootstrap, Chapman & Hall, New York (1993). Google Scholar
N. Ancona,
R. Maglietta,
A. Piepoli,
A. D’Addabbo,
R. Cotugno,
M. Savino,
S. Liuni,
M. Carella,
G. Pesole, and
F. Perri,
“On the statistical assessment of classifiers using DNA microarray data,”
BMC Bioinf., 7
(1), 387
(2006). 1471-2105 Google Scholar
A. Nath,
K. Rivoire,
C. Sung,
D. Cox,
E. N. Atkinson,
M. Follen, and
R. Richards-Kortum,
“Effect of probe pressure on cervical fluorescence spectroscopy measurements,”
J. Biomed. Opt., 9
(3), 523
–533
(2004). https://doi.org/10.1117/1.1695562 1083-3668 Google Scholar
R. K. Jain,
“Antiangiogenic therapy for cancer: current and emerging concepts,”
Oncology, 19
(4 Suppl 3), 7
–16
(2005). 0030-2414 Google Scholar
R. Drezek,
M. Guillaud,
T. Collier,
I. Boiko,
A. Malpica,
C. MacAulay,
M. Follen, and
R. Richards-Kortum,
“Light scattering from cervical cells throughout neoplastic progression: influence of nuclear morphology, DNA content, and chromatin texture,”
J. Biomed. Opt., 8
(1), 7
–16
(2003). https://doi.org/10.1117/1.1528950 1083-3668 Google Scholar
M. P. Siegel,
Y. L. Kim,
H. K. Roy,
R. K. Wali, and
V. Backman,
“Assessment of blood supply in superficial tissue by polarization-gated elastic light-scattering spectroscopy,”
Appl. Opt., 45
(2), 335
–342
(2006). https://doi.org/10.1364/AO.45.000335 0003-6935 Google Scholar
G. Zonios,
L. T. Perelman,
V. Backman,
R. Manoharan,
M. Fitzmaurice,
J. Van Dam, and
M. S. Feld,
“Diffuse reflectance spectroscopy of human adenomatous colon polyps in vivo,”
Appl. Opt., 38
(31), 6628
–6637
(1999). 0003-6935 Google Scholar
M. P. L. Bard,
A. Amelink,
M. Skurichina,
M. d. Bakker,
S. A. Burgers,
J. P. v. Meerbeeck,
R. P. W. Duin,
J. G. J. V. Aerts,
H. C. Hoogsteden, and
H. J. C. M. Sterenborg,
“Improving the specificity of fluorescence bronchoscopy for the analysis of neoplastic lesions of the bronchial tree by combination with optical spectroscopy: preliminary communication,”
Lung Cancer, 47 41
–47
(2005). 0169-5002 Google Scholar
Y. S. Fawzy,
M. Petek,
M. Tercelj, and
H. Zeng,
“In vivo assessment and evaluation of lung tissue morphologic and physiological changes from non-contact endoscopic reflectance spectroscopy for improving lung cancer detection,”
J. Biomed. Opt., 11
(4), 044003
(2006). https://doi.org/10.1117/1.2337529 1083-3668 Google Scholar
J. J. Sciubba,
“Oral leukoplakia,”
Crit. Rev. Oral Biol. Med., 6
(2), 147
–160
(1995). 1045-4411 Google Scholar
S. Silverman Jr., M. Gorsky, and
F. Lozada,
“Oral leukoplakia and malignant transformation. A follow-up study of 257 patients,”
Cancer, 53
(3), 563
–568
(1984). 0008-543X Google Scholar
J. Reibel,
“Prognosis of oral pre-malignant lesions: significance of clinical, histopathological, and molecular biological characteristics,”
Crit. Rev. Oral Biol. Med., 14
(1), 47
–62
(2003). 1045-4411 Google Scholar
P. Holmstrup,
P. Vedtofte,
J. Reibel, and
K. Stoltze,
“Long-term treatment outcome of oral premalignant lesions,”
Oral Oncol., 42
(5), 461
–474
(2006). 0964-1955 Google Scholar
L. Zhang,
M. Williams,
C. F. Poh,
D. Laronde,
J. B. Epstein,
S. Durham,
H. Nakamura,
K. Berean,
A. Hovan,
N. D. Le,
G. Hislop,
R. Priddy,
J. Hay,
W. L. Lan, and
M. P. Rosin,
“Toluidine blue staining identifies high-risk primary oral premalignant lesions with poor outcome,”
Cancer Res., 65
(17), 8017
–8021
(2005). 0008-5472 Google Scholar
S. Silverman and
P. B. Sugerman,
“Oral premalignancies and squamous cell carcinoma,”
Clin. Dermatol., 18
(5), 563
–568
(2000). 0738-081X Google Scholar
A. Amelink and
H. J. C. M. Sterenborg,
“Measurement of the local optical properties of turbid media by differential path-length spectroscopy,”
Appl. Opt., 43
(15), 3048
–3054
(2004). https://doi.org/10.1364/AO.43.003048 0003-6935 Google Scholar
R. L. P. v. Veen,
A. Amelink,
M. Menke-Pluymers,
C. V. D. Pol, and
H. J. C. M. Sterenborg,
“Optical biopsy of breast tissue using differential path-length spectroscopy,”
Phys. Med. Biol., 50 2573
–2581
(2005). https://doi.org/10.1088/0031-9155/50/11/009 0031-9155 Google Scholar
I. Georgakoudi,
E. E. Sheets,
M. G. Muller,
V. Backman,
C. P. Crum,
K. Badizadegan,
R. R. Dasari, and
M. S. Feld,
“Trimodal spectroscopy for the detection and characterization of cervical precancers in vivo,”
Am. J. Obstet. Gynecol., 186
(3), 374
–382
(2002). https://doi.org/10.1067/mob.2002.121075 0002-9378 Google Scholar
C.-Y. Wang,
T. Tsai,
H.-M. Chen,
C.-T. Chen, and
C.-P. Chiang,
“PLS-ANN based classification model for oral submucous fibrosis and oral carcinogenesis,”
Lasers Surg. Med., 32
(4), 318
–326
(2003). https://doi.org/10.1002/lsm.10153 0196-8092 Google Scholar
B. Kulapaditharom and
V. Boonkitticharoen,
“Performance characteristics of fluorescence endoscope in detection of head and neck cancers,”
Ann. Otol. Rhinol. Laryngol., 110
(1), 45
–52
(2001). 0003-4894 Google Scholar
D. C. G. d. Veld,
M. Skurichina,
M. J. H. Witjes,
R. P. W. Duin,
H. J. C. M. Sterenborg, and
J. L. N. Roodenburg,
“Autofluorescence and diffuse reflectance spectroscopy for oral oncology,”
Lasers Surg. Med., 36
(5), 356
–364
(2005). https://doi.org/10.1002/lsm.20122 0196-8092 Google Scholar
|
|||||||||||||||||||||||||||||||||||||||||||||||||||||||||||||||||||||||||||||||||||||||||||||||||||||||||||||||||||||||||||||||||||||||||||||||||||||||||||||||||||||||||||||||||||||||||||||||||||||||||||||||||||||||||||||||||||||||||||||||||||||||||||||||||||||||||||||||||||||||


