
|
|
1.IntroductionThe signaling pathways that regulate cellular functions are mediated by the specific interactions between proteins that lead to the formation of transient complexes. The assembly of these protein complexes is being investigated through the combination of biochemical, genetic, and molecular approaches. However, the biochemical methods and screening approaches that are typically used to detect protein interactions may fail to reveal weak or transient interactions that occur only within the context of the intact cell. Therefore, it is critical to complement these in-vitro approaches with noninvasive imaging techniques that allow the visualization of dynamic protein interactions in their natural environment within the living cell. The genetically encoded fluorescent proteins (FPs), used in combination with fluorescence microscopy, provide the tools necessary for the direct visualization of protein interactions inside living specimens.1 Many different color FPs have been developed over the past decade from the engineering of the Aequorea green FP (GFP)2, 3, 4 and coral red FP,5, 6 as well as the cloning of GFP-like proteins from other animals.7 The sequence encoding a FP can be linked to the sequence coding for any defined cellular protein, allowing the fusion proteins to be produced in living cells. Fluorescence microscopy can then be used for colocalization experiments in the living specimens. The spatial resolution of the conventional light microscope, however, is insufficient to directly detect specific protein-protein interactions. One technique that overcomes this limitation is Förster resonance energy transfer (FRET) microscopy. FRET-based microscopy techniques detect the effect of the nonradiative transfer of excitation energy from a donor to an acceptor fluorophore. Because energy transfer depends on the near-field dipole-dipole interactions between the fluorophores, FRET can only occur when the fluorophores are separated by less than about . Thus, FRET microscopy can be used to measure the spatial relationships between proteins on the scale of angstroms, allowing the analysis of protein-protein interactions and protein conformational changes. A key condition for FRET is the strong spectral overlap between the donor emission and the acceptor absorption spectra.8 Although many different FPs fulfill this requirement, the most popular FRET pair currently is the combination of the Aequorea-based cyan FP (CFP) and yellow FP (YFP). 3, 4, 5, 6, 9, 10 Since their introduction, many changes have been made to both CFP and YFP that improve their utility in FRET-based assays. For example, Nagai 11 developed a brighter YFP called Venus that has more efficient maturation and reduced pH and halide sensitivity. Additionally, Rizzo 12 showed that substitutions on the solvent-exposed surface of CFP stabilized its excited state, and produced a protein with an increased quantum yield called Cerulean. Recent studies have confirmed that the Cerulean and Venus variants are among the most efficient of the FP FRET pairs available.13 However, there are several limitations to the use of this popular FP pair in FRET-based imaging with laser scanning microscope (LSM) systems, and these are addressed in this study. Therefore, it is important to characterize new FPs that might overcome some of these limitations. Recently, a new FP that emits in the cyan color spectrum was introduced that has improved brightness and photostability.14 This new FP, called monomeric teal fluorescent protein (mTFP), was generated by the directed evolution of an optimized synthetic gene library based on the sequence of a tetrameric cyan protein, cFP484, from the coral Clavularia. Unlike CFP, which has a tryptophan residue at the central chromophore position, mTFP has a tyrosine residue in this position, which is typical of the GFPs. Indeed, both the excitation and emission spectra of the mTFP are shifted to the green wavelengths when compared to CFP. The mTFP protein has a high quantum yield and displays a relatively narrow emission spectrum that strongly overlaps the excitation spectrum of the yellow and orange FPs.5, 14 In this study, we compared the Cerulean FP and mTFP as FRET donors to the Venus FP in live-cell imaging assays. 2.Materials and Methods2.1.Expression VectorsThe plasmid vector encoding the mTFP (gene bank accession DQ676819) was obtained from Davidson at Florida State University and is commercially available from Allele Biotechnology and Pharmaceuticals (San Diego, California). The cDNA for Venus was obtained from Miyawaki at RIKEN, Japan.11 The Cerulean FP was generated by mutagenesis of the sequence encoding the enhanced CFP to incorporate the S72A, Y145A, and H148D changes.12 The plasmid encoding the FRET standard fusion protein consisting of Cerulean tethered to Venus by a five amino acid (aa) linker (Cer-5aa-Venus) was a gift from Vogel at the National Institutes of Health and was described earlier.15 The plasmid encoding a similar mTFP FRET standard fusion protein (mTFP-5aa-Venus) was made by substitution of the coding sequence for Cerulean with the cDNA for mTFP, which was generated by PCR with primers incorporating suitable restriction enzyme sites. The Cer-TRAF-Venus plasmid encodes a fusion protein with Cerulean and Venus separated by the 229-amino acid tumor necrosis factor receptor associated factor (TRAF) domain.15 A similar mTFP-TRAF-Venus was made by substitution of the coding sequence for Cerulean with the cDNA for mTFP. 2.2.Tissue Culture and TransfectionMouse pituitary GHFT1 cells16 were maintained as monolayer cultures in Dulbecco’s Modified Eagles Medium (DMEM) containing 10% newborn calf serum. The cells were harvested by brief treatment with trypsin, recovered by centrifugation, and resuspended in Dulbecco’s calcium-magnesium free phosphate-buffered saline with 0.1% glucose and BioBrene (Applied Biosystems, Inc., Foster City, California) at a final concentration of approximately per ml. The cells were transfected with the indicated plasmid DNA(s) by electroporation as described earlier.17, 18 The amount of input DNA was kept constant using empty vector DNA. For imaging the living cells, suspensions of the transfected cells were added drop-wise onto a sterile 25-mm or 42-mm cover glass in culture dishes, and the cells were allowed to attach to the glass prior to gently flooding the culture dish with media. The cultures were maintained in an incubator for before imaging. The cover glass with attached cells was then inserted into a chamber, which was filled with -independent medium and placed on the microscope stage. 2.3.Spectral Imaging and PhotobleachingA Zeiss Axiovert 200M epifluorescent motorized microscope equipped with a plan-apochromat oil NA 1.4 objective lens, and coupled to the Zeiss 510 confocal-multiphoton-spectral imaging system was used for the studies described here. The system was controlled using the LSM software (version 3.5). For spectral FRET imaging, the HFT 458/514 beamsplitter was used in combination with the 32-channel spectral detector and optical grating system to collect lambda stacks consisting of a series of images at emission wavelengths separated by 10.7-nm steps. An algorithm that defines the spectral signature for each pixel of the scanned confocal image was used for digital separation of the component signals.19 For the photobleaching studies, images of cells expressing either Cerulean or mTFP were acquired using a 458-nm-argon laser line at laser power measured at the specimen plane. The cells with approximately 2000-gray-level intensity were then selected and exposed to 80 scan cycles using the same laser power, and the normalized gray-level intensity was plotted for each scan. 2.4.Fluorescence Lifetime MeasurementsThe fluorescence lifetime measurements were made using a Nikon TE300 epi-fluorescent microscope equipped with a Plan Fluor NA 1.2 water IR objective lens. The microscope was coupled to the Radiance 2100 confocal/multiphoton system and a 10-W Verdi pumped, tunable (700 to ) mode-locked ultrafast pulsed laser (Mira 900, Coherent, Incorporated). The LaserSharp2000 multiphoton configuration was used to scan the specimen, and the photon-counting module board (SPC-730, Becker and Hickl GmbH, Berlin, Germany) in the Radiance2100 computer matched the and scan synchronizing pulses with the pixel clock signal from the control unit, allowing pixel-by-pixel registration of the accumulated photons with the laser scanning. The detector was a fast photomultiplier tube (PMT), with a response time of approximately (PMH-100, Becker and Hickl GmbH, Berlin, Germany). The minimum temporal resolution of the imaging system was approximately .20 The excitation beam was tuned to for Cerulean or for mTFP, and the lifetime images were acquired using a 480/30-nm emission filter. The laser excitation power was measured at the specimen plane using a power meter (SSIM-VIS-IR, Coherent, Incorporated), and was typically 0.7 to . At this power, a data acquisition time of resulted in the accumulation of approximately 2000 photon counts on the PMT. Fluorescence lifetimes were measured by the time-correlated single photon counting (TCSPC) method. A fluorescence decay histogram of photon emission times relative to the laser excitation pulse was generated from the distribution of interpulse intervals at each pixel of the image. The data analysis software (SPCImage version 2.9, Becker and Hickl GmbH) allows multiexponential curve fitting of the acquired data on a pixel-by-pixel basis using a weighted least-squares numerical approach. 3.Results and Discussion3.1.Spectral Characteristics of Cerulean-Venus and mTeal-Venus Förster Resonance Energy Transfer PairsHere, we compared and contrasted Cerulean and the newly developed mTFP as donor FPs for Venus in FRET experiments. The new mTFP has several qualities that suggest it could serve as an improved partner for Venus in intensity-based FRET measurements. First, the donor used in FRET studies should have a high quantum yield, and ideally be of similar brightness to the acceptor. In this regard, Cerulean is about half as bright as Venus, whereas the mTFP and Venus have nearly identical brightness (Table 1 ). Second, the 458-nm-argon laser line that is available on most LSM systems is typically used to excite the donor fluorophore in FRET studies. This laser line, however, is not efficient for the excitation of CFP (peak excitation ), and causes some excitation of the YFP acceptor, resulting in acceptor spectral bleed-through (ASBT) signal in the FRET channel [Fig. 1a ]. In contrast, the 458-nm laser line is optimal for exciting mTFP (peak excitation ), improving the efficiency of donor excitation without changing the ASBT contribution [Fig. 1b]. Fig. 1The spectral overlap of Cerulean or mTFP with Venus is compared. The excitation and emission spectra for (a) CFP or (b) mTFP in combination with Venus are shown, illustrating the spectral overlap (gray shaded area). The 458-nm laser line and the FRET emission channel (535 to ) are shown, with DSBT into the FRET channel indicated by cross-hatching. (c) The efficiency of energy transfer is plotted as a function of the separation distance for both the Cerulean-Venus and mTFP-Venus fluorophore pairs, and was determined according to Eq. 1 (see Sec. 3.1). The value was determined from the overlap integral (see Table 1). The separation distance spanning the range of 0.5 to 1.5 is shaded. (d) The difference in for the Cerulean-Venus and mTFP-Venus pairs is plotted as a function of separation distance.  Table 1The characteristics of the Aequorea-based Cerulean and Venus, and the Clavularia-based mTFP.
Intrinsic brightness is the product of quantum yield x extinction coefficient (see Ref. 5).
R0
with Venus is determined by
R0=0.211
[(k2)(n−4)(QYD)(Jλ)]0.1667
. NA is not applicable. FRET efficiency, defined as the fraction of donor excitation energy that is transferred to an acceptor, is improved by increasing the spectral overlap integral of the donor emission with the absorption spectrum of the acceptor [Fig. 1]. However, it is also important that the donor spectrum is sufficiently narrow to limit the donor spectral bleed-through (DSBT) into the FRET channel. The comparison of the spectral overlap of either CFP or mTFP with Venus illustrates how the donor emission leads to DSBT [Figs. 1a and 1b]. Significantly, although the peak emission of mTFP is green shifted by compared to CFP, its narrow emission spectrum reduces the DSBT component in the FRET channel relative to that for CFP [Figs. 1a and 1b]. What is more, despite its narrow emission spectrum, mTFP shares more overlap with Venus than does CFP, and the increased results in a larger Förster distance [ ; see Fig. 1c and Table 1]. The dependence of FRET efficiency on the distance separating the fluorophores is described by the equation: Because varies as the inverse of the sixth power of the separation distance between the fluorophores, the graph representing this relationship falls off sharply over the range of to [Fig. 1c]. Therefore, the increased for the mTFP-Venus pair (Fig. 1 and Table 1) has a significant effect on the FRET efficiency over this range. When compared to Cerulean, the for mTFP to Venus is predicted to increase as much as 17% for separation distances around the [Fig. 1d]. Thus, the increased brightness and improved spectral overlap make the combination of mTFP and Venus an attractive pair for FRET measurements. Other factors, however, are also important in determining whether a particular FP pair will perform well in live-cell imaging experiments.3.2.Photostability of Cerulean and Teal Fluorescent ProteinsWhen making FRET measurements, it is important that the donor fluorophore be stable under the conditions and time frame used in the experiments. In their earlier study, Ai 14 demonstrated using purified proteins that the mTFP was more photostable than Cerulean. Here, we directly compared the photostability of Cerulean and mTFP that were expressed in living cells. The cells producing similar levels of either Cerulean or mTFP were identified by LSM using illumination with the 458-nm laser line. The selected cells were then subjected to repeated scan cycles at laser power measured at the focal plane, a power level that is typically used in our experiments. Under these conditions, the rates of photobleaching for mTFP and Cerulean were similar (Fig. 2 ). However, given that the molar extinction coefficients are for Cerulean (measured at the peak of the absorption spectrum at ), and for mTFP (measured at the peak of the mTFP absorption spectrum at ), and that Cerulean is excited at where the absorption is about 75%, we would expect about twice as many molecules of mTFP to be excited under these conditions. This result indicates that mTFP was more photostable than Cerulean when expressed in living cells. Fig. 2The photobleaching characteristics of Cerulean or mTFP when illuminated with the 458-nm laser line are compared. Cells that expressed either Cerulean or mTFP were illuminated with the 458-nm laser line using laser power at the specimen plane, and a single scan was acquired. Cells with approximately 2000 gray-level intensity were selected and exposed to 80 scan cycles using the same laser power. The mean normalized gray-level intensity for each consecutive scan was determined for three to five cells.  3.3.Spectral Förster Resonance Energy Transfer Imaging of Teal and Venus Fusion ProteinsThe accurate measurement of FRET signals requires the removal of both the donor and the acceptor SBT background from the signal acquired in the FRET channel.21, 22 In this regard, spectral imaging combined with linear unmixing is among the most accurate methods for removing the contribution of DSBT from the FRET signal. 19, 23, 24, 25 Here, we used the 32-channel spectral detector to collect lambda stacks at a bandwidth of to generate the reference spectra for the unlinked Cerulean, mTFP, or Venus proteins [Figs. 3a, 3b, 3c ]. The reference spectra were used for unmixing of the component signals obtained from cells that expressed the different fusion proteins. The spectral unmixing approach allowed the removal of the DSBT from the FRET signal, avoiding potential problems associated with this correction that is common in filter-based imaging.22 However, because the spectra for both the FRET signal and the ASBT are identical [Fig. 3c], other methods must be used to correct for the ASBT component. Fig. 3The emission spectra were acquired from cells that expressed the Cerulean, mTFP, or Venus FPs. Spectral imaging with the 32-channel detector was used to collect lambda stacks at a bandwidth of from cells that expressed either (a) Cerulean, (b) mTFP, or (c) Venus; the calibration bar indicates . The lambda stacks were used to generate the reference spectra shown for each fluorophore. (c) The Venus emission spectrum was acquired with excitation using either the 514-nm (solid line) or 458-nm (dotted line) laser line. These reference spectra were used for spectral unmixing of the component signals from cells that expressed the Cerulean-Venus or mTFP-Venus fusion proteins. 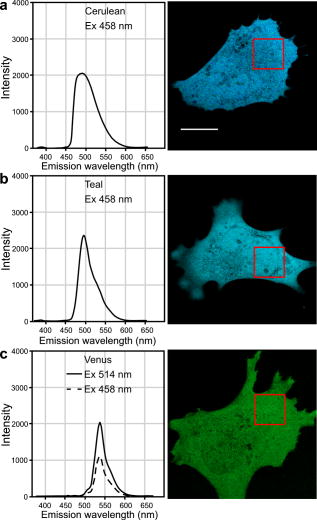 Recently, we developed an approach to remove the ASBT component from the spectral FRET (ps-FRET) data that is similar to other established methods for SBT correction in filter-based FRET microscopy systems.25 The ps-FRET approach was used to quantify FRET signals from fusion proteins consisting of either Cerulean or mTFP coupled to Venus. In an earlier study, Thaler 15 showed that the Cer-5aa-Venus fusion protein yielded average FRET efficiencies of approximately 45%, and we have confirmed this result.25 Here, we compared the spectral measurements acquired from cells expressing either Cer-5aa-Venus or mTFP-5aa-Venus (see Sec. 2, Materials and Methods). In addition, we also characterized the signals from fusion proteins designed to have low FRET efficiencies. Earlier, Thaler 15 showed that insertion of the 229 aa TRAF domain between Cerulean and Venus (Cer-TRAF-Venus) reduced the average FRET efficiency for the fusion protein to less than 10%. We used this fusion protein, as well as the mTFP-TRAF-Venus (see Sec. 2, Material and Methods) fusion protein to characterize measurements of low FRET efficiency. The emission spectra for the different fusion proteins were obtained using excitation with the 458-nm laser line. The quantification of the ps-FRET measurements is presented in Table 2, and representative spectra for each of the fusion proteins are shown in Fig. 4 . The results graphically illustrate the relative contributions of sensitized acceptor emission and SBT signals to the emission spectra for the different fusion proteins (Fig. 4). The emission spectra for the strong FRET standard proteins (Cer-5aa-Venus or mTFP-5aa-Venus) clearly show the contribution of sensitized acceptor emission to the spectral profile [Figs. 4a and 4b]. In contrast, comparison of the spectra from the fusion proteins with weak FRET signals (Cer-TRAF-Venus and mTFP-TRAF-Venus) revealed the contribution of ASBT [Fig. 4b]. Moreover, comparison of the donor and ASBT peaks for the two different TRAF-linked fusion proteins demonstrated how the increased brightness of mTFP (Table 1) improved the donor signal relative to the ASBT signal [Figs. 4a and 4b]. The quantified ps-FRET results (Table 2 ) showed a modest improvement in for the mTFP-5aa-Venus fusion protein when compared to the Cerulean-5aa-Venus fusion protein. Fig. 4The spectral measurements of the signal from cells expressing either (a) Cerulean or (b) mTFP directly coupled to Venus. The calibration bar indicates . The FRET standards (Cer-5aa-Venus and mTFP-5aa-Venus) show a strong acceptor signal relative to the donor signal, which is consistent with FRET. In contrast, the Cer-TRAF-Venus and mTFP-TRAF-Venus show reduced acceptor signal relative to the donor, consistent with low FRET efficiency. Spectral imaging was used to collect lambda stacks from cells that expressed the fusion proteins, and the reference spectra in Fig. 3 were used for spectral unmixing of the component signals from cells that expressed the different fusion proteins to determine the mean FRET efficiency for each fusion protein (Table 2).  Table 2FRET measurements of Cerulean or mTFP fusions to Venus. Values for Cer-5aa-Venus for ps-FRET is ±SD , n=5 , and for τDA (ns) is determined by E=1−(τDA∕τD) ; see text.
3.4.Acceptor Photobleaching Förster Resonance Energy Transfer Imaging of the Teal-Venus Fusion ProteinsWe verified the ps-FRET measurements using acceptor photobleaching FRET (ap-FRET), a method that does not require correction for SBT. Here, the spectra for the mTFP-5aa-Venus and mTFP-TRAF-Venus fusion proteins measured using excitation with the 458-nm laser line, and the linked Venus fluorophores, were then selectively photobleached using the 514 laser line. The spectra were then reacquired under identical conditions to the first measurements, and changes in the donor signal were measured. The pre- and postacceptor bleach spectra for mTFP-5aa-Venus [Fig. 5a ] revealed a significant increase in the donor signal, with a mean change of (determined for five ). In contrast, ap-FRET for the mTFP-TRAF-Venus fusion protein [Fig. 5b] yielded an average change in the donor signal of about 5%. Fig. 5The measurement of the changes in the donor signals from either the (a) mTFP-5aa-Venus or (b) mTFP-TRAF-Venus fusion proteins after acceptor photobleaching. Spectral measurements were acquired from cells expressing the indicated fusion proteins; the calibration bar indicates . The linked Venus fluorophore was then photobleached by more than 70% using the 514-nm laser line. The spectral measurements were then reacquired under identical conditions to the first, and changes in the donor signal were measured. The dashed line in (a) indicates the change in the donor signal for the mTFP-5aa-Venus fusion protein. In contrast, there was little change in the donor signal for (b) mTFP-TRAF-Venus following acceptor photobleaching. 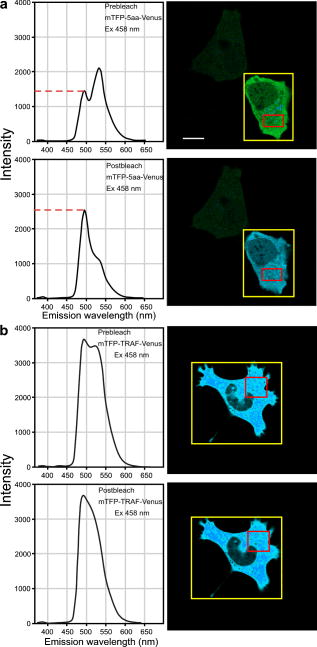 3.5.Fluorescence Lifetime Imaging Microscopy Förster Resonance Energy Transfer ImagingThe FLIM-FRET method was then used to confirm and extend these observations. Because FLIM relies on measurement of the donor fluorescence lifetime in the absence and presence of an acceptor, it provides a method for acquiring FRET measurements that is independent of the intensity-based approaches described before.8 Here, we used 2p excitation and the TCSPC method to acquire the donor fluorescence lifetime measurements (see Sec. 2, Material and Methods). The 2p excitation spectrum for mTFP was measured, and the results indicated that the peak 2p excitation for mTFP occurred near [Fig. 6a ]. In a previous study, we determined that was optimal for 2p excitation of CFP.20 The longer wavelength light reduces photobleaching and photodamage to the specimen outside the focal plane, but there can be substantial photobleaching of the fluorophores at the focal plane. Earlier, we showed that photobleaching of CFP could affect its excited-state lifetime,26 and we have made similar observations with other fluorophores (data not shown). Therefore, it was important to establish 2p excitation conditions that avoided photobleaching of the fluorophores. Here, we determined that both Cerulean and mTFP were stable under 2p excitation for the duration of the experimental measurements when using approximately 0.7 to laser power, measured at the specimen plane. The fluorescence lifetimes for Cerulean and mTFP were acquired by the TCSPC method using the pulsed laser line tuned to for Cerulean or for mTFP. The results showed that both Cerulean and mTFP had similar mean fluorescence lifetimes when measured in two different cellular environments (cytosol and nuclei) (Table 3 ). The fluorescence lifetime decay curves for Cerulean and mTFP were fitted to both single and double exponential decay models, and in both cases there was a better fit to the double exponential decay model (Table 3). Fig. 6The 2p-excitation spectrum for mTFP and donor lifetime measurements for the fusion proteins consisting of Cerulean or mTFP linked to Venus. (a) Cells expressing mTFP alone were illuminated at the indicated wavelength, and the normalize gray-level intensity was determined. (b) Cells expressing Cerulean or mTFP alone, or the FRET standards Cer-5aa-Venus or mTFP-5aa-Venus, were used to acquire fluorescence lifetime measurements as described in the text. The fluorescence lifetime decay kinetics for donor fluorophores alone or in the presence of Venus were determined by fitting the data to a double exponential decay. The lifetime distributions for representative cells expressing (c) Cerulean (the calibration bar indicates ), (d) mTFP, (e) Cer-5aa-Venus, or (f) mTFP-5aa-Venus are shown. The results of the fluorescence lifetime analysis are summarized in Tables 2, 3.  Table 3Fluorescence lifetime measurements for single (τ) and double exponential decays ( τ1 and τ2 ), determined for ROI in the cytosol or the nucleus for six cells.
The fluorescence lifetimes of Cerulean or mTFP expressed in living cells were then compared to measurements from cells that expressed the fusion proteins consisting of either Cerulean or mTFP tethered to Venus [Fig. 6b]. The lifetimes were determined by TCSPC using either (Cerulean) or (mTFP) to excite the donor fluorophores at a laser power that did not bleach the fluorophores (see Sec. 2.4, Material and Methods). Here, it is important to point out that because of the broad 2p excitation spectra for the FPs, there will be some excitation of Venus at both 820 and . Because we used low laser power to avoid donor photobleaching, it was necessary to select the peak excitation wavelength for mTFP, but this might not be optimal in all situations. The results were fitted using a double exponential decay model [Fig. 6b]. Additionally, representative lifetime images and graphs showing the lifetime distribution are provided for cells expressing each of the proteins [Figs. 6c, 6d, 6e, 6f]. For the FRET standards, Cer-5aa-Venus and mTFP-5aa-Venus, there was strong quenching of the donor, resulting in a shortening of the mean donor excited state lifetime [Table 2 and Figs. 6c, 6d, 6e, 6f]. These measurements were used to determine the FRET efficiency for the linked fluorophores, and results were in good agreement with the ps-FRET measurements (Table 2). Also agreeing with the ps-FRET measurements, we observed that there was significantly less quenching of the donor fluorophore for the Cer-TRAF-Venus and mTFP-TRAF-Venus, corresponding to FRET efficiencies of about 10% (Table 2). 4.ConclusionTogether, our studies indicate that mTFP has advantages over Cerulean as a FRET donor for Venus. The increased brightness of mTFP, and its optimal excitation using the standard 458-nm laser line, should improve the detection of proteins that are difficult to express in cells, or that need to be produced at low levels in cells. Furthermore, the increased photostability and improved spectral overlap with acceptor proteins, such as Venus or newer generation orange FPs,27 make mTFP an appealing donor fluorophore for FRET measurements. Here, we verified the intensity-based FRET measurements for the mTFP-Venus fusion protein by using fluorescence lifetime measurements. Finally, since the mTFP was engineered from a protein originating in a different species, the likelihood of dimer formation with the Aequorea FP variants is reduced. In this regard, Cerulean and mTFP share about 41% sequence homology, but there is little homology in the carboxyl terminal dimer interface identified for the Aequorea FPs.28 While the interactions between the FPs themselves is an unwanted characteristic for most FRET experiments,28 it can be an advantage in assays that use FRET-based biosensor probes. These probes have a sensor domain that directly links the donor and acceptor FPs, allowing conformational changes in the sensor domain to be detected by changes in the emission ratio.6 An earlier study sought to improve the dynamic range of the FRET sensor probes by using the directed coevolution of both CFP and YFP.29 This approach yielded sensor probes with substantially enhanced FRET signals, even though the evolved FPs had similar spectral characteristics and slightly decreased quantum yields when compared to the original FPs. This apparent contradiction was recently resolved when it was shown that the enhanced FRET signals resulted from mutations that promoted the stabilization of an intramolecular complex formed by the linked FPs.30, 31 Here, we show that mTFP has improved characteristics when compared to Cerulean as a FRET donor for Venus, but we do not observe the expected enhanced efficiency predicted by the increased [see Fig. 1d and Table 2]. The observation that the ps-FRET and FLIM-FRET measurements were in close agreement argues that it is not a photophysical property that limits energy transfer from mTFP to Venus. It is possible that there is a more stable association between the linked Cerulean and Venus FPs, which would effectively increase the average FRET efficiency of this pair. Alternatively, a less favorable orientation of the dipole vectors could lead to the lower FRET efficiency observed for the mTFP-Venus proteins. As with all new FPs, it is possible that unforeseen characteristics could potentially limit the utility of this new probe for particular applications. For example, the evolved red FPs27 have spectral characteristics that should make them excellent acceptor proteins for FRET, and yet these proteins have proven to be relatively poor FRET partners. This underscores the importance of the results shown here, which demonstrate that mTFP, with its increased brightness and photostability, and optimal excitation using the standard laser line, is an excellent donor fluorophore for FRET studies. AcknowledgmentsThis work was supported by NIH DK47301 (Day). The authors thank Joshua Mauldin for his suggestions and critical reading of this manuscript. ReferencesJ. E. Lippincott-Schwartz,
E. Snapp, and
A. Kenworthy,
“Studying protein dynamics in living cells,”
Nat. Rev. Mol. Cell Biol., 2 444
–456
(2001). 1471-0072 Google Scholar
R. Y. Tsien,
“The green fluorescent protein,”
Annu. Rev. Biochem., 67 509
–544
(1998). https://doi.org/10.1146/annurev.biochem.67.1.509 0066-4154 Google Scholar
J. Zhang,
J. R. E. Campbell,
A. Y. Ting, and
R. Y. Tsien,
“Creating new fluorescent probes for cell biology,”
Nat. Rev. Mol. Cell Biol., 3 906
–918
(2002). 1471-0072 Google Scholar
G. Patterson,
R. N. Day, and
D. Piston,
“Fluorescent protein spectra,”
J. Cell. Sci., 114 837
–838
(2001). 0021-9533 Google Scholar
N. C. Shaner,
R. E. Campbell,
P. A. Steinbach,
B. N. Giepmans,
A. E. Palmer, and
R. Y. Tsien,
“Improved monomeric red, orange and yellow fluorescent proteins derived from Discosoma sp. red fluorescent protein,”
Nat. Biotechnol., 22 1567
–1572
(2004). https://doi.org/10.1038/nbt1037 1087-0156 Google Scholar
B. N. Giepmans,
S. R. Adams,
M. H. Ellisman, and
R. Y. Tsien,
“The fluorescent toolbox for assessing protein location and function,”
Science, 312 217
–224
(2006). https://doi.org/10.1126/science.1124618 0036-8075 Google Scholar
Y. A. Labas,
N. G. Gurskaya,
Y. G. Yanushevich,
A. F. Fradkov,
K. A. Lukyanov,
S. A. Lukyanov, and
M. V. Matz,
“Diversity and evolution of the green fluorescent protein family,”
Proc. Natl. Acad. Sci. U.S.A., 99
(7), 4256
–4261
(2002). 0027-8424 Google Scholar
A. Periasamy and
R. N. Day, Molecular Imaging: FRET Microscopy and Spectroscopy,
(2005) Google Scholar
R. Heim and
R. Y. Tsien,
“Engineering green fluorescent protein for improved brightness, longer wavelengths and fluorescence resonance energy transfer,”
Curr. Biol., 6 178
–182
(1996). https://doi.org/10.1016/S0960-9822(02)00450-5 0960-9822 Google Scholar
M. Ormö,
A. B. Cubitt,
K. Kallio,
L. A. Gross,
R. Y. Tsien, and
S. J. Remington,
“Crystal structure of the Aequorea victoria green fluorescent protein,”
Science, 273 1392
–1395
(1996). 0036-8075 Google Scholar
T. Nagai,
K. Ibata,
E. S. Park,
M. Kubota,
K. Mikoshiba, and
A. Miyawaki,
“A variant of yellow fluorescent protein with fast and efficient maturation for cell-biological applications,”
Nat. Biotechnol., 20 87
–90
(2002). https://doi.org/10.1038/nbt0102-87 1087-0156 Google Scholar
M. A. Rizzo,
G. H. Springer,
B. Granada, and
D. W. Piston,
“An improved cyan fluorescent protein variant useful for FRET,”
Nat. Biotechnol., 22 445
–449
(2004). https://doi.org/10.1038/nbt945 1087-0156 Google Scholar
S. V. Koushik,
H. Chen,
C. Thaler,
H. Puhl 3rd, and
S. S. Vogel,
“Cerulean, Venus, and VenusY67C FRET reference standards,”
Biophys. J., 91
(12), L99
–L101
(2006). https://doi.org/10.1529/biophysj.106.096206 0006-3495 Google Scholar
H. W. Ai,
N. J. Henderson,
S. J. Remington, and
R. E. Campbell,
“Directed evolution of a monomeric, bright and photostable version of Clavularia cyan fluorescent protein: structural characterization and applications in fluorescence imaging,”
Biochem. J., 400
(3), 531
–540
(2006). 0264-6021 Google Scholar
C. Thaler,
S. V. Koushik,
P. S. Blank, and
S. S. Vogel,
“Quantitative multiphoton spectral imaging and its use for measuring resonance energy transfer,”
Biophys. J., 89 2736
–2749
(2005). https://doi.org/10.1529/biophysj.105.061853 0006-3495 Google Scholar
D. Lew,
H. Brady,
K. Klausing,
K. Yaginuma,
L. E. Theill,
C. Stauber,
M. Karin, and
P. L. Mellon,
“GHF-1-promoter-targeted immortalization of a somatotropic progenitor cell results in dwarfism in transgenic mice,”
Genes Dev., 7 683
–693
(1992). 0890-9369 Google Scholar
R. N. Day,
A. Periasamy, and
F. Schaufele,
“Fluorescence resonance energy transfer microscopy of localized protein interactions in the living cell nucleus,”
Methods, 25 4
–18
(2001). 1046-2023 Google Scholar
J. F. Enwright,
M. A. Kawecki-Crook,
T. C. Voss,
F. Schaufele, and
R. N. Day,
“A PIT-1 homeodomain mutant blocks the intranuclear recruitment of the CCAAT/Enhancer Binding Protein alpha required for prolactin gene transcription,”
Mol. Endocrinol., 17 209
–222
(2003). 0888-8809 Google Scholar
M. E. Dickinson,
E. Simbuerger,
B. Zimmermann,
C. W. Waters, and
S. E. Fraser,
“Multiphoton excitation spectra in biological samples,”
J. Biomed. Opt., 8 329
–338
(2003). https://doi.org/10.1117/1.1583734 1083-3668 Google Scholar
Y. Chen and
A. Periasamy,
“Characterization of two-photon excitation fluorescence lifetime imaging microscopy for protein localization,”
Microsc. Res. Tech., 63 72
–80
(2004). https://doi.org/10.1002/jemt.10430 1059-910X Google Scholar
Y. Chen,
M. Elangovan, and
A. Periasamy,
“FRET data analysis—the algorithm,”
Molecular Imaging: FRET Microscopy and Spectroscopy, 126
–145 Oxford University Press, New York (2005). Google Scholar
C. Berney and
G. Danuser,
“FRET or no FRET: a quantitative comparison,”
Biophys. J., 84 3992
–4010
(2003). 0006-3495 Google Scholar
R. Clegg,
“Fluorescence resonance energy transfer and nucleic acids,”
Methods Enzymol., 211 353
–388
(1992). 0076-6879 Google Scholar
T. Zimmermann,
J. Rietdorf,
A. Girod,
V. Georget, and
R. Pepperkok,
“Spectral imaging and linear un-mixing enables improved FRET efficiency with a novel GFP2-YFP FRET pair,”
FEBS Lett., 531 245
–249
(2002). https://doi.org/10.1016/S0014-5793(02)03508-1 0014-5793 Google Scholar
Y. Chen,
J. P. Mauldin,
R. N. Day, and
A. Periasamy,
“Characterization of spectral FRET imaging microscopy for monitoring nuclear protein interactions,”
J. Microsc., 228 139
–152
(2007). https://doi.org/10.1111/j.1365-2818.2007.01838.x 0022-2720 Google Scholar
R. N. Day,
I. A. Demarco,
T. C. Voss,
Y. Chen, and
A. Periasamy,
“FLIM-FRET microscopy to visualize transcription factor interactions in the nucleus of the living cell,”
Proc. SPIE, 5323 36
–43
(2004). 0277-786X Google Scholar
N. C. Shaner,
P. A. Steinbach, and
R. Y. Tsien,
“A guide to choosing fluorescent proteins,”
Nat. Methods, 2 905
–909
(2005). 1548-7091 Google Scholar
D. A. Zacharias,
J. D. Violin,
A. C. Newton, and
R. Y. Tsien,
“Partitioning of lipid-modified monomeric GFPs into membrane microdomains of live cells,”
Science, 296 913
–916
(2002). https://doi.org/10.1126/science.1068539 0036-8075 Google Scholar
A. W. Nguyen and
P. S. Daugherty,
“Evolutionary optimization of fluorescent proteins for intracellular FRET,”
Nat. Biotechnol., 23
(3), 355
–360
(2002). https://doi.org/10.1038/nbt1066 1087-0156 Google Scholar
T. Ohashi,
S. D. Galiacy,
G. Briscoe, and
H. P. Erickson,
“An experimental study of GFP-based FRET, with application to intrinsically unstructured proteins,”
Protein Sci., 16
(7), 1429
–1438
(2007). 0961-8368 Google Scholar
J. L. Vinkenborg,
T. H. Evers,
S. W. Reulen,
E. W. Meijer, and
M. Merkx,
“Enhanced sensitivity of FRET-based protease sensors by redesign of the GFP dimerization interface,”
ChemBioChem, 8
(10), 1119
–1121
(2007). 1439-4227 Google Scholar
|
||||||||||||||||||||||||||||||||||||||||||||||||||||||||||||||||||||||||||||||||||||||||||||


