
|
|
1.IntroductionThe dynamic properties of a protein have a crucial role in determining what function a protein serves within the cell and how, when, and where it may physically interact with other proteins and macromolecules in response to extracellular stimuli. Glycosylphosphatidylinositol (GPI)–anchored proteins are particular membrane proteins linked to the membrane by a GPI tail. The oligomerization of GPI-anchored proteins is thought to regulate their association with membrane domains known as lipid rafts, their subcellular sorting, as well as their biological function.1, 2 However, the regulation of the oligomerization of GPI-anchored proteins and their molecular dynamics and confinement in microdomains has not been comprehensively explored in well-characterized model systems. These systems should imply the use of living cells in unperturbed conditions and in the absence of any artificial clustering agents such as chemical cross-linkers or antibodies3; they should exploit fluorescently tagged chimeras, which fully retain the biological activity of the wild-type proteins, and respond to physiological relevant macromolecular interactions. We have chosen to develop a model having the preceding characteristics for studying the urokinase plasminogen activator receptor (uPAR), because this protein mediates a wide range of cellular events that regulate physiological and pathological processes, including cell adhesion and migration as well as angiogenesis, tumor invasion, metastasis, and proliferation (reviewed in Ref. 4). The commonly accepted notion (reviewed in Refs. 4, 5, 6) is that uPAR transduces signals through direct lateral physical interactions in multimolecular complexes involving membrane-spanning proteins and extracellular surface proteins. None of the interactions reported to mediate uPAR signaling have ever been visualized and confirmed in living cells, at steady state, and more importantly, in the absence of any cross-linker or antibody clustering agent. In principle, direct physical interactions could affect the molecular properties of uPAR in the cell membrane and could be explored by quantitative studies in living cells. Quantitative studies of membrane proteins as ensemble populations can be performed using techniques such as fluorescence-correlation spectroscopy (FCS), image-correlation spectroscopy (ICS), or fluorescence recovery after photobleaching (FRAP). Alternatively, single-particle tracking (SPT) can resolve the trajectories of individual molecules and multimolecular complexes in the plane of the membrane.7 Each of these techniques (reviewed in Refs. 7, 8, 9, 10, 11) provide significant information on the mobility, nature of diffusion, local concentration, and aggregation of proteins. The main advantage of single-molecule versus averaging techniques is that individual heterogeneities in the system can be evaluated, but with some concern, as the large probes used for tracking may slow down the motion and their multivalence can induce artificial clustering and underestimation of the diffusion coefficient.12 FRAP has been used successfully in many studies of membrane dynamics.13 Nevertheless, the bleached area can be refilled with fluorophores diffusing from any subcellular pool, from very distant pools, as well as from adjacent ones. As a consequence, various processes, such as membrane flow, molecular interactions, and trafficking, may simultaneously contribute to the overall recovery kinetics, which make data difficult to interpret. ICS and FRAP give equal information (mobile fraction, flow speed, and diffusion coefficients), but ICS needs lower laser power and shorter imaging time.14 However, neither FRAP nor ICS give information on the aggregation state of the diffusing particles (i.e., monomers versus dimers/oligomers). Alternatively, fluorescence correlation spectroscopy (FCS) analyzes the fluctuation of the fluorescence intensity of a system at equilibrium.15 The most stringent requirement for this approach to work is the possibility to observe the fluorescence signal at very high sensitivity and dynamic range, and in a small volume, as that obtained in confocal microscopy or defined by a two-photon excitation, less than [Fig. 1a ]. Only if the volume is so small can it contain just one or few molecules at any instant of time. FCS allows the analysis of the time structure of the fluctuations in the fluorescence intensity (autocorrelation function, or ACF), which is produced when a small number of molecules diffuse into and out of the tiny illuminated volume [Fig. 1a]. The two most important parameters determined by the autocorrelation function of the fluorescence fluctuations are the diffusion coefficient and the value, which is inversely related to the average number of molecules within the excitation volume. Latest technological advances have revived FCS as a useful technique for measuring translational mobility in the cytoplasm and nucleus as well as in cellular membranes (reviewed in Refs. 16, 17, 18, 19, 20). Fig. 1uPAR-G and D2D3-G in HEK293 cells. FCS and PCH (a): Cells expressing mEGFP-tagged uPAR (uPAR-G) or D2D3 (D2D3-G) were first imaged (left), and then the laser beam was positioned in a region of the cell membrane to collect the fluctuations in intensity (right) within the two-photon excited volume (middle). Two-photon fluorescence intensity images of living HEK293/uPAR-G (b) and HEK293/D2D3-G (c) cells used for FCS and PCH analysis. Typical regions chosen for measurement are marked with plus signs . Regions in filopodia, ruffles, or vesicles excluded from analysis are marked with open circles . Examples of regions that bleached under the beam are shown in open rectangles . Kcps=kilo counts per second.  However, changes in molecular mass due to protein oligomerization are difficult to detect by FCS, because the diffusion time scales with the cubic root of the mass. Furthermore, in living cells, differences in diffusion coefficient due to differences in mass are even more difficult to assign.21 A more useful approach is to separate species by their inherent fluorescence intensity. The intensity distribution [amplitude, Fig. 1a] of the fluctuating signal can be captured by the photon counting histogram (PCH) analysis.22, 23 For each fluorescent species, the distribution of photon counts is uniquely described by two parameters: the molecular brightness of the particle and the average number of particles within the observation volume.23 Molecular brightness is a useful marker for monitoring protein association. If a fluorescently labeled protein diffuses through the observation volume, it will produce a burst of detected photons. The average photon count rate of these bursts determines the molecular brightness of the labeled protein. If such a protein associates in a homodimer, the complex will carry two fluorescent labels, and its diffusion through the observation volume will produce, on average, twice as many photons than in the case for the monomer.24 Chen and colleagues demonstrated that molecular brightness measurements in living cells are feasible.25 In principle, the combined analysis of the time (FCS) and amplitude (PCH) structure of the fluctuations in intensity [Figure 1a] can determine the local average number of molecules, their diffusion coefficient, and their oligomerization state. However, in the case of membrane proteins, the slow diffusion of the molecules, the positioning of the laser focus on the membrane, and the inhomogeneous distribution of fluorophores in the excitation volume introduce relevant uncertainties in the measurements. We have generated an HEK293 cell line expressing a chimera of monomeric green fluorescent protein (mEGFP),26 tagged uPAR (termed uPAR-G), that fully retained the biological activity of the wild-type receptor (wt-uPAR). As a comparison, we have also produced HEK293 cells expressing the truncated form of uPAR, D2D3-mEGFP-GPI (termed D2D3-G), which is devoid of biological activity.27, 28 Both cell lines were extensively subcloned to select two populations with homogeneous and low uPAR-G and D2D3-G expression. To analyze the dynamics and oligomerization of both proteins, we applied FCS and PCH analyses, rigorously combined in order to minimize the effect of out-of-focus data segments in the fluorescence intensity records and the overestimation of the molecular brightness. The procedure that is described here in detail has been recently applied also for following the effect of the uPA-PAI-1 complex (a catalytically inactive protease/serpin complex, which is an extracellular physiological inhibitor of uPAR).29 FCS and PCH combined analyses showed that the binding of the inhibitor results in slower diffusion and disassembly of uPAR-G dimers. These results were in full agreement with those obtained in Forster resonance energy transfer (FRET) experiments on HEK293 cells co-expressing uPAR-G and uPAR-mRFP1-GPI as the acceptor, demonstrating that uPA-PAI-1 binding induces total loss of FRET between the green and red chimeras of uPAR.29 In this work, we show that, overall, the mobile fractions of the uPAR-G and D2D3-G have comparable diffusion coefficients and are constituted by monomers and dimers. However, the diffusion coefficient decreases in monomer-enriched fractions only for the active receptor, supporting the notion that uPAR monomers might be preferentially engaged in multiprotein transmembrane signaling complexes. The FCS/PCH joint approach, combined with a careful design of the cellular model, yields a reliable estimate of the diffusion coefficient and oligomerization state of GPI-anchored proteins. Our study underscores the importance of using well-characterized cell model systems for exploring the physiologically relevant mechanisms in which multifunctional GPI-anchored proteins, such as uPAR, are involved. 2.Materials and Methods2.1.Constructs and Cell CultureExpression vectors encoding EGFP-tagged uPAR or D2D3 were constructed using conventional cloning procedures by inserting the fluorescent protein regions between the third domain of uPAR (D3) and the GPI-anchoring signal. To avoid possible artifacts caused by intrinsic dimerization of the EGFP-moiety, the monomeric A206K variant was used.26 The expression vectors, based on the pEGFP-N1 (Clontech, Mountain View, California) backbone, were transfected into HEK293, and stable clones were isolated by G418 selection and limited dilution. In the isolated clones, the expression levels were evaluated by flow cytometry, and the number of receptors by binding assays using -labeled pro-uPA. The uPAR-G clone used in the FCS/PCH experiments expressed receptors/cell. A clone of D2D3-G cells with a comparable expression level was selected by flow cytometry. Cells were cultured at and 5% in high glucose DMEM, 10% fetal bovine serum, glutamine , penicillin and streptomycin . Cells plated in glass bottom WillCo wells (WillCo Well BV, Amsterdam, Netherlands) were used at subconfluence. All experiments were performed at and in serum-rich buffered medium. 2.2.Instrumentation and Data AnalysisWe used a dual-channel confocal fluorescence correlation spectrometer (ALBA by ISS, Inc., Champaign, Illinois). ALBA was equipped with avalanche photodiodes and interfaced to a Nikon TE300 inverted microscope. The objective was a Plan Apo (1.2 NA, water immersion). A BG39 optical filter (Chroma Technology, Rockingham, Vermont) was placed before the ALBA unit. A mode-locked titanium-sapphire laser (Tsunami, Spectra-Physics, Mountain View, California) provided two-photon excitation at . Every day, the power of the light after the objective in the absence of any immersion liquid was adjusted at . An , , computer-controlled piezoelectric actuator with a step resolution of less than warranted the nanometric positioning. An ISS, Inc., acquisition card received the data stream from the detectors. Data were stored for further processing by VISTA (ISS, Inc.) and simFCS (Laboratory for Fluorescence Dynamics, UCI, Irvine, California). Acquisition was in the time mode, and the sampling frequency was . The waist of the excitation beam was calibrated each day before experiments by measuring the autocorrelation function (ACF) of fluorescein/ , using a diffusion coefficient21 of . Typical values were 0.35 to ; thus, the effective volume as obtained from the Gaussian-Lorentzian fit21 was . ACFs were best-fitted by the anomalous diffusion model30: Photon counting histograms were analyzed according to Chen, 23 assuming a Gaussian-Lorentzian excitation volume. Local PCH analysis for deriving local brightness and local number of molecules was performed as described in Sec. 3. 3.Results3.1.Generation of the First Functional Fluorescent Model for uPARFluorescence imaging and micro-spectroscopy in live cells is mainly based on the use of fluorescent protein-tagged chimeras either transiently or stably expressed in cells. The main assumption is that the insertion of a fluorescent protein in the sequence of the target protein does not alter the correct folding, sorting, and biological activity of the protein under study. This assumption arises from the fact that fluorescent proteins are relatively small and compact beta-barrel proteins of , which may form an additional independent domain in the chimeric sequence. The correct intracellular translocation of the chimeric protein is a generally accepted condition for assuming retention of function. However, this condition might not be sufficient in the case of receptors with complex functions such as uPAR. The biological activity of uPAR depends on the correct folding and exposure of its three ecto-domains, termed D1, D2, and D3 [Fig. 1b, scheme on the right]. The peculiar folding, only recently described,31 of the three domains endows uPAR with several biological functions. uPAR binds the physiological ligand pro-uPA, which is converted to active uPA, promoting pericellular plasminogen activity as well as the cleavage of uPAR itself at the D1 domain. The resulting GPI-anchored truncated form of the receptor, D2D3, is biologically inactive.27, 28 In addition, uPAR functions also depend on the interactions with the extracellular matrix protein, vitronectin (Vn),28 and are modulated by the internalization and recycling induced by uPA-PAI-1.32, 33 Last, the receptor is partly recovered in the detergent resistant membrane fractions (DRM) similarly to other GPI-anchored proteins,34 and also cleaved from the GPI-anchor.35 These functions are reproduced by our functional EGFP-tagged uPAR.29 In fact, we constructed the EGFP-tagged uPAR by inserting the sequence encoding EGFP between the third domain of uPAR and the GPI-anchoring sequence [Fig. 1b, scheme on the right], at a position where we had previously epitope-tagged uPAR without disrupting receptor function.34 We also took into account the well-known intrinsic property of fluorescent proteins to dimerize that might introduce significant biases in dynamic studies of membrane proteins and, particularly, of GPI-anchored proteins.36, 37 For GPI-anchored proteins, the monomer-dimer/oligomer dynamics might constitute a regulatory mechanism of their biological activity, diffusion properties (i.e., segregation in membrane micro-domains), and localization at the cell surface. The monomer-dimer dynamics are particularly relevant for uPAR. It was shown that dimerization regulates the biological activity of this receptor by determining differential ligand binding and lipid raft partitioning, since DRM fractions were enriched in uPAR dimers and coincided with higher Vn-binding activity.34 We minimized the tendency of EGFP to dimerize by introducing the A206K point mutation that does not significantly alter the spectral properties of the fluorophore.26 uPAR-G was expressed in HEK293, because these cells do not produce wt-uPAR and do not secrete pro-uPA. The expression of wt-uPAR in HEK293 induces changes in cell morphology, migration, and signaling, as documented in our previous work.38 These changes were well reproduced by uPAR-G, confirming retention of activity.29 In HEK293/uPAR-G cells, the receptor localized heterogeneously at the cell surface and in intracellular vesicles, staining intense patches at the basal membrane, lamellipodia, and filopodia [compare Fig. 1b left and right panels, and Ref. 29]. We have also produced a biologically inactive model by expressing in the same HEK293 cell line the truncated form of uPAR, D2D3, which is also generated in vivo. After binding uPAR, uPA cleaves the receptor at the D1 domain, leaving the truncated form D2D3-GPI in the membrane. The fluorescent chimera of the truncated receptor, D2D3-G, cannot bind uPA, uPA-PAI-1, or Vn, and it does not promote pericellular plasminogen activity, but it is correctly sorted at the plasma membrane [Figure 1c] and partitions in DRM fractions similarly to the active uPAR-G (data not shown). D2D3-G stained the cell surface more homogenously than uPAR-G; it was not recruited at the basal side and did not form clusters [Fig. 1c, left panel], but it was present in filopodia and in membrane ruffles [Fig. 1c, right panel]. Having established the correct functionality of uPAR-G in HEK293 cells and generated a second cell line with a similar GPI-anchored protein, the D2D3-G, lacking uPAR activity, we have undertaken extensive subcloning of the cell lines, with the aim of selecting clones with low and similar expression uPAR-G or D2D3-G, suitable for two-photon fluorescence correlation spectroscopy (FCS) and photon counting histogram (PCH) analyses. It has been demonstrated that a local concentration not higher than 10 molecules/volume is ideal for avoiding instrumental noise that overtakes the fluorescence fluctuations in the sample.21 Unfortunately, the induced expression of proteins in cells by conventional methods cannot be well controlled, and the expression levels of the exogenous protein vary significantly in a transfected cellular pool. When using a heterogeneous transfected pool, on the one hand, quite a lot of time must be spent to search cells with “optimal” counts, and as a consequence, the effort of acquiring a statistically significant number of measurements is almost prohibitive. On the other hand, variable levels of the protein can introduce biological drawbacks. As in the case of uPAR, the cellular phenotype can change, or the protein aggregates or it can be missorted in intracellular compartments, precluding any biological significance of the measurements. Thus, we used flow cytometry (data not shown) for evaluating the expression levels of uPAR-G and D2D3-G in each subclone and for selecting two subclones with low and comparable expression. The HEK293/uPAR-G clone used in the FCS and PCH experiments expressed receptors/cell as determined by binding assays using -labeled pro-uPA.29 3.2.Autocorrelation Functions and Molecular BrightnessTo acquire fluorescence intensity traces, cells were first imaged, and then the fluorescence intensity was recorded after positioning the beam in specific regions on the in-focus plane. Representative regions are shown in Figs. 1b and 1c , and representative records are reported in Figs. 2 and 3 . We avoided collecting data in regions with punctuate structures such those visible in Figs. 1b and 1c (apical panels, ). These structures were often either vesicles or forming protrusions of the membrane (ruffles), in which the intensity was too high for FCS/PCH analysis (i.e., number of molecules ). Interestingly, apical ruffles were significantly stained by D2D3-G, because this inactive form of uPAR was not engaged in the cell adhesion mechanism, and was not recruited at the basal side by the interaction with Vn [compare left and right panels in Figs. 1b and 1c]. We neglected regions in swinging filopodia [Figs. 1b and 1c, basal panels, ] and limited our experiments to more regular regions in the membranes. Fig. 2Combined FCS and PCH analysis of uPAR-G. Representative examples of fluorescence intensity records acquired in the apical membrane of three different cells (left panels), ACFs (middle panels), and photon counting histograms (right panels), showing a stationary record (a), a record in which large increases of intensity were observed (b), and a record in which a deep intensity drift occurred during the measurement (c). The black ACFs curves and histograms refer to the entire record. The record segments colored in blue and red (segments 1 and 2) were analyzed separately. The result of each analysis is reported in Table 1. (Color online only.)  Fig. 3Combined FCS and PCH analysis of D2D3-G. Representative examples of fluorescence intensity traces acquired in the apical membrane of three different cells (left panels), ACFs (middle panels), and photon counting histograms (right panels), showing a stationary record (a), a record in which large increases of intensity were observed (b), and a record in which a deep intensity drift occurred during the measurement (c). The black ACFs curves and histograms refer to the entire record. The record segments colored in blue and red (segments 1 and 2) were analyzed separately. The result of each analysis is reported in Table 1. (Color online only.)  Furthermore, in HEK293/uPAR-G cells, we evaluated the brightness of the receptor only in apical membranes. As we have recently shown,29 due to the direct interaction of uPAR-G with Vn, not only is the receptor recruited in intense clusters at the basal side of the cell [Fig. 1b, basal panel, ], but also a fraction of it is immobile. Immobilization would reduce the molecular brightness values either by contributing a nonfluctuating fluorescent species or by bleaching the oligomers. Both processes would reduce the recovered brightness. We have indeed observed photobleaching in the basal regions of these cells29 (that was never observed in HEK293/D2D3-G), and therefore we have not attempted to derive any conclusion about brightness from post-bleaching segments. In each chosen region, we prolonged the acquisition of the fluorescence intensity for 200 to , at , since membrane proteins39, 40 diffuse in the range of . Cells were analyzed at subconfluence, and in the best physiological conditions (i.e., in serum-rich medium). Under these conditions, cell movements as well as intracellular sorting of vesicles to the cell membrane were not abolished. Despite that, some intensity records were stable, and the average intensity was constant for 200 to [Fig. 2a, left panel]. In these cases, the ACF could be obtained using the entire data record, data points [Fig. 2a, middle panel, black curve]. We also aimed at obtaining information on the aggregation state of the diffusing proteins. This information is important, since previous studies have shown that uPAR is present at the cell surface as monomers and dimers and suggested that dimerization might regulate the biological activity of the receptor by determining differential ligand binding and partition in membrane microdomains.34 In principle, FCS analysis can resolve a mixture of fluorescent species by differences in their diffusion coefficient. Yet FCS lacks sensitivity when the molecular weight of two species differs by less than a factor of 5 to 8 (Ref. 41). Even in solution, the autocorrelation approach cannot separate a mixture of uPAR dimers and monomers. Alternatively, the analysis of the brightness can provide information on the oligomerization state of the diffusing receptors.24 The brightness of any fluorophore (i.e., the number of photons emitted per second per fluorophore at a given level of excitation) is an intrinsic molecular property of a molecule. The total brightness of a group of codiffusing fluorophores is the sum of the individual molecular brightness, in the absence of any electronic interactions among the fluorophores. Thus, brightness can be used to quantify the number of protein molecules moving together. The PCH can extract the molecular brightness from fluorescence fluctuation experiments by determining experimentally the probability distribution of the photon counts.23 This method has been shown to be also a very powerful tool for the analysis of the brightness of molecules in the cellular environment.25, 42, 43 Figure 2 (right panels) illustrates the PCHs for three representative analyses of apical membrane regions in HEK293/uPAR-G cells. The average brightness values (in a Gaussian-Lorentzian excitation volume) obtained from the histograms are reported in Table 1 . Chen and colleagues25 demonstrated that integral PCH analysis (i.e., the analysis of the whole record) overestimates the molecular brightness due to drifts of intensity and showed how a segmentation procedure of the original data set (termed local PCH analysis) can provide the correct average brightness. By this procedure, the data record of an experiment is broken into small data sets, and the analysis is performed on each data segment to extract the particle concentration, , and the molecular brightness, . In the last step, the average of each parameter over all segments is determined to get the final parameters, and . The procedure was shown to work well for experiments25 lasting typically few tens of seconds and for data segments of 1 to . We have applied the same procedure on much longer records (200 to ), segmented the data in intervals of , and derived the average number of molecules, and (Table1). Overall, local PCH estimated lower values of molecular brightness, but when records were stationary, such as that in Fig. 2a, integral and local PCH were in good agreement. Nevertheless, due to the length of the experiments, stationary records were not as frequent as those showing large fluctuations [Fig. 2b] or intensity drifts [Fig. 2c]. This was not surprising, since cell movements and recycling of the receptor in vesicles, occurring in the time range of seconds, can corrupt the data. Thus, we inspected each record for determining which data segment could be considered for deriving diffusion coefficients and average molecular brightness. Table 1Representative analysis of molecular brightness of uPAR-G and D2D3-G.
1Average molecular brightness and average number of molecules estimated by integral PCH analysis of the unbroken record. 2Average local molecular brightness and average local number of molecules estimated by local PCH analysis of the unbroken record. 3Avergae molecular brightness and average number of molecules estimated by integral PCH analysis of the stationary segment. The example in Fig. 2b illustrates an irregular record with sharp increases of intensity lasting 25 to [Fig. 2b, left panel, segment 2], and a stable segment [Fig. 2b, left panel, segment 1]. The ACF of the entire record [Fig. 2b, middle panel, black curve] was not acceptable for FCS analysis. This was mainly due to the contribution of the unsteady data segment [Fig. 2b, middle panel, red curve]. As a consequence, the average molecular brightness values obtained from integral and local PCH analyses were in disagreement (Table 1). The instability of the signal in subsets like segment 2, in fact, leads to artificially high estimates of the brightness [Table 1 and Fig. 2b, right panel, red curve]. Since in the same segment, ACF was far from equilibrium [Fig. 2b middle panel, red curve], we discarded both the integral and the local PCH analysis of the entire data set. Using only the data subset 1, the ACF reached equilibrium [Fig. 2b, middle panel, blue curve], and the integral and local PCH gave the same average molecular brightness (Table 1). Thus, in similar cases, we always limited our analysis to the most stationary data segment of the record. We also observed intensity drifts likely due to out-of-focus effects [Fig. 2c, left panel]. The ACF over the entire record was not satisfactory [Fig. 2c, middle panel, black curve], and integral and local PCH analyses gave different estimates of the average brightness [Fig. 2c, right panel, black and blue histograms, and Table 1]. The brightness derived by the integral analysis was always higher than that obtained by local PCH (which had an uncertainty as high as 40%). Limiting both local and integral PCH analyses to the more stationary segment [segment 1 in Fig. 2c, left panel], we obtained again comparable values of the average molecular brightness (with less than 20% standard deviation). In similar cases, the out-of-focus segment contributed an apparent brightness significantly lower than that obtained in the best in-focus condition [Table 1 and Fig. 2c, right panel, red curve]. We performed the same analysis on HEK293/D2D3-G cells (Fig. 3 and Table 1). These cells adhered equally well to the dish when cultured in serum-rich medium. However, due to the lack of interaction with Vn, D2D3-G stained the cell membrane homogenously and did not accumulate in the basal side [Fig. 1c]. We used these cells as a control for the in-focus and out-of-focus effects on the molecular brightness. The laser beam was positioned on the central regions of the basal membrane and took in-focus [Fig. 4a , left and middle panel] and out-of-focus records [Fig. 4b, left and middle panels]. Also in these experiments, we selected the stationary segments of the data records for the integral and local PCH analyses. The out-of-focus brightness estimated by both analyses was remarkably lower than that derived in the best in-focus condition (Table 1 and Fig. 4). Therefore, we inspected each record and extracted the longer and stationary segment that fulfilled the necessary equilibrium conditions for ACF, in which, at the same time, was minimized and was less or equal to 5. Fig. 4In-focus and out-of-focus measurements on D2D3-G. The basal membrane of a D2D3-G cell was imaged in focus (a), and a region was chosen for acquiring a measurement [(a), middle panel]. The acquisition was repeated after moving the position of out of focus [(b), left and middle panels]. Photon count histograms [PCH A and PCH B, right panels] were computed using stationary in-focus and out-of-focus segments. The result of each analysis is reported in Table 1.  In D2D3-G cells, with the exception of filopodia and ruffles, we could explore all membrane regions having a homogenous staining. The values derived from these experiments are reported in Fig. 5 . The membrane thickness can be rather different among the basal and the apical membranes and the membrane junctions. Nevertheless, the distribution of in HEK293/D2D3-G cells did not reveal any significant dependence on the membrane region. Fig. 5Brightness of D2D3-G in different membrane regions. Average local brightness of D2D3-G in apical and basal regions of the cell membrane and in cell junctions. Number of measurements: apical=14; middle=9; basal=9. Measurements per cell=3 to 4.  In uPAR-G cells, confining our study to the apical membranes, we have shown that the complex uPA-PAI-1, a physiological inhibitor of uPAR, clearly modifies the brightness distribution.29 The brightness distribution in the presence of the inhibitor [Fig. 6a ] was associated with that of monomeric uPAR-G also because FRET was abolished in HEK293 cells co-transfected with uPAR-G and the FRET acceptor uPAR-mRFP1-GPI.29 Conversely, observed in the absence of the inhibitor in uPAR-G cells and in steady-state conditions was as high as twofold that of monomeric uPAR-G [Fig. 6b and Ref. 29]. A similar average brightness distribution was observed for the inactive form D2D3-G [Fig. 6c]. Fig. 6Average molecular brightness of uPAR-G and D2D3-G in unperturbed cells. (a) Distribution of local brightness of monomeric uPAR-G in apical membranes of HEK293 cells, in the presence of the inhibitor uPA-PAI-1. Inset: means , and minimum and maximum values for each measurement. Incubation with uPA-PAI-1 was performed for , at in DMEM, 0.1% BSA, HEPES buffer. Records were inspected as described in the text, and stationary segments were submitted to local PCH analysis using intervals (or intervals, not shown). was less or equal to 5 in each measurement. Number or measurements=32, with 3 to 4 measurements per cell. (b) Average local brightness ratio for uPAR-G in unperturbed HEK293 cells. The ratio was computed between the values measured in the absence of uPA-PAI-1 and , which is the mean of 32 experiments in the presence of the inhibitor (a). The gray area was obtained considering the uncertainty on the distribution observed in the presence of the inhibitor: 25% percentile= , and 75% percentile= . Number of measurements=43, with 3 to 4 measurements per cell. (c) Average local brightness ratio for D2D3-G in unperturbed HEK293 cells computed as in (b), using the average brightness of uPAR-G in the presence of the inhibitor. The gray area was obtained as in (b). Number of measurements=32, with 3 to 4 measurements per cell. 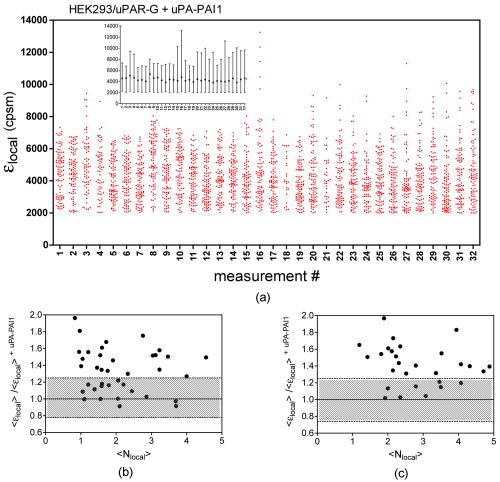 The data indicate that both uPAR-G and D2D3-G undergo homotypic interactions leading to mixtures of diffusing monomers and dimers at the cell membrane. The two receptors clearly differ for the interaction with the extracellular matrix proteins, since the inactive D2D3-G does not accumulate in the basal membrane and is not irreversibly photobleached. It is also evident, however, that PCH analysis is not useful for studying the molecular forms of uPAR-G engaged in the interaction with Vn in basal membranes. This interesting point requires further investigation, which, however, is beyond the aim of this work. 3.3.Diffusional Analysis of uPAR-G and D2D3-G at the Surface of Unperturbed HEK293 CellsUsing the preceding procedure for selecting suitable data segments, we analyzed in parallel the autocorrelation functions to determine the diffusion coefficients uPAR-G and D2D3-G in the cell membrane. The diffusion of both proteins was well represented only by the anomalous diffusion model [Sec. 2, Eq. 1 and Refs. 30, 44, 45], as shown by the representative fittings in Figs. 7a and 7b . Recently, we have discussed the diffusion models that best fit the ACFs of uPAR-G in the membrane of HEK293 cells and showed that the diffusion of the receptor could not be described by single- or two-component Brownian diffusion.29 Diffusion [Fig. 7c] and anomality coefficients alpha [Fig. 7c, inset] from replicate experiments describe comparable behaviors of uPAR-G and D2D3-G. Fig. 7Diffusion and anomality coefficients of uPAR-G and D2D3-G in unperturbed cells. Representative ACFs for uPAR-G (a) and D2D3-G (b) acquired in apical membranes. ACFs: black lines; fitted curves: red lines; residuals: blue lines. (c) Distribution of diffusion and alpha (inset) coefficients. Box-whisker plots show minimum, 25th percentile, median, 75th percentile, and maximum values. Number of measurements: uPAR-G=43; D2D3-G=32. (Color online only.)  Overall, the data suggest that the inactive and the active forms of the receptor have comparable features in the cell membrane: similar anomalous diffusion and diffusion coefficients, and similar distribution of monomeric and dimeric forms of the mobile fractions. Thus, neither the dimerization nor the diffusion anomality of uPAR-G can be simply related to the active form of the receptor in the cell membrane (with the exception of the basal membrane discussed earlier), in steady-state conditions and in the absence of extracellular ligands. However, by combining FCS and PCH analyses on the same data segments, we could notice that only the diffusion coefficient of uPAR-G depends on the brightness (Fig. 8 ). The observed dependence is counter intuitive, since slow diffusion was associated with low brightness [Fig. 8a]. On the other hand, the diffusion coefficients of the inactive receptor did not depend on [Fig. 8b]. The difference in the slopes of the two correlations [shown superimposed in Fig. 8c] was statistically significant and could not be ascribed to differences in the anomality coefficients [Figs. 8d and 8e]; the alpha coefficients for both proteins were, in fact, brightness-independent [Fig. 8f]. Fig. 8Dependence of diffusion coefficients on brightness for uPAR-G and D2D3-G in unperturbed cells. Diffusion coefficients of uPAR-G (a) and D2D3-G (b) versus average molecular brightness. Continuous lines: best-fitted linear correlation; inset: residuals. Correlation statistics for uPAR-G: (deviation of the slope from zero is significant); . Correlation statistics for D2D3-G: (deviation of the slope from zero is not significant); . The two best-fitted lines are superimposed in (c), and the 95% confidence band of each regression line is shown: uPAR-G—continuous line and ; D2D3-G—bold dashed line and (- - -). Alpha coefficients of uPAR-G (d) and D2D3-G (e) versus average molecular brightness. Continuous lines: best-fitted linear correlation; inset: residuals. Correlation statistics for uPAR-G: (deviation of the slope from zero is not significant); . Correlation statistics for D2D3-G: (deviation of the slope from zero is not significant); . The two best-fitted lines are superimposed in (f), and the 95% confidence band of each regression line is shown: uPAR-G—continuous line and ; D2D3-G—bold dashed line and (- - -).  Collectively, the data demonstrate that the active and inactive forms of uPAR are present as mixtures of monomers and dimers at the plasma membrane of live and unperturbed cells. Both GPI-anchored proteins diffuse anomalously; however, only the active form of uPAR shows fractions enriched in monomers that diffuse more slowly. 4.DiscussionIn this work, we have studied the dynamics and oligomerization of a GPI-anchored receptor, uPAR, using an EGFP-tagged chimera that retained the multiple biological functions of the wild-type receptor. We thought that it was important to focus on well-characterized cellular systems of known biological relevance. For this reason, we constructed the uPAR-G chimera taking into consideration the issue of the intrinsic dimerization of the EGFP tag, as well as its position in the uPAR sequence,34 and generated a stably transfected HEK293/uPAR-G cell line. The choice of the HEK293 cells was not casual. These cells do not express wt-uPAR and do not secrete uPA and PAI-1, which modulate the activity of the receptor in vivo. Moreover, the expression of wt-uPAR induces phenotypic changes in these cells that are also observed in pathological conditions.38 In addition, we produced a physiologically relevant control, by expressing the mEGFP-tagged D2D3 form of wt-uPAR in the same cell line. The D2D3 form of the receptor is generated in vivo by uPA-mediated cleavage at the D1 domain and lacks the biological activity of the wild-type receptor. Last, to reduce the variability of the local concentration of the proteins at the cell surface, we extensively subcloned the transfected pools, quantified expression levels by flow cytometry, and selected clones with similar uPAR-G and D2D3-G levels. We used these two clones for comparing membrane dynamics and oligomerization of the active and inactive forms of the same GPI-anchored receptor, at steady state and in unperturbed conditions. Among the various possible approaches, we applied FCS and PCH analyses, with the aim of determining in parallel the heterogeneity of diffusion and oligomerization of the two proteins. However, using these techniques, several considerations were required. It was critical to correctly position the laser focus on the membrane and analyze long records. Long data records were necessary because membrane receptors diffuse in the range of 0.1 to . Thus, during each measurement, cell movements could not be abolished. We took the precaution of taking an image of the cell in the chosen plane, refining the focus on a selected region with a fast z-scan, acquiring the record and, immediately after acquisition, taking a second image of the membrane region. This procedure helped significantly in data analysis, since we could annotate each measurement with pre- and post-images and z-scans. The procedure worked well also because, using two-photon excitation at and low power , we could avoid photobleaching. Photobleaching occurred only in HEK293/uPAR-G cells, and only in basal membranes where the active receptor was engaged in interactions with Vn, as previously described.29 Therefore, we did not perform any parallel analysis of brightness and diffusion in the basal membranes of these cells. In addition, in both uPAR-G and D2D3-G clones, we avoided collecting data in regions with membrane ruffles, swinging filopodia, and high local concentration of the proteins (i.e., number of molecules ). Despite the cautions taken in choosing suitable membrane regions and acquiring measurements, we needed to inspect each record carefully and compare ACFs and PCHs along each data record. We systematically evaluated the local PCHs and accepted only data segments in which the average local brightness was minimized and the average local number of molecules did not exceed 5. Simultaneously, we also analyzed the ACF of the same data segment. Last, to modify the balance between monomeric and oligomeric uPAR-G at the cell membrane, we used a well-known inhibitor of uPAR, the protein complex uPA-PAI-1, and obtained a reproducible evaluation of for monomeric uPAR-G in the cell membrane.29 Applying stringent experimental and analytical conditions, we found that both the active and inactive forms of uPAR are present in monomers and dimers at the plasma membrane of live and unperturbed cells cultured in serum-rich medium, confirming previous observations.34 Nevertheless, since a relevant fraction of uPAR is recruited in the binding with Vn and immobilized at the basal membranes, we cannot rule out the presence of oligomers in basal regions, either induced or stabilized by Vn-mediated interactions. The existence of dimeric D2D3-G at the cell surface seems to support the hypothesis that GPI-anchored proteins can be at least partly sorted as dimers or assembled in the membrane by mechanisms that do not involve ecto-domain heterotypic interactions. In any case, our results suggest that uPAR dimerization might not be strictly dependent on its “functional” state. We did not attempt to quantify the relative abundance of monomeric and dimeric forms, since single-point PCH still gives a partial view of the entire molecular distribution in the membrane. However, recent results from FRET–fluorescence lifetime imaging (FLIM) experiments suggest that uPAR-G monomers predominate in apical membranes.29 Active and inactive uPAR are similar also in terms of diffusion. Both proteins diffuse anomalously. Because of the complexity of the membrane morphology (membrane wrinkles) and cell movements, anomalous diffusion can arise as a pure geometrical effect even if the particle diffuses normally.46 The latter effect may account partly for the anomalous diffusion of uPAR-G and D2D3-G. Nevertheless, the diffusion coefficients that we have obtained for the two GPI-anchored proteins are in agreement with those estimated by FCS measurements on various spatial scales.40 Interestingly, our data also indicate that one difference exists between uPAR-G and D2D3-G, since only the diffusion coefficients of the active form are correlated with the average molecular brightness. The correlation that we have observed is counter intuitive, i.e., the fraction enriched in monomers diffuses more slowly than fractions enriched in dimers. The difference did not depend on the anomality coefficients, which were the same for both uPAR-G and D2D3-G. The evidence that uPAR-G monomers have smaller diffusion coefficients is the first observation in live cells supporting the notion that monomeric uPAR might be preferentially involved in interaction with other transmembrane receptors. A large body of evidence suggests that uPAR interacts with several membrane proteins, modulating their activity. uPAR-mediated cell signaling has been shown to involve integrins,28, 47 G-protein-coupled chemotactic receptors such as FPRL1/LXA4R and FRP,48, 49 and members of the low-density lipoprotein receptor-related protein family (LDLR).50, 51, 52 The so-called uPAR-interactome is the subject of recent reviews.5, 6 However, the entire interactome has been derived from co-immunoprecipitation and antibody clustering experiments and from co-immunofluorescence imaging. None of the direct physical interactions reported to mediate uPAR-signaling have ever been visualized and confirmed in living cells, at steady state, and more importantly, in the absence of any cross-linker or antibody clustering agent. Thus, our results lay the ground for a more systematic study of the physical interactions of uPAR in multiprotein complexes at real time and in living cells, using equally well-characterized fluorescent chimeras of the various uPAR-partners and significant cellular models, such as the one we have developed. Our results also underscore the importance of using GPI-proteins as active sensors, rather than as simple reporters, of cell membrane dynamics in well-designed and biologically relevant cellular models. AcknowledgmentsWe thank Theodore L. Hazlett and Jay R. Unruh for contributing to the discussion of our results. V.R.C. acknowledges the Italian Ministry of Education, University, and Research (Grant Firb Nos. , ). V.R.C. and N.S. are grateful to the Cariplo Foundation—Milan, Italy, for cofunding this project. ReferencesS. Mayor and
H. Riezman,
“Sorting GPI-anchored proteins,”
Nat. Rev. Mol. Cell Biol., 5
(2), 110
–120
(2004). 1471-0072 Google Scholar
K. Simons and
D. Toomre,
“Lipid rafts and signal transduction,”
Nat. Rev. Mol. Cell Biol., 1
(1), 31
–39
(2000). 1471-0072 Google Scholar
A. Kusumi and
K. Suzuki,
“Toward understanding the dynamics of membrane-raft-based molecular interactions,”
Biochim. Biophys. Acta, 1746
(3), 234
–251
(2005). 0006-3002 Google Scholar
F. Blasi and
P. Carmeliet,
“uPAR: a versatile signalling orchestrator,”
Nat. Rev. Mol. Cell Biol., 3
(12), 932
–943
(2002). 1471-0072 Google Scholar
B. R. Binder,
J. Mihaly, and
G. W. Prager,
“uPAR-uPA-PAI-1 interactions and signaling: a vascular biologist’s view,”
Thromb. Haemostasis, 97
(3), 336
–342
(2007). 0340-6245 Google Scholar
P. Ragno,
“The urokinase receptor: a ligand or a receptor? Story of a sociable molecule,”
Cell. Mol. Life Sci., 63
(9), 1028
–1037
(2006). 1420-682X Google Scholar
M. J. Saxton and
K. Jacobson,
“Single-particle tracking: applications to membrane dynamics,”
Annu. Rev. Biophys. Biomol. Struct., 26 373
–399
(1997). https://doi.org/10.1146/annurev.biophys.26.1.373 1056-8700 Google Scholar
K. Bacia,
S. A. Kim, and
P. Schwille,
“Fluorescence cross-correlation spectroscopy in living cells,”
Nat. Methods, 3
(2), 83
–89
(2006). 1548-7091 Google Scholar
I. R. Bates,
P. W. Wiseman, and
J. W. Hanrahan,
“Investigating membrane protein dynamics in living cells,”
Biochem. Cell Biol., 84
(6), 825
–831
(2006). 0829-8211 Google Scholar
V. Vukojevic,
A. Pramanik,
T. Yakovleva,
R. Rigler,
L. Terenius, and
G. Bakalkin,
“Study of molecular events in cells by fluorescence correlation spectroscopy,”
Cell. Mol. Life Sci., 62
(5), 535
–550
(2005). https://doi.org/10.1007/s00018-004-4305-7 1420-682X Google Scholar
A. J. Garcia-Saez and
P. Schwille,
“Single molecule techniques for the study of membrane proteins,”
Appl. Microbiol. Biotechnol., 76
(2), 257
–266
(2007). 0175-7598 Google Scholar
A. Kusumi,
C. Nakada,
K. Ritchie,
K. Murase,
K. Suzuki, H. Murakoshi, R. S. Kasai,
J. Kondo, and
T. Fujiwara,
“Paradigm shift of the plasma membrane concept from the two-dimensional continuum fluid to the partitioned fluid: high-speed single-molecule tracking of membrane molecules,”
Annu. Rev. Biophys. Biomol. Struct., 34 351
–378
(2005). https://doi.org/10.1146/annurev.biophys.34.040204.144637 1056-8700 Google Scholar
J. Lippincott-Schwartz,
E. Snapp, and
A. Kenworthy,
“Studying protein dynamics in living cells,”
Nat. Rev. Mol. Cell Biol., 2
(6), 444
–456
(2001). 1471-0072 Google Scholar
N. O. Petersen,
P. L. Hoddelius,
P. W. Wiseman,
O. Seger, and
K. E. Magnusson,
“Quantitation of membrane receptor distributions by image correlation spectroscopy: concept and application,”
Biophys. J., 65
(3), 1135
–1146
(1993). 0006-3495 Google Scholar
K. M. Berland,
P. T. So, and
E. Gratton,
“Two-photon fluorescence correlation spectroscopy: method and application to the intracellular environment,”
Biophys. J., 68
(2), 694
–701
(1995). 0006-3495 Google Scholar
N. L. Thompson,
A. M. Lieto, and
N. W. Allen,
“Recent advances in fluorescence correlation spectroscopy,”
Curr. Opin. Struct. Biol., 12
(5), 634
–641
(2002). https://doi.org/10.1016/S0959-440X(02)00368-8 0959-440X Google Scholar
S. T. Hess,
S. Huang,
A. A. Heikal, and
W. W. Webb,
“Biological and chemical applications of fluorescence correlation spectroscopy: a review,”
Biochemistry, 41
(3), 697
–705
(2002). https://doi.org/10.1021/bi0118512 0006-2960 Google Scholar
E. L. Elson,
“Quick tour of fluorescence correlation spectroscopy from its inception,”
J. Biomed. Opt., 9
(5), 857
–864
(2004). https://doi.org/10.1117/1.1779234 1083-3668 Google Scholar
M. K. Levin and
J. H. Carson,
“Fluorescence correlation spectroscopy and quantitative cell biology,”
Differentiation, 72
(1), 1
–10
(2004). 0301-4681 Google Scholar
D. Marguet,
P. F. Lenne,
H. Rigneault, and
H. T. He,
“Dynamics in the plasma membrane: how to combine fluidity and order,”
EMBO J., 25
(15), 3446
–3457
(2006). https://doi.org/10.1038/sj.emboj.7601204 0261-4189 Google Scholar
J. D. Muller,
Y. Chen, and
E. Gratton,
“Fluorescence correlation spectroscopy,”
Methods Enzymol., 361 69
–92
(2003). 0076-6879 Google Scholar
Y. Chen,
J. D. Muller,
K. M. Berland, and
E. Gratton,
“Fluorescence fluctuation spectroscopy,”
Methods, 19
(2), 234
–252
(1999). 1046-2023 Google Scholar
Y. Chen,
J. D. Muller,
P. T. So, and
E. Gratton,
“The photon counting histogram in fluorescence fluctuation spectroscopy,”
Biophys. J., 77
(1), 553
–567
(1999). 0006-3495 Google Scholar
J. D. Muller,
Y. Chen, and
E. Gratton,
“Resolving heterogeneity on the single molecular level with the photon-counting histogram,”
Biophys. J., 78
(1), 474
–486
(2000). 0006-3495 Google Scholar
Y. Chen,
J. D. Muller,
Q. Ruan, and
E. Gratton,
“Molecular brightness characterization of EGFP in vivo by fluorescence fluctuation spectroscopy,”
Biophys. J., 82
(1, Pt 1), 133
–144
(2002). 0006-3495 Google Scholar
D. A. Zacharias,
J. D. Violin,
A. C. Newton, and
R. Y. Tsien,
“Partitioning of lipid-modified monomeric GFPs into membrane microdomains of live cells,”
Science, 296
(5569), 913
–916
(2002). https://doi.org/10.1126/science.1068539 0036-8075 Google Scholar
N. Montuori,
M. V. Carriero,
S. Salzano,
G. Rossi, and
P. Ragno,
“The cleavage of the urokinase receptor regulates its multiple functions,”
J. Biol. Chem., 277
(49), 46932
–46939
(2002). 0021-9258 Google Scholar
N. Sidenius and
F. Blasi,
“Domain 1 of the urokinase receptor (uPAR) is required for uPAR-mediated cell binding to vitronectin,”
FEBS Lett., 470
(1), 40
–46
(2000). 0014-5793 Google Scholar
V. R. Caiolfa,
M. Zamai,
G. Malengo,
A. Andolfo,
C. D. Madsen,
J. Sutin,
M. A. Digman,
E. Gratton,
F. Blasi, and
N. Sidenius,
“Monomer dimer dynamics and distribution of GPI-anchored uPAR are determined by cell surface protein assemblies,”
J. Cell Biol., 179
(5), 1067
–1082
(2007). https://doi.org/10.1083/jcb.200702151 0021-9525 Google Scholar
D. S. Banks and
C. Fradin,
“Anomalous diffusion of proteins due to molecular crowding,”
Biophys. J., 89
(5), 2960
–2971
(2005). https://doi.org/10.1529/biophysj.104.051078 0006-3495 Google Scholar
P. Llinas,
M. H. Le Du,
H. Gardsvoll,
K. Dano,
M. Ploug,
B. Gilquin,
E. A. Stura, and
A. Menez,
“Crystal structure of the human urokinase plasminogen activator receptor bound to an antagonist peptide,”
EMBO J., 24
(9), 1655
–1663
(2005). 0261-4189 Google Scholar
M. Conese and
F. Blasi,
“Urokinase/urokinase receptor system: internalization/degradation of urokinase-serpin complexes: mechanism and regulation,”
Biol. Chem. Hoppe Seyler, 376
(3), 143
–155
(1995). 0177-3593 Google Scholar
A. Nykjaer,
M. Conese,
E. I. Christensen,
D. Olson,
O. Cremona,
J. Gliemann, and
F. Blasi,
“Recycling of the urokinase receptor upon internalization of the uPA:serpin complexes,”
EMBO J., 16
(10), 2610
–2620
(1997). 0261-4189 Google Scholar
O. Cunningham,
A. Andolfo,
M. L. Santovito,
L. Iuzzolino,
F. Blasi, and
N. Sidenius,
“Dimerization controls the lipid raft partitioning of uPAR/CD87 and regulates its biological functions,”
EMBO J., 22
(22), 5994
–6003
(2003). 0261-4189 Google Scholar
O. G. Wilhelm,
S. Wilhelm,
G. M. Escott,
V. Lutz,
V. Magdolen,
M. Schmitt,
D. B. Rifkin,
E. L. Wilson,
H. Graeff, and
G. Brunner,
“Cellular glycosylphosphatidylinositol-specific phospholipase D regulates urokinase receptor shedding and cell surface expression,”
J. Cell Physiol., 180
(2), 225
–235
(1999). 0021-9541 Google Scholar
R. Y. Tsien,
“The green fluorescent protein,”
Annu. Rev. Biochem., 67 509
–544
(1998). https://doi.org/10.1146/annurev.biochem.67.1.509 0066-4154 Google Scholar
R. K. Jain,
P. B. Joyce,
M. Molinete,
P. A. Halban, and
S. U. Gorr,
“Oligomerization of green fluorescent protein in the secretory pathway of endocrine cells,”
Biophys. J., 360
(Pt 3), 645
–649
(2001). 0006-3495 Google Scholar
C. D. Madsen,
G. M. Ferraris,
A. Andolfo,
O. Cunningham, and
N. Sidenius,
“uPAR-induced cell adhesion and migration: vitronectin provides the key,”
J. Cell Biol., 177
(5), 927
–939
(2007). 0021-9525 Google Scholar
A. K. Kenworthy,
B. J. Nichols,
C. L. Remmert,
G. M. Hendrix,
M. Kumar,
J. Zimmerberg, and
J. Lippincott-Schwartz,
“Dynamics of putative raft-associated proteins at the cell surface,”
J. Cell Biol., 165
(5), 735
–746
(2004). https://doi.org/10.1083/jcb.200312170 0021-9525 Google Scholar
P. F. Lenne,
L. Wawrezinieck,
F. Conchonaud,
O. Wurtz,
A. Boned,
X. J. Guo,
H. Rigneault,
H. He, and
D. Marguet,
“Dynamic molecular confinement in the plasma membrane by microdomains and the cytoskeleton meshwork,”
EMBO J., 25
(14), 3245
–3256
(2006). https://doi.org/10.1038/sj.emboj.7601214 0261-4189 Google Scholar
U. Meseth,
T. Wohland,
R. Rigler, and
H. Vogel,
“Resolution of fluorescence correlation measurements,”
Biophys. J., 76
(3), 1619
–1631
(1999). 0006-3495 Google Scholar
Y. Chen,
L. N. Wei, and
J. D. Muller,
“Probing protein oligomerization in living cells with fluorescence fluctuation spectroscopy,”
Proc. Natl. Acad. Sci. U.S.A., 100
(26), 15492
–15497
(2003). https://doi.org/10.1073/pnas.2533045100 0027-8424 Google Scholar
Y. Chen,
L. N. Wei, and
J. D. Muller,
“Unraveling protein-protein interactions in living cells with fluorescence fluctuation brightness analysis,”
Biophys. J., 88
(6), 4366
–4377
(2005). 0006-3495 Google Scholar
P. Schwille,
J. Korlach, and
W. W. Webb,
“Fluorescence correlation spectroscopy with single-molecule sensitivity on cell and model membranes,”
Cytometry, 36
(3), 176
–182
(1999). https://doi.org/10.1002/(SICI)1097-0320(19990701)36:3<176::AID-CYTO5>3.0.CO;2-F 0196-4763 Google Scholar
M. Weiss,
H. Hashimoto, and
T. Nilsson,
“Anomalous protein diffusion in living cells as seen by fluorescence correlation spectroscopy,”
Biophys. J., 84
(6), 4043
–4052
(2003). 0006-3495 Google Scholar
I. F. Sbalzarini,
A. Mezzacasa,
A. Helenius, and
P. Koumoutsakos,
“Effects of organelle shape on fluorescence recovery after photobleaching,”
Biophys. J., 89
(3), 1482
–1492
(2005). 0006-3495 Google Scholar
P. Chaurasia,
J. A. Aguirre-Ghiso,
O. D. Liang,
H. Gardsvoll,
M. Ploug, and
L. Ossowski,
“A region in urokinase plasminogen receptor domain III controlling a functional association with alpha5beta1 integrin and tumor growth,”
J. Biol. Chem., 281
(21), 14852
–14863
(2006). 0021-9258 Google Scholar
M. Resnati,
I. Pallavicini,
J. M. Wang,
J. Oppenheim,
C. N. Serhan,
M. Romano, and
F. Blasi,
“The fibrinolytic receptor for urokinase activates the G protein-coupled chemotactic receptor FPRL1/LXA4R,”
Proc. Natl. Acad. Sci. U.S.A., 99
(3), 1359
–1364
(2002). 0027-8424 Google Scholar
C. Selleri,
N. Montuori,
P. Ricci,
V. Visconte,
A. Baiano,
M. V. Carriero,
B. Rotoli,
G. Rossi, and
P. Ragno,
“In vivo activity of the cleaved form of soluble urokinase receptor: a new hematopoietic stem/progenitor cell mobilizer,”
Cancer Res., 66
(22), 10885
–10890
(2006). 0008-5472 Google Scholar
M. Conese,
A. Nykjaer,
C. M. Petersen,
O. Cremona,
R. Pardi,
P. A. Andreasen,
J. Gliemann,
E. I. Christensen, and
F. Blasi,
“alpha-2 macroglobulin receptor/Ldl receptor-related protein(Lrp)-dependent internalization of the urokinase receptor,”
J. Cell Biol., 131
(6, Pt 1), 1609
–1622
(1995). 0021-9525 Google Scholar
Y. Li,
J. M. Knisely,
W. Lu,
L. M. McCormick,
J. Wang,
J. Henkin,
A. L. Schwartz, and
G. Bu,
“Low density lipoprotein (LDL) receptor-related protein 1B impairs urokinase receptor regeneration on the cell surface and inhibits cell migration,”
J. Biol. Chem., 277
(44), 42366
–42371
(2002). 0021-9258 Google Scholar
B. Chazaud,
S. Bonavaud,
A. Plonquet,
M. Pouchelet,
R. K. Gherardi, and
G. Barlovatz-Meimon,
“Involvement of the [uPAR:uPA:PAI-1:LRP] complex in human myogenic cell motility,”
Exp. Cell Res., 258
(2), 237
–244
(2000). 0014-4827 Google Scholar
|


